| Param | Original file | Final file |
|---|---|---|
| Filename | modeM0/AS1A08_009T01_9000003382_22882cztM0_level2.evt | modeM0/AS1A08_009T01_9000003382_22882cztM0_level2_quad_clean.evt |
| Size (bytes) | 302,529,600 | 63,944,640 |
| Size | 288.5 MB | 61.0 MB |
| Events in quadrant A | 1,918,018 | 422,733 |
| Events in quadrant B | 2,259,515 | 435,818 |
| Events in quadrant C | 1,945,402 | 410,221 |
| Events in quadrant D | 2,773,106 | 392,304 |
| Mode M9 | |||
|---|---|---|---|
| Quadrant | BADHDUFLAG | Total packets | Discarded packets |
| A | 0 | 12 | 0 |
| B | 0 | 12 | 0 |
| C | 0 | 12 | 0 |
| D | 0 | 12 | 0 |
| Mode M0 | |||
|---|---|---|---|
| Quadrant | BADHDUFLAG | Total packets | Discarded packets |
| A | 0 | 8095 | 2 |
| B | 0 | 9245 | 1 |
| C | 0 | 8246 | 1 |
| D | 0 | 10899 | 1 |
| Mode SS | |||
|---|---|---|---|
| Quadrant | BADHDUFLAG | Total packets | Discarded packets |
| A | 0 | 80 | 0 |
| B | 0 | 80 | 0 |
| C | 0 | 80 | 0 |
| D | 0 | 80 | 0 |
| Quadrant | Total seconds | Saturated seconds | Saturation percentage |
|---|---|---|---|
| A | 3898 | 20 | 0.513084% |
| B | 3898 | 54 | 1.385326% |
| C | 3898 | 49 | 1.257055% |
| D | 3898 | 155 | 3.976398% |
Noise dominated data is calculated using 1-second bins in cleaned event files. If a bin has >2000 counts, and if more than 50% of those come from <1% of pixels, then it is considered to be noise-dominated and hence unusable.
| Quadrant | # 1 sec bins | Bins with >0 counts | Bins with >2000 counts | High rate bins dominated by noise | Noise dominated (total time) | Noise dominated (detector-on time) | Marked lightcurve |
|---|---|---|---|---|---|---|---|
| A | 5083 | 3899 | 0 | 0 | 0.00% | 0.00% | 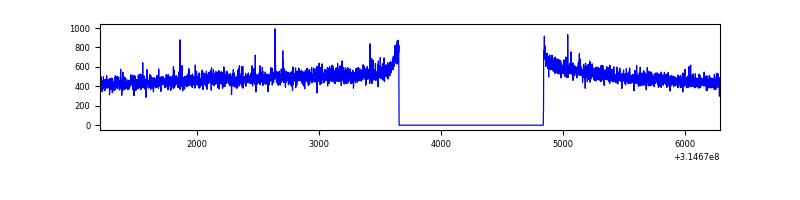 |
| B | 5083 | 3899 | 1 | 1 | 0.02% | 0.03% | 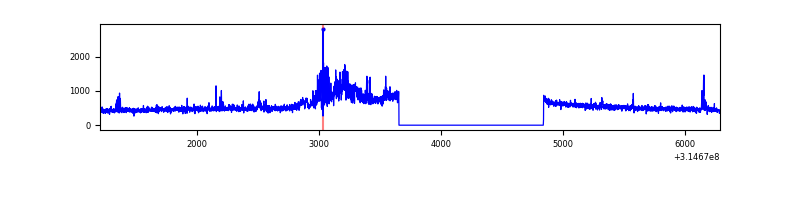 |
| C | 5083 | 3899 | 0 | 0 | 0.00% | 0.00% | 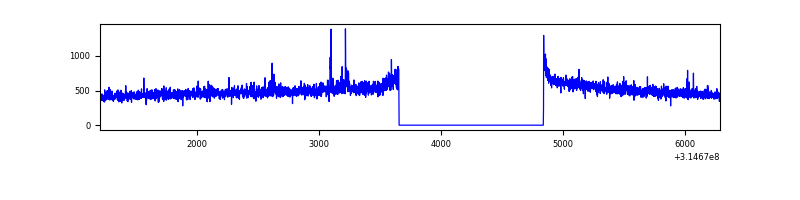 |
| D | 5083 | 3899 | 87 | 87 | 1.71% | 2.23% | 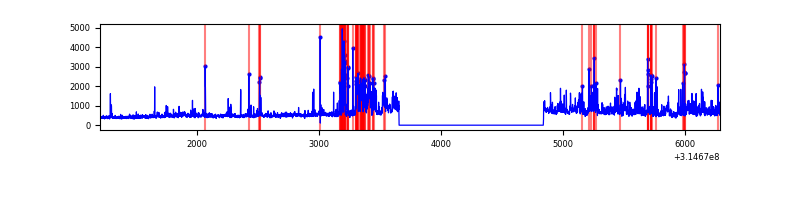 |
Top three noisy pixels from each quadrant. If the there are fewer than three noisy pixels in the level2.evt file, extra rows are filled as -1
| Pixel properties | Quadrant properties | ||||||
|---|---|---|---|---|---|---|---|
| Quadrant | DetID | PixID | Counts | Sigma | Mean | Median | Sigma |
| A | 13 | 254 | 6408 | 59.82 | 496 | 487 | 99.0 |
| A | 0 | 226 | 4397 | 39.51 | 496 | 487 | 99.0 |
| A | 3 | 137 | 3920 | 34.69 | 496 | 487 | 99.0 |
| B | 0 | 190 | 179852 | 1917.63 | 494 | 481 | 93.5 |
| B | 3 | 209 | 77295 | 821.21 | 494 | 481 | 93.5 |
| B | 3 | 64 | 24215 | 253.74 | 494 | 481 | 93.5 |
| C | 14 | 238 | 76807 | 696.33 | 471 | 473 | 109.6 |
| C | 2 | 16 | 19120 | 170.1 | 471 | 473 | 109.6 |
| C | 7 | 247 | 9564 | 82.93 | 471 | 473 | 109.6 |
| D | 7 | 238 | 555076 | 4810.72 | 471 | 455 | 115.3 |
| D | 1 | 52 | 174998 | 1513.96 | 471 | 455 | 115.3 |
| D | 5 | 32 | 90544 | 781.42 | 471 | 455 | 115.3 |
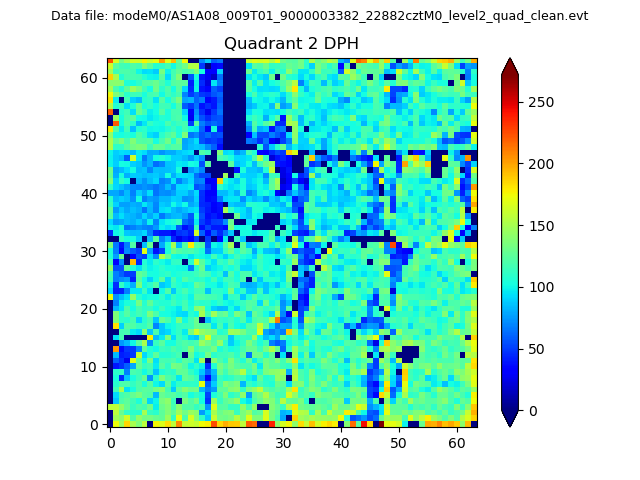
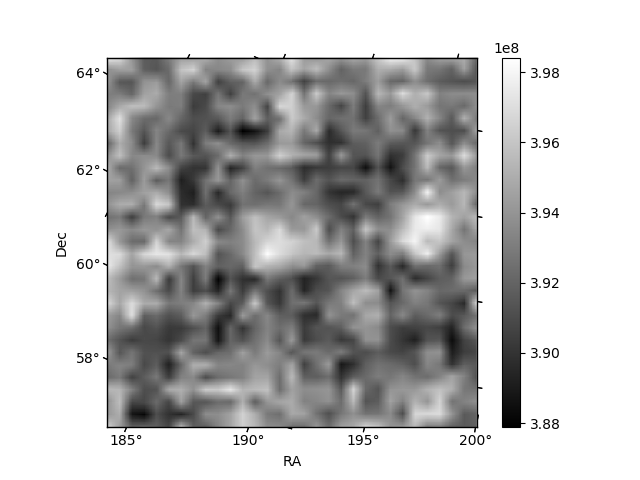
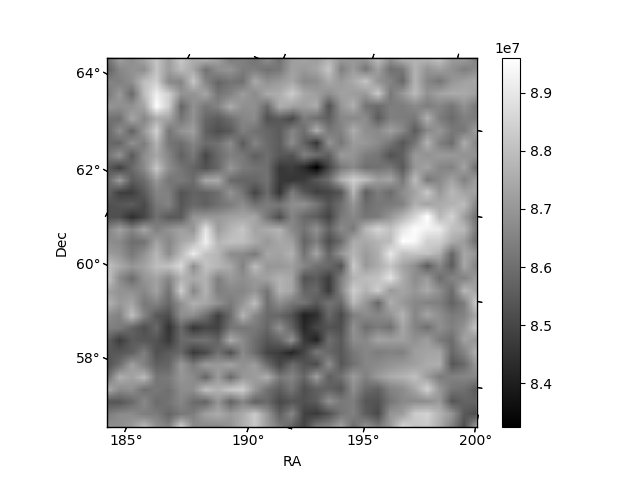
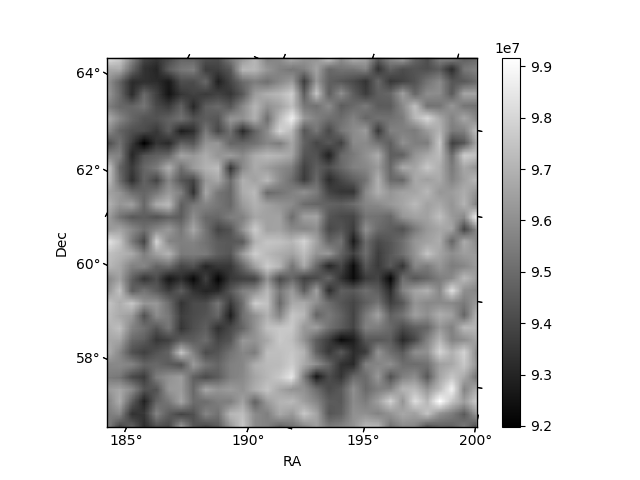
Histogram calculated using DETX and DETY for each event in the final _common_clean file
| Quadrant A | 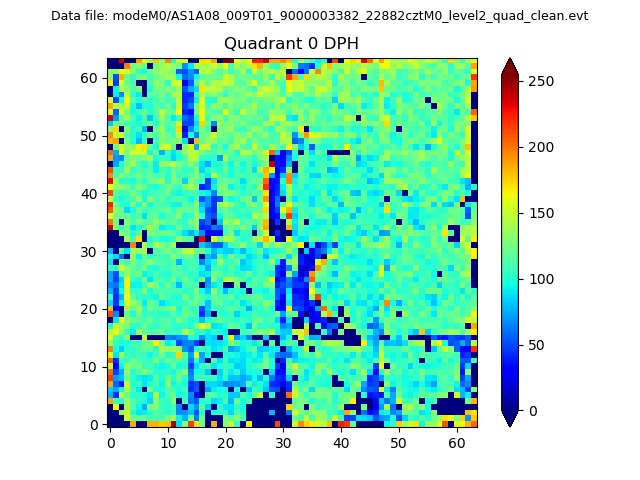 |
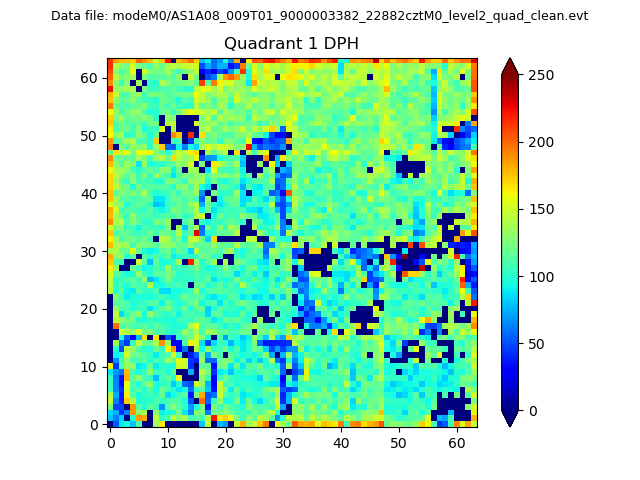 |
Quadrant B |
|---|---|---|---|
| Quadrant D | 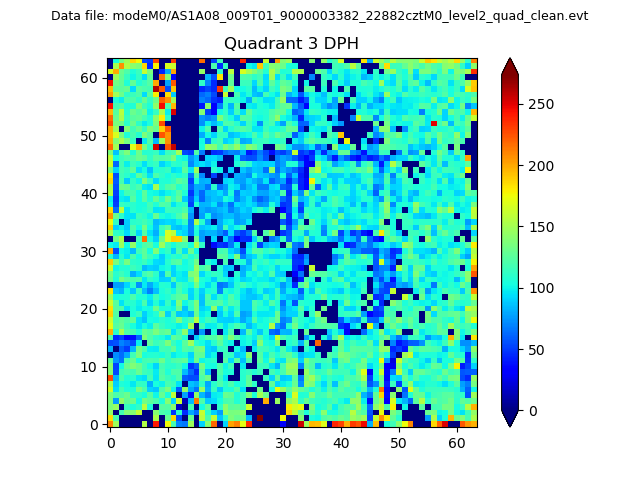 |
 |
Quadrant C |
| Plot type | Count rate plots | Images |
|---|---|---|
| Comparison with Poisson distribution Blue bars denote a histogram of data divided into 1 sec bins. Red curve is a Poisson curve with rate = median count rate of data. |
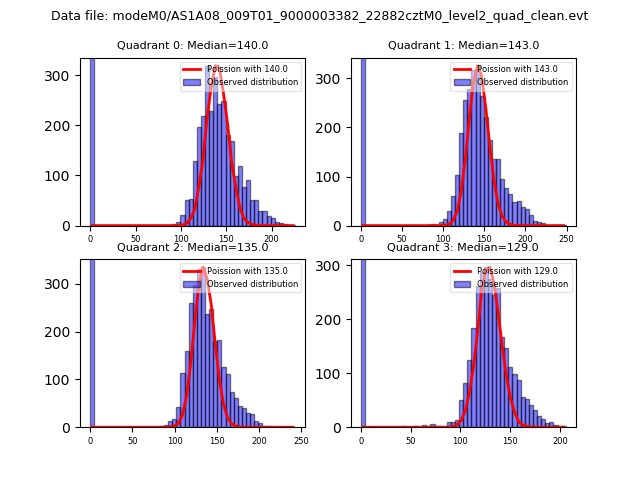 |
 |
| Quadrant-wise count rates Data is divided into 100 sec bins |
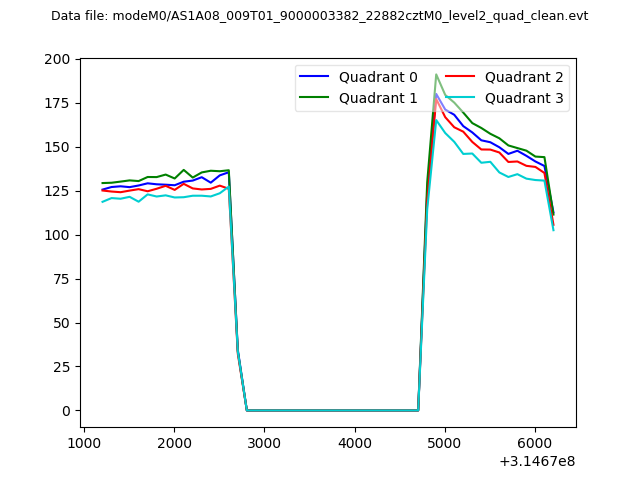 |
|
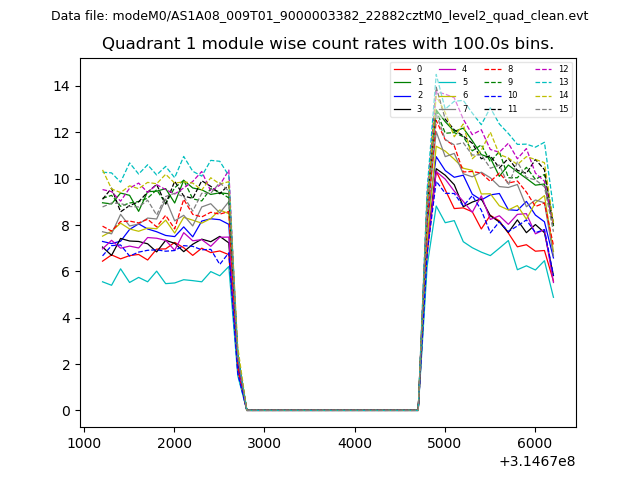
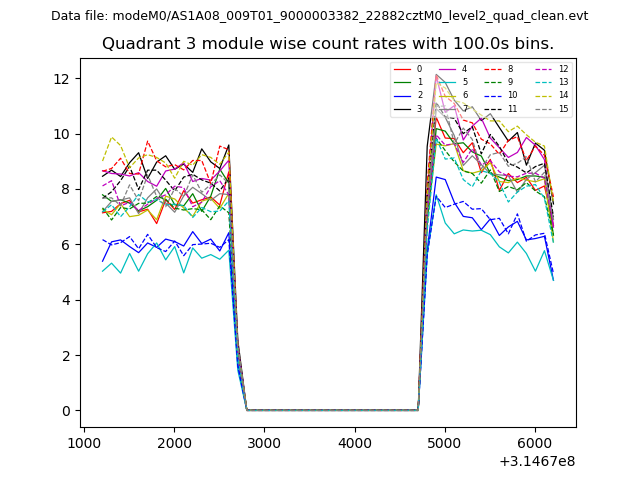
| Module-wise count rates for Quadrant A Data is divided into 100 sec bins |
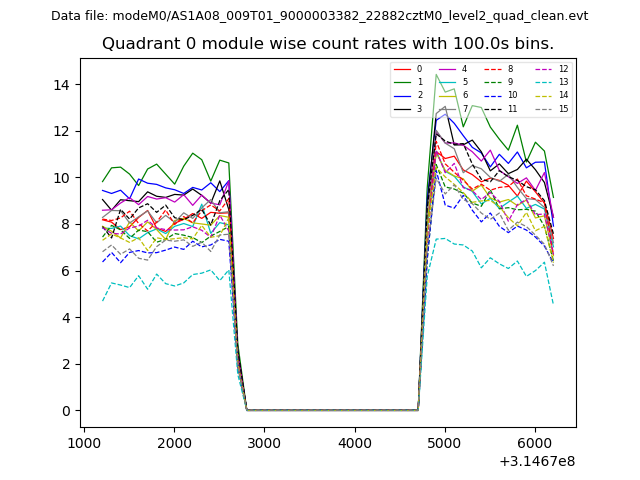 |
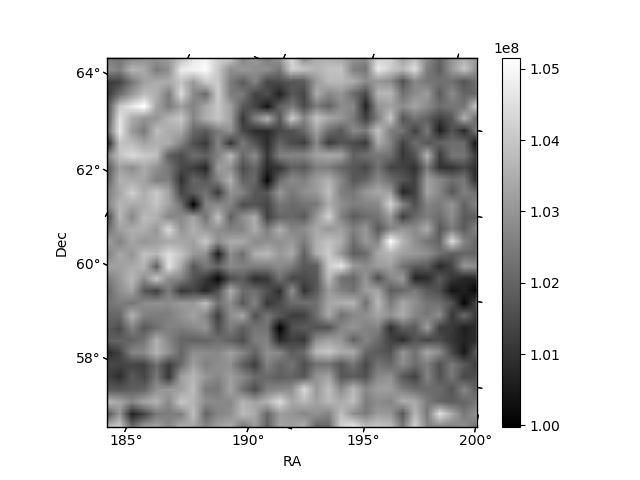 |
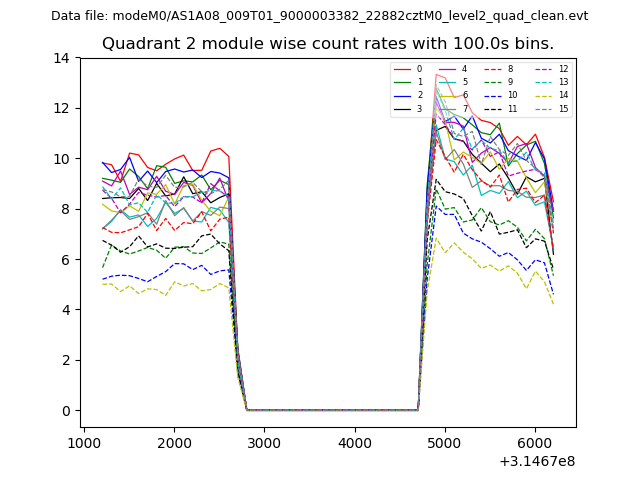
| Module-wise count rates for Quadrant B Data is divided into 100 sec bins |
 |
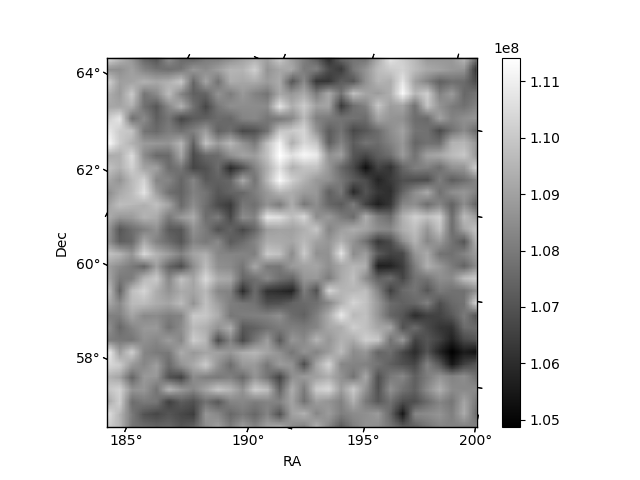 |
| Module-wise count rates for Quadrant C Data is divided into 100 sec bins |
 |
 |
| Module-wise count rates for Quadrant D Data is divided into 100 sec bins |
 |
 |
| Parameter | Plot |
|---|---|
| CZT HV Monitor | 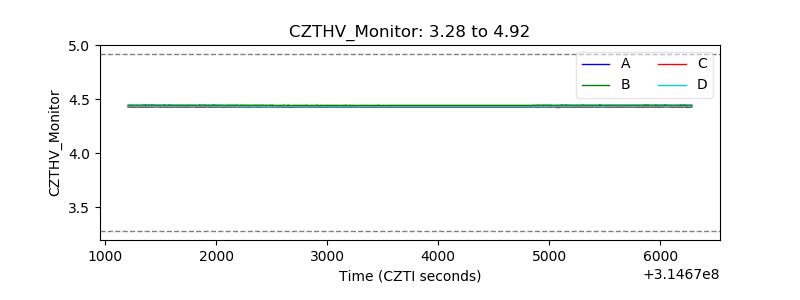 |
| D_VDD | 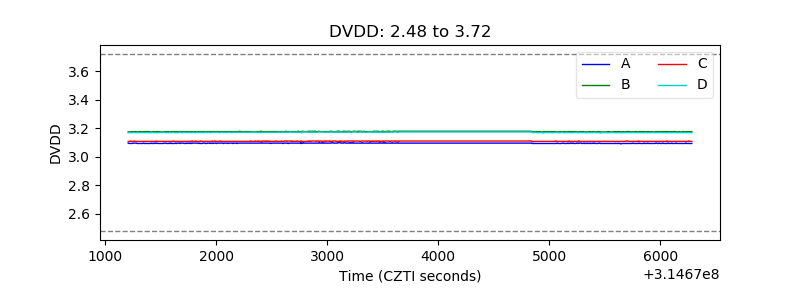 |
| Temperature 1 | 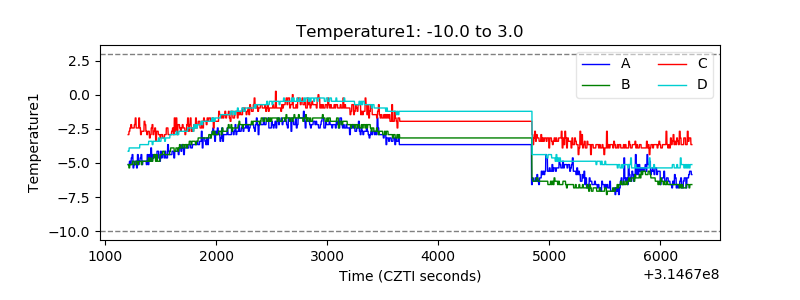 |
| Veto HV Monitor | 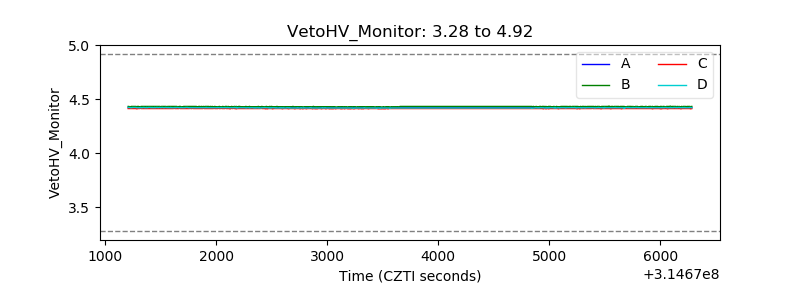 |
| Veto LLD | 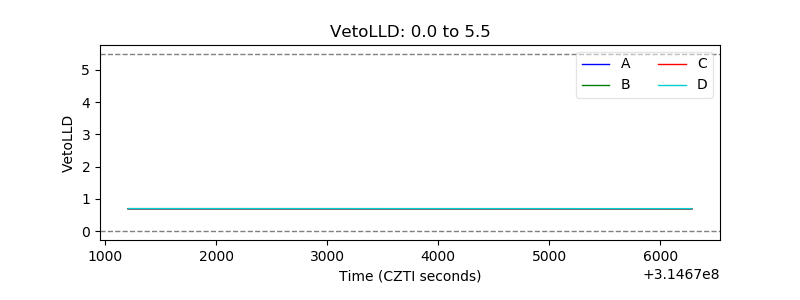 |
| Alpha Counter | 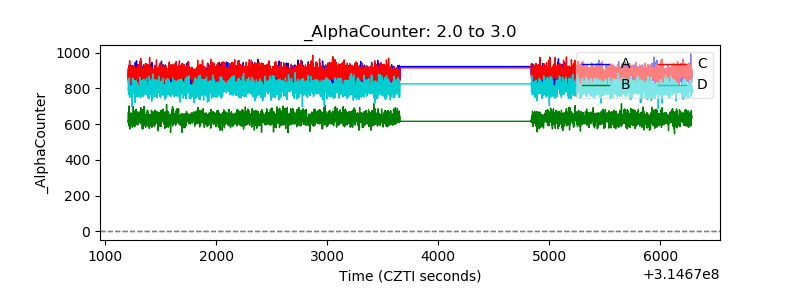 |
| _CPM_Rate | 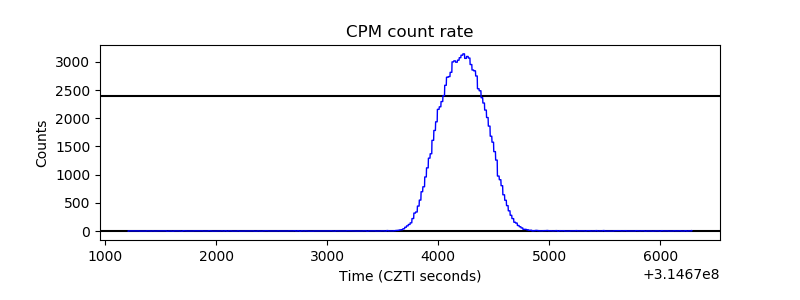 |
| CZT Counter | 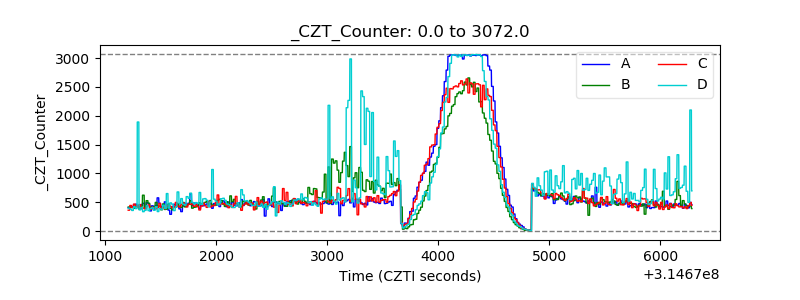 |
| +2.5 Volts monitor | 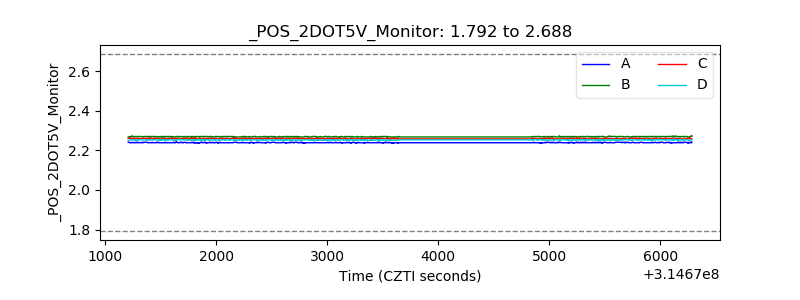 |
| +5 Volts monitor |  |
| _ROLL_ROT | 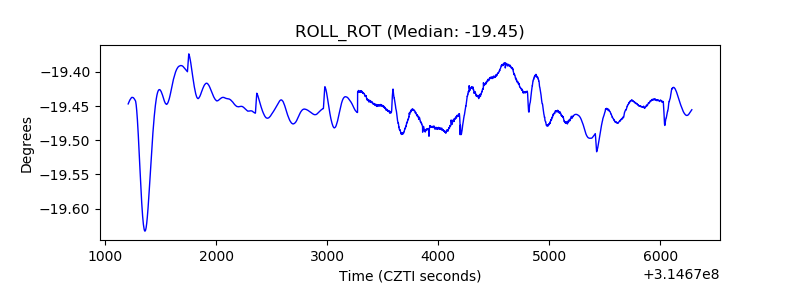 |
| _Roll_DEC | 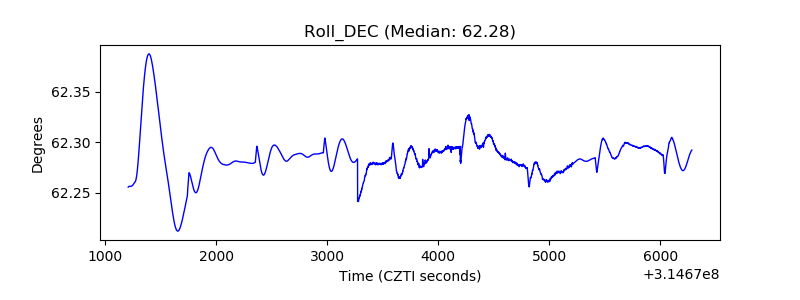 |
| _Roll_RA | 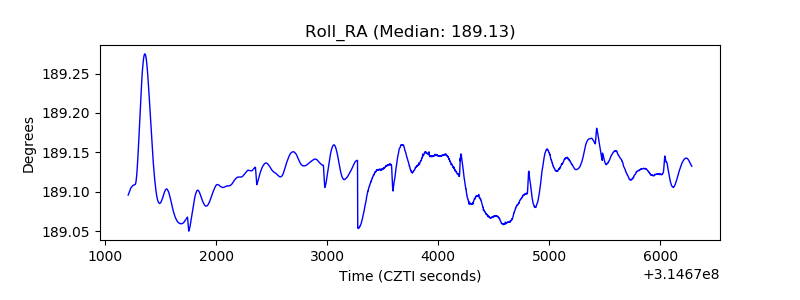 |
| Veto Counter | 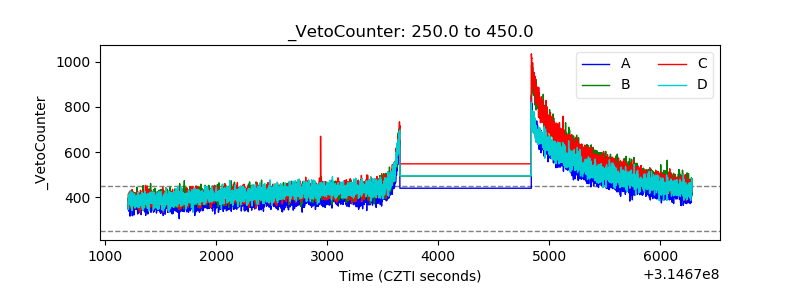 |