| Param | Original file | Final file |
|---|---|---|
| Filename | modeM0/AS1A08_009T01_9000003382_22883cztM0_level2.evt | modeM0/AS1A08_009T01_9000003382_22883cztM0_level2_quad_clean.evt |
| Size (bytes) | 512,110,080 | 108,190,080 |
| Size | 488.4 MB | 103.2 MB |
| Events in quadrant A | 3,054,094 | 737,825 |
| Events in quadrant B | 3,170,343 | 760,137 |
| Events in quadrant C | 3,078,394 | 710,453 |
| Events in quadrant D | 5,780,700 | 630,195 |
| Mode M9 | |||
|---|---|---|---|
| Quadrant | BADHDUFLAG | Total packets | Discarded packets |
| A | 0 | 18 | 0 |
| B | 0 | 19 | 0 |
| C | 0 | 19 | 0 |
| D | 0 | 19 | 0 |
| Mode M0 | |||
|---|---|---|---|
| Quadrant | BADHDUFLAG | Total packets | Discarded packets |
| A | 0 | 13019 | 2 |
| B | 0 | 13404 | 2 |
| C | 0 | 13168 | 2 |
| D | 0 | 21545 | 3 |
| Mode SS | |||
|---|---|---|---|
| Quadrant | BADHDUFLAG | Total packets | Discarded packets |
| A | 0 | 128 | 0 |
| B | 0 | 128 | 0 |
| C | 0 | 128 | 0 |
| D | 0 | 128 | 0 |
| Quadrant | Total seconds | Saturated seconds | Saturation percentage |
|---|---|---|---|
| A | 6272 | 18 | 0.286990% |
| B | 6272 | 37 | 0.589923% |
| C | 6272 | 61 | 0.972577% |
| D | 6271 | 765 | 12.199011% |
Noise dominated data is calculated using 1-second bins in cleaned event files. If a bin has >2000 counts, and if more than 50% of those come from <1% of pixels, then it is considered to be noise-dominated and hence unusable.
| Quadrant | # 1 sec bins | Bins with >0 counts | Bins with >2000 counts | High rate bins dominated by noise | Noise dominated (total time) | Noise dominated (detector-on time) | Marked lightcurve |
|---|---|---|---|---|---|---|---|
| A | 7542 | 6273 | 0 | 0 | 0.00% | 0.00% | 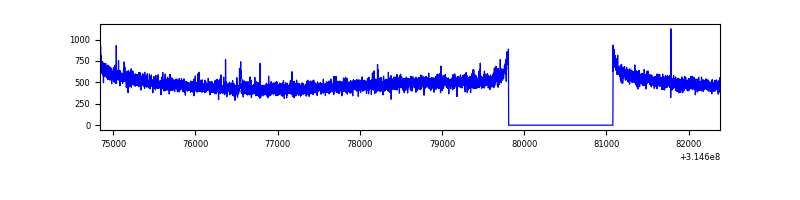 |
| B | 7542 | 6273 | 3 | 3 | 0.04% | 0.05% | 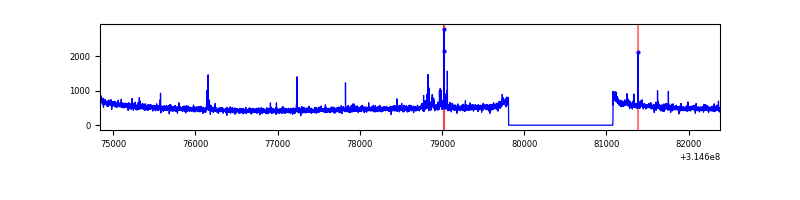 |
| C | 7542 | 6273 | 0 | 0 | 0.00% | 0.00% | 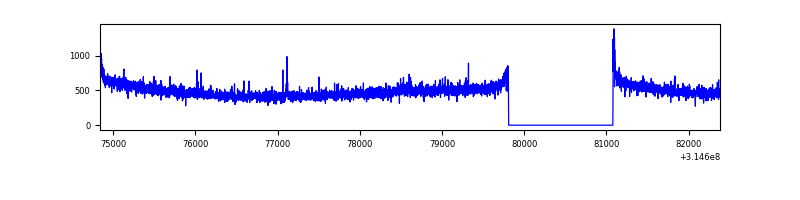 |
| D | 7541 | 6272 | 707 | 707 | 9.38% | 11.27% | 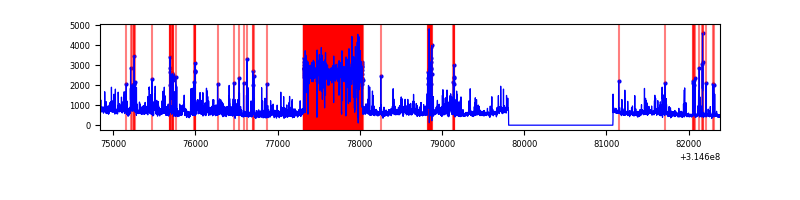 |
Top three noisy pixels from each quadrant. If the there are fewer than three noisy pixels in the level2.evt file, extra rows are filled as -1
| Pixel properties | Quadrant properties | ||||||
|---|---|---|---|---|---|---|---|
| Quadrant | DetID | PixID | Counts | Sigma | Mean | Median | Sigma |
| A | 13 | 254 | 9898 | 58.49 | 790 | 777 | 155.9 |
| A | 0 | 226 | 7068 | 40.34 | 790 | 777 | 155.9 |
| A | 3 | 137 | 6279 | 35.28 | 790 | 777 | 155.9 |
| B | 0 | 190 | 36869 | 247.89 | 790 | 774 | 145.6 |
| B | 12 | 111 | 17378 | 114.03 | 790 | 774 | 145.6 |
| B | 11 | 111 | 15086 | 98.29 | 790 | 774 | 145.6 |
| C | 14 | 238 | 121702 | 705.91 | 750 | 755 | 171.3 |
| C | 7 | 247 | 19088 | 107.0 | 750 | 755 | 171.3 |
| C | 0 | 10 | 14324 | 79.2 | 750 | 755 | 171.3 |
| D | 1 | 52 | 1885931 | 10984.22 | 711 | 692 | 171.6 |
| D | 7 | 238 | 932363 | 5428.32 | 711 | 692 | 171.6 |
| D | 13 | 153 | 100788 | 583.2 | 711 | 692 | 171.6 |
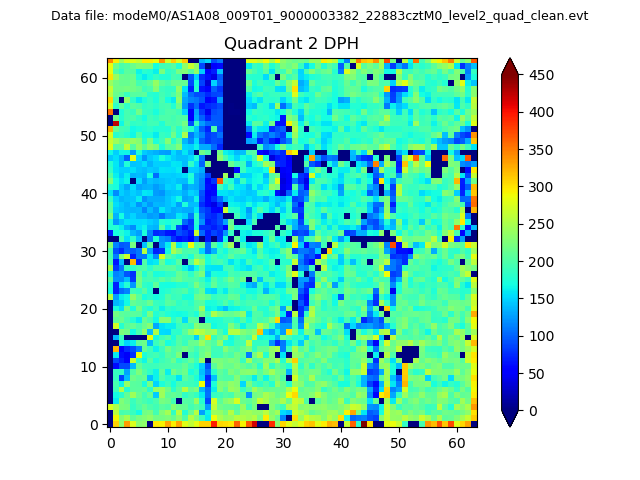
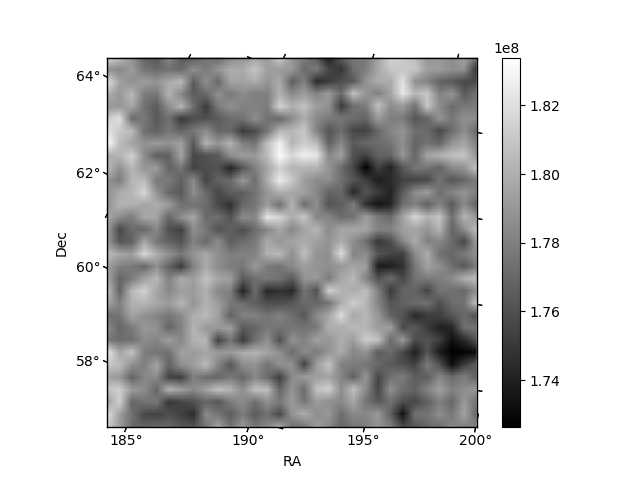
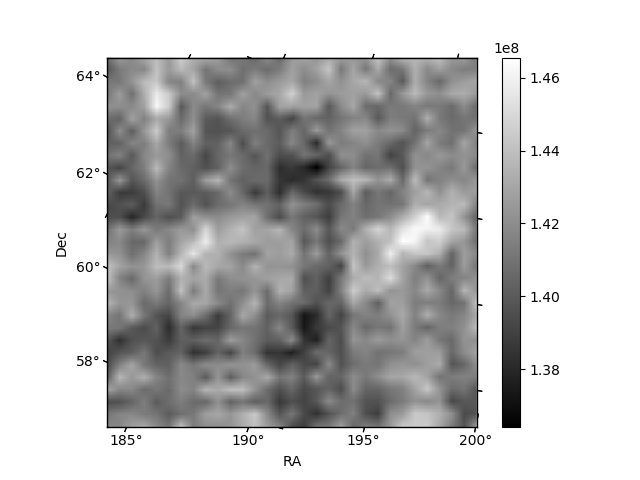
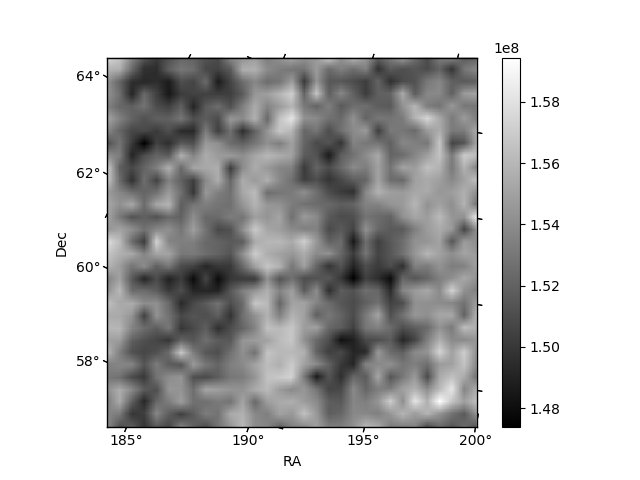
Histogram calculated using DETX and DETY for each event in the final _common_clean file
| Quadrant A | 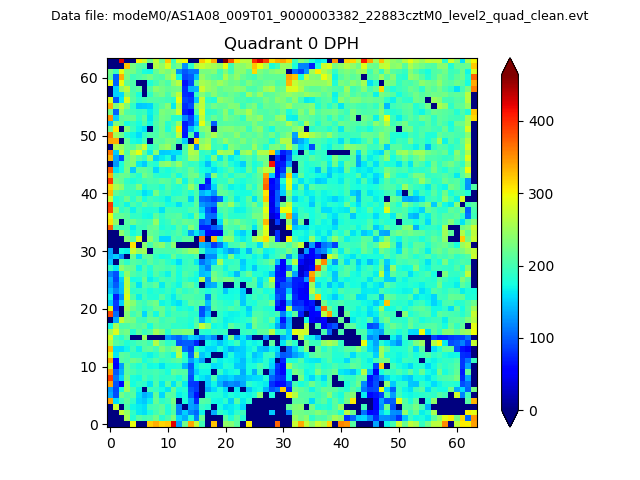 |
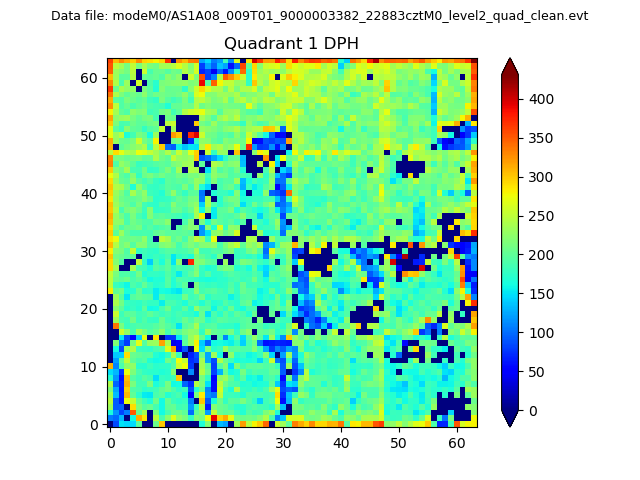 |
Quadrant B |
|---|---|---|---|
| Quadrant D | 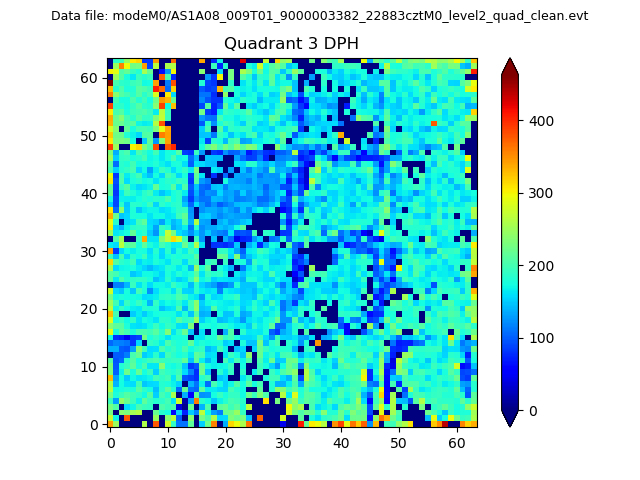 |
 |
Quadrant C |
| Plot type | Count rate plots | Images |
|---|---|---|
| Comparison with Poisson distribution Blue bars denote a histogram of data divided into 1 sec bins. Red curve is a Poisson curve with rate = median count rate of data. |
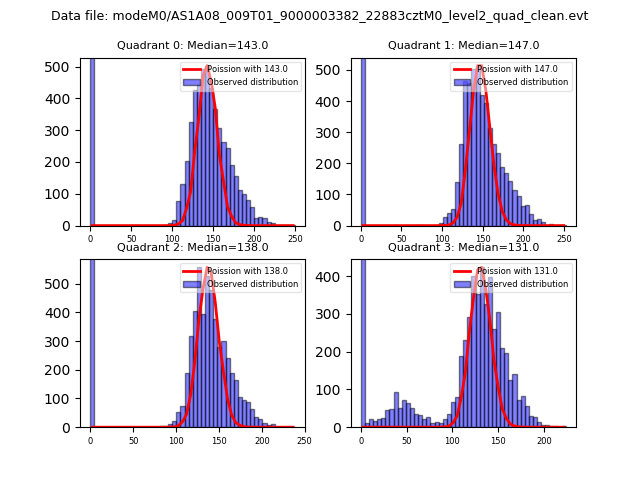 |
 |
| Quadrant-wise count rates Data is divided into 100 sec bins |
 |
|
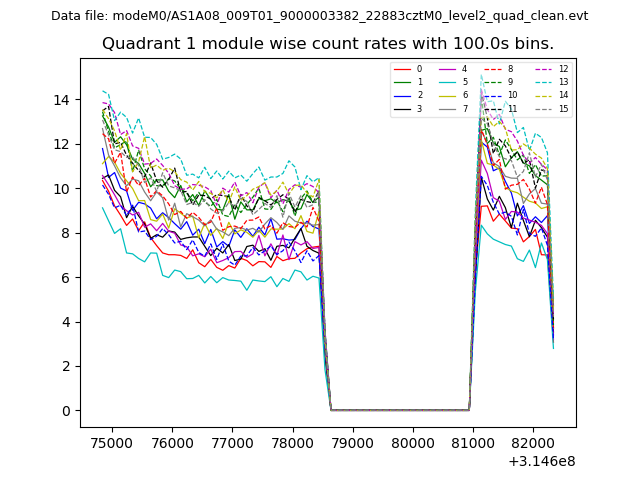
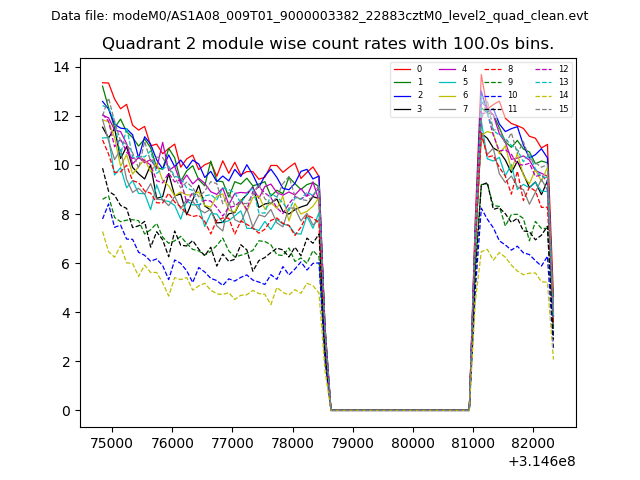
| Module-wise count rates for Quadrant A Data is divided into 100 sec bins |
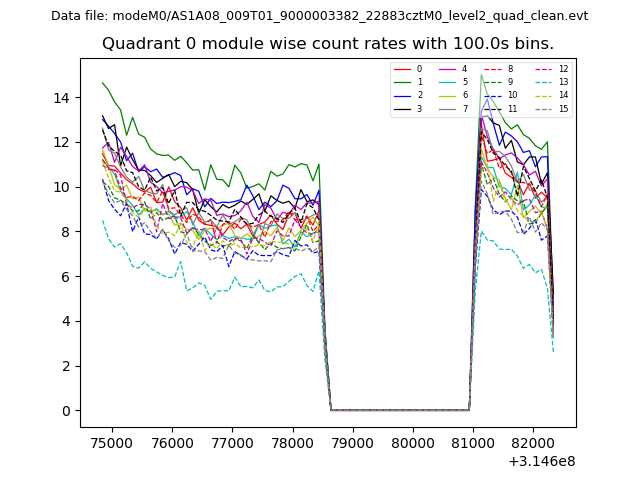 |
 |
| Module-wise count rates for Quadrant B Data is divided into 100 sec bins |
 |
 |
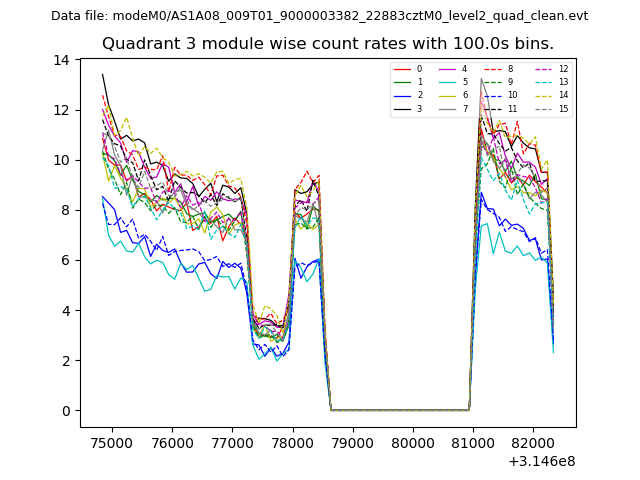
| Module-wise count rates for Quadrant C Data is divided into 100 sec bins |
 |
 |
| Module-wise count rates for Quadrant D Data is divided into 100 sec bins |
 |
 |
| Parameter | Plot |
|---|---|
| CZT HV Monitor | 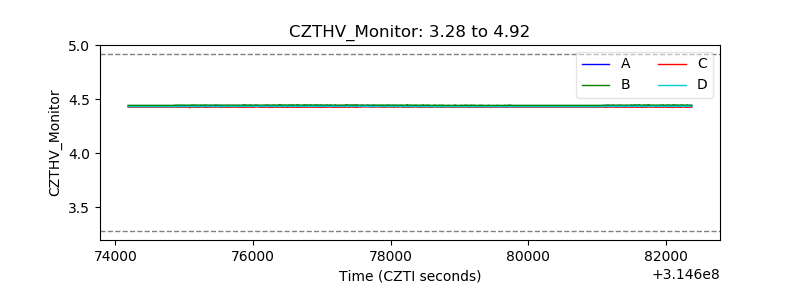 |
| D_VDD | 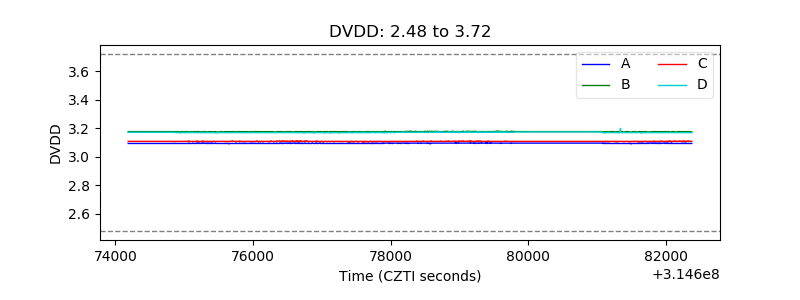 |
| Temperature 1 | 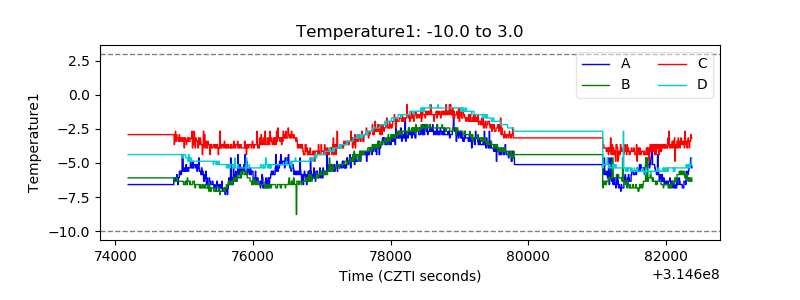 |
| Veto HV Monitor | 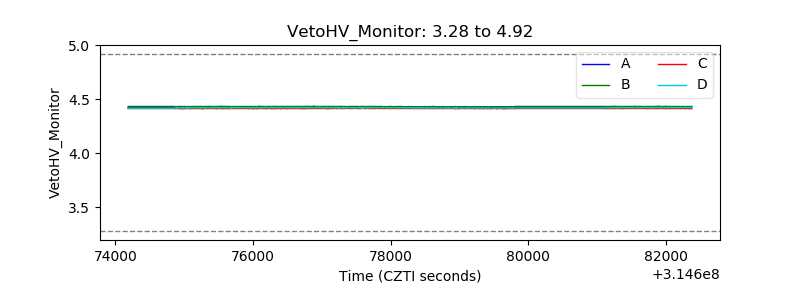 |
| Veto LLD | 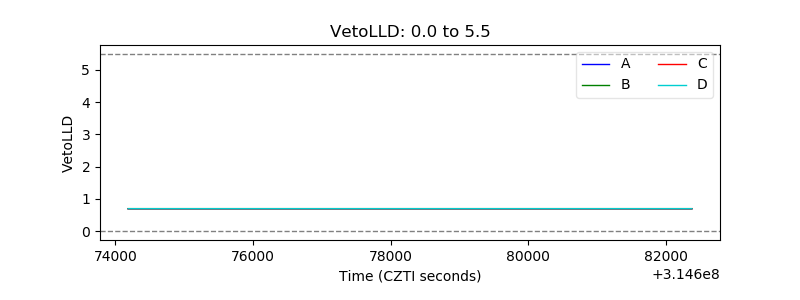 |
| Alpha Counter | 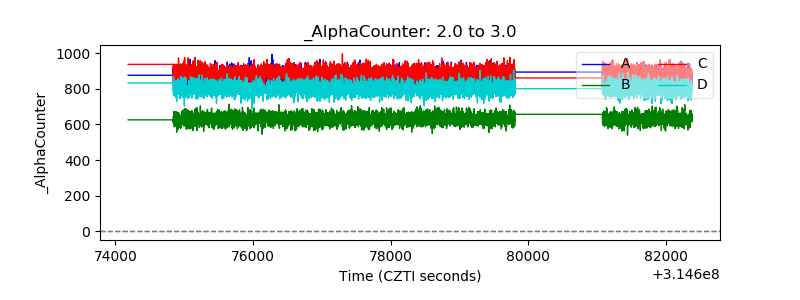 |
| _CPM_Rate |  |
| CZT Counter | 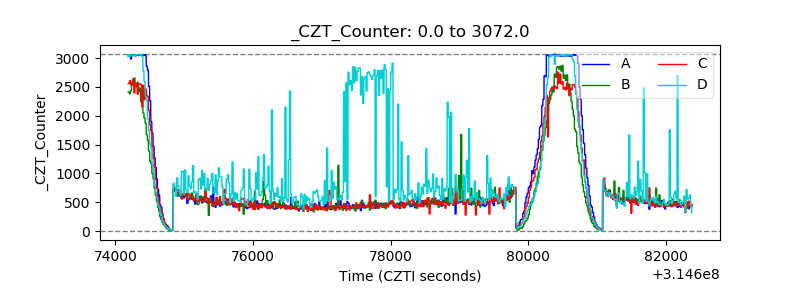 |
| +2.5 Volts monitor |  |
| +5 Volts monitor | 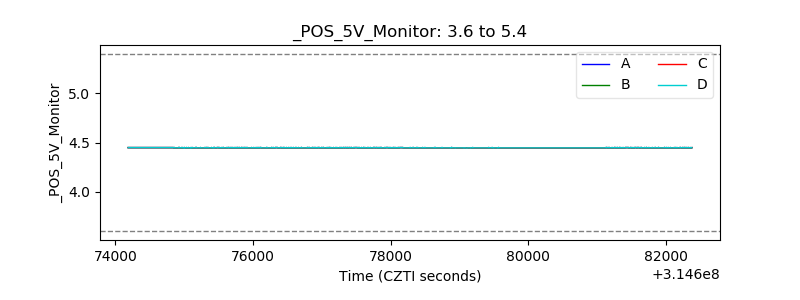 |
| _ROLL_ROT | 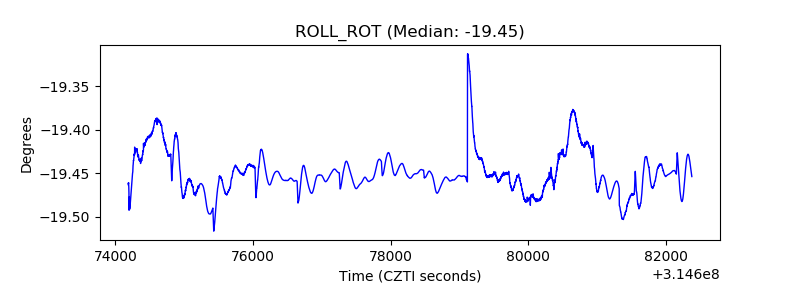 |
| _Roll_DEC | 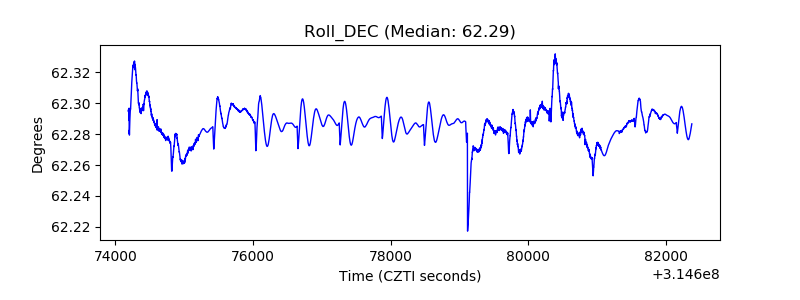 |
| _Roll_RA | 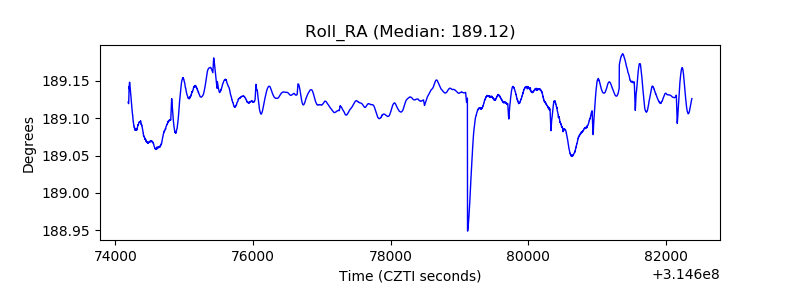 |
| Veto Counter | 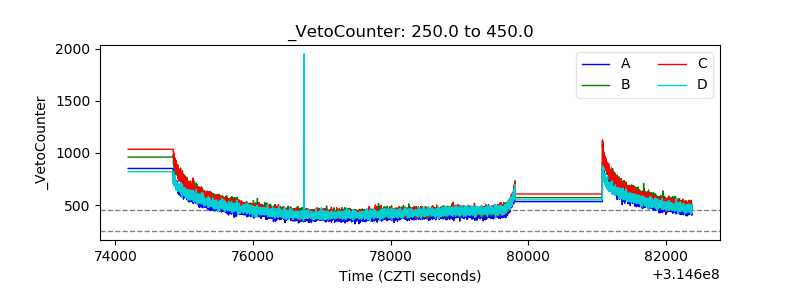 |