| Param | Original file | Final file |
|---|---|---|
| Filename | modeM0/AS1A08_009T01_9000003382_22885cztM0_level2.evt | modeM0/AS1A08_009T01_9000003382_22885cztM0_level2_quad_clean.evt |
| Size (bytes) | 410,348,160 | 90,708,480 |
| Size | 391.3 MB | 86.5 MB |
| Events in quadrant A | 2,772,202 | 604,294 |
| Events in quadrant B | 2,951,749 | 608,904 |
| Events in quadrant C | 2,737,083 | 574,099 |
| Events in quadrant D | 3,577,365 | 559,691 |
| Mode M9 | |||
|---|---|---|---|
| Quadrant | BADHDUFLAG | Total packets | Discarded packets |
| A | 0 | 13 | 0 |
| B | 0 | 13 | 0 |
| C | 0 | 13 | 0 |
| D | 0 | 13 | 0 |
| Mode M0 | |||
|---|---|---|---|
| Quadrant | BADHDUFLAG | Total packets | Discarded packets |
| A | 0 | 11712 | 1 |
| B | 0 | 12233 | 1 |
| C | 0 | 11727 | 1 |
| D | 0 | 14223 | 1 |
| Mode SS | |||
|---|---|---|---|
| Quadrant | BADHDUFLAG | Total packets | Discarded packets |
| A | 0 | 116 | 0 |
| B | 0 | 116 | 0 |
| C | 0 | 116 | 0 |
| D | 0 | 116 | 0 |
| Quadrant | Total seconds | Saturated seconds | Saturation percentage |
|---|---|---|---|
| A | 5721 | 40 | 0.699178% |
| B | 5721 | 70 | 1.223562% |
| C | 5721 | 42 | 0.734137% |
| D | 5722 | 141 | 2.464173% |
Noise dominated data is calculated using 1-second bins in cleaned event files. If a bin has >2000 counts, and if more than 50% of those come from <1% of pixels, then it is considered to be noise-dominated and hence unusable.
| Quadrant | # 1 sec bins | Bins with >0 counts | Bins with >2000 counts | High rate bins dominated by noise | Noise dominated (total time) | Noise dominated (detector-on time) | Marked lightcurve |
|---|---|---|---|---|---|---|---|
| A | 7016 | 5722 | 0 | 0 | 0.00% | 0.00% | 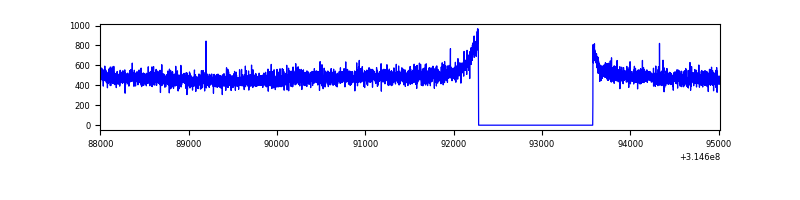 |
| B | 7016 | 5722 | 15 | 15 | 0.21% | 0.26% | 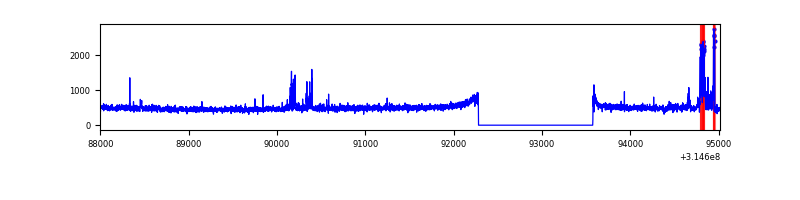 |
| C | 7016 | 5722 | 0 | 0 | 0.00% | 0.00% | 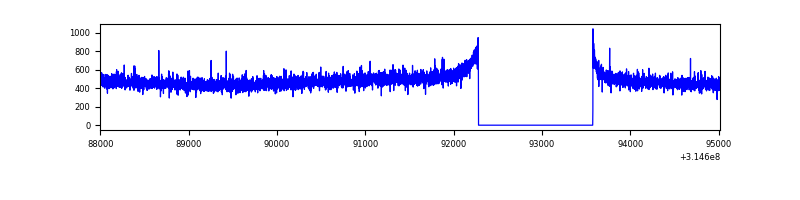 |
| D | 7017 | 5723 | 104 | 104 | 1.48% | 1.82% | 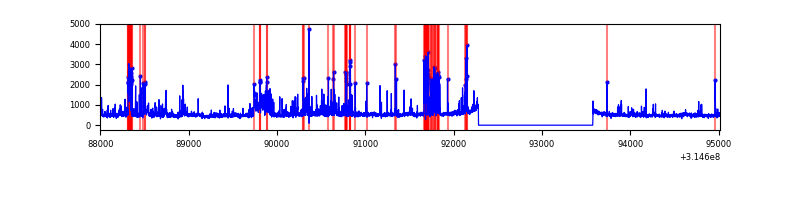 |
Top three noisy pixels from each quadrant. If the there are fewer than three noisy pixels in the level2.evt file, extra rows are filled as -1
| Pixel properties | Quadrant properties | ||||||
|---|---|---|---|---|---|---|---|
| Quadrant | DetID | PixID | Counts | Sigma | Mean | Median | Sigma |
| A | 13 | 254 | 8432 | 53.43 | 719 | 705 | 144.6 |
| A | 0 | 226 | 6232 | 38.22 | 719 | 705 | 144.6 |
| A | 3 | 137 | 5938 | 36.19 | 719 | 705 | 144.6 |
| B | 3 | 64 | 161043 | 1208.63 | 708 | 692 | 132.7 |
| B | 0 | 190 | 20760 | 151.26 | 708 | 692 | 132.7 |
| B | 12 | 111 | 15480 | 111.46 | 708 | 692 | 132.7 |
| C | 14 | 238 | 110287 | 712.86 | 672 | 677 | 153.8 |
| C | 13 | 61 | 4756 | 26.53 | 672 | 677 | 153.8 |
| C | 0 | 10 | 3018 | 15.23 | 672 | 677 | 153.8 |
| D | 7 | 238 | 233088 | 1398.99 | 682 | 664 | 166.1 |
| D | 12 | 233 | 215046 | 1290.39 | 682 | 664 | 166.1 |
| D | 1 | 52 | 202185 | 1212.98 | 682 | 664 | 166.1 |
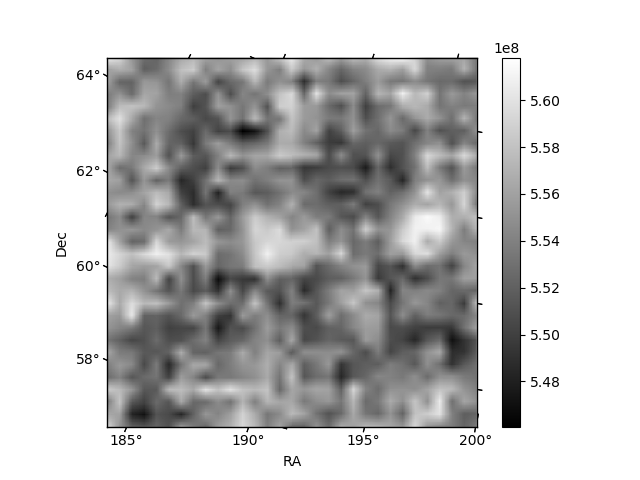
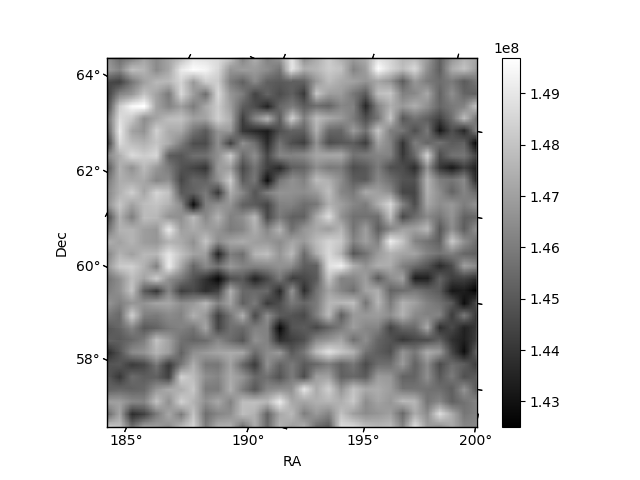
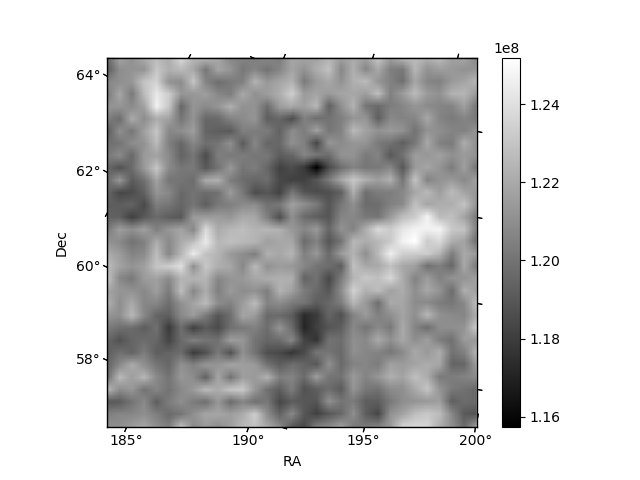
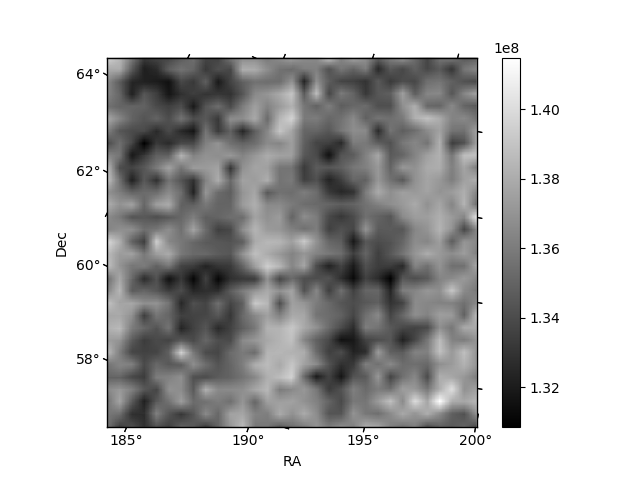
Histogram calculated using DETX and DETY for each event in the final _common_clean file
| Quadrant A | 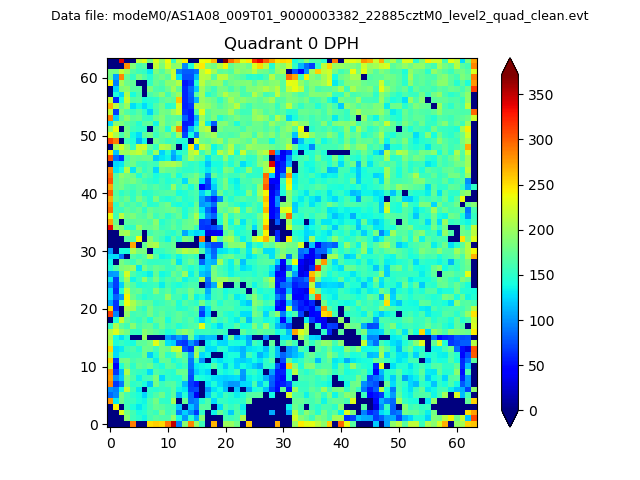 |
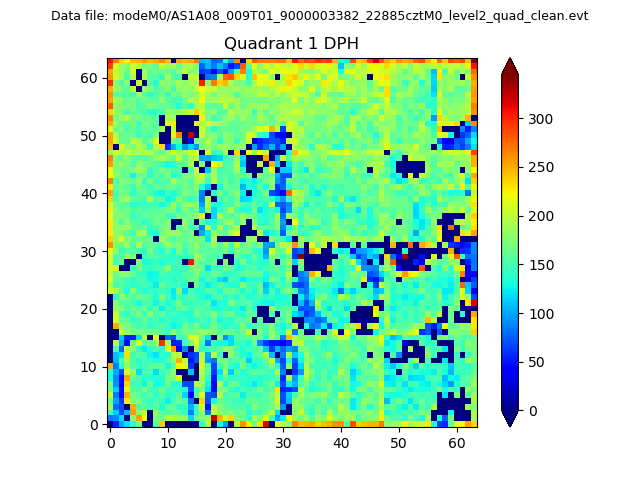 |
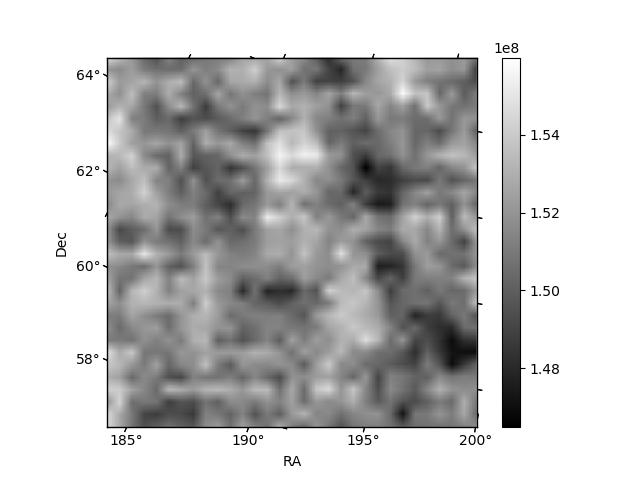
Quadrant B |
|---|---|---|---|
| Quadrant D | 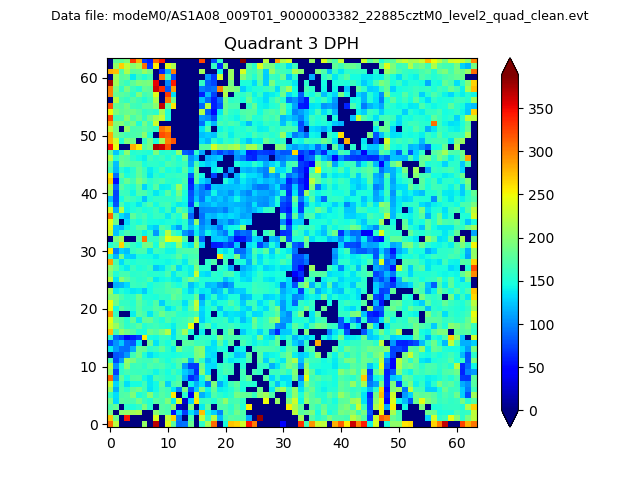 |
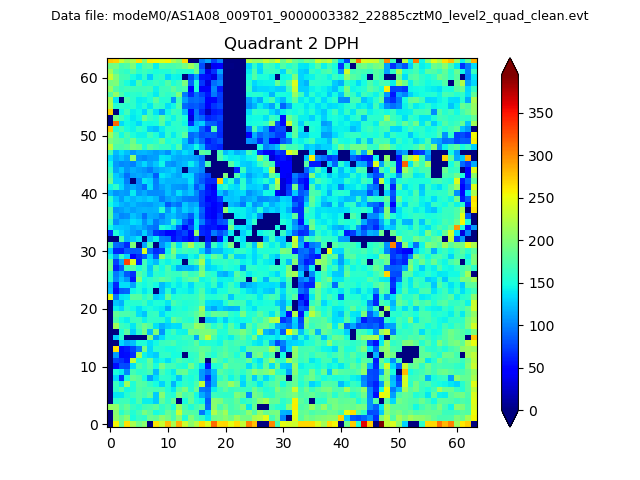 |
Quadrant C |
| Plot type | Count rate plots | Images |
|---|---|---|
| Comparison with Poisson distribution Blue bars denote a histogram of data divided into 1 sec bins. Red curve is a Poisson curve with rate = median count rate of data. |
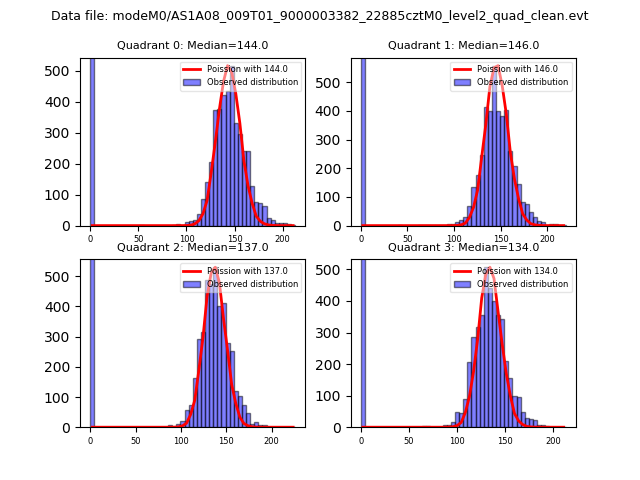 |
 |
| Quadrant-wise count rates Data is divided into 100 sec bins |
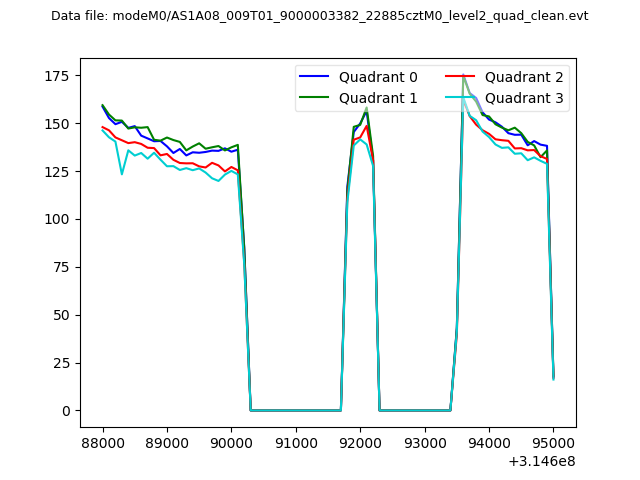 |
|
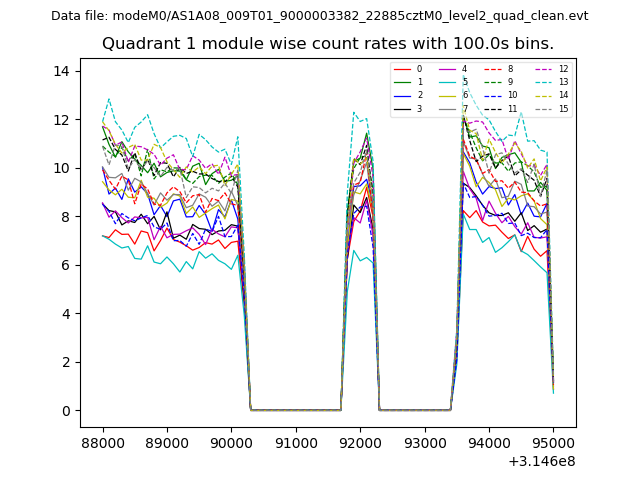
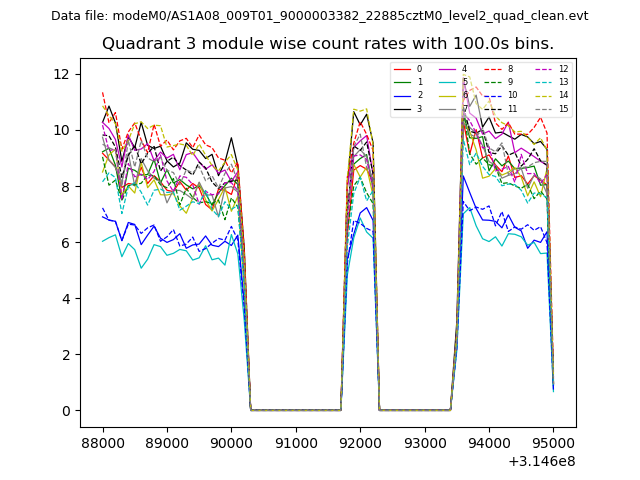
| Module-wise count rates for Quadrant A Data is divided into 100 sec bins |
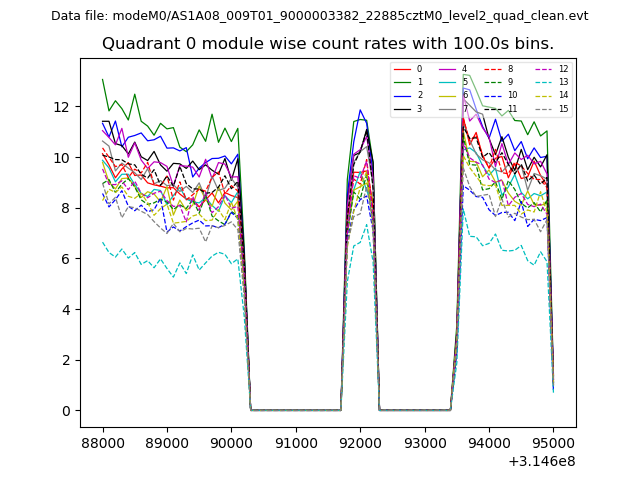 |
 |
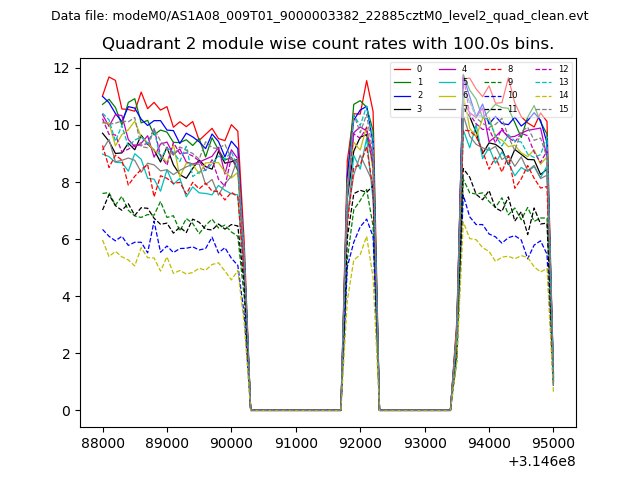
| Module-wise count rates for Quadrant B Data is divided into 100 sec bins |
 |
 |
| Module-wise count rates for Quadrant C Data is divided into 100 sec bins |
 |
 |
| Module-wise count rates for Quadrant D Data is divided into 100 sec bins |
 |
 |
| Parameter | Plot |
|---|---|
| CZT HV Monitor |  |
| D_VDD | 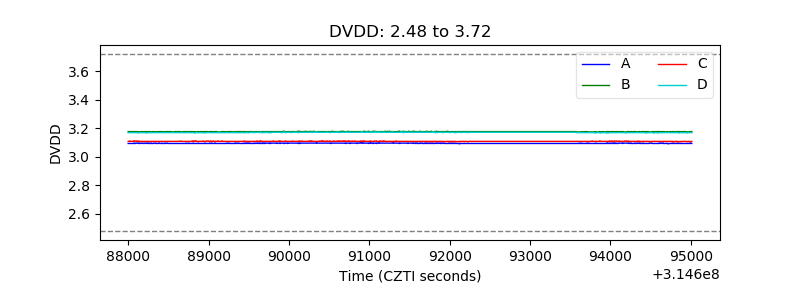 |
| Temperature 1 | 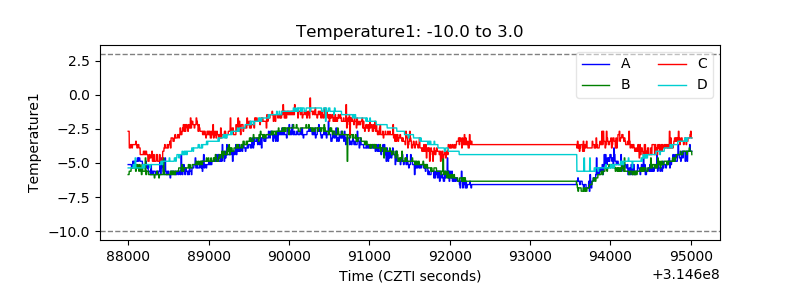 |
| Veto HV Monitor | 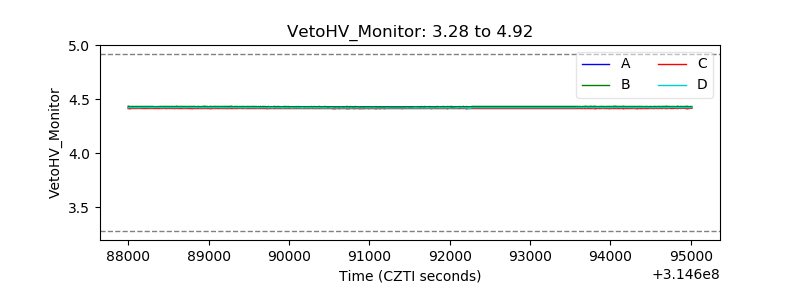 |
| Veto LLD | 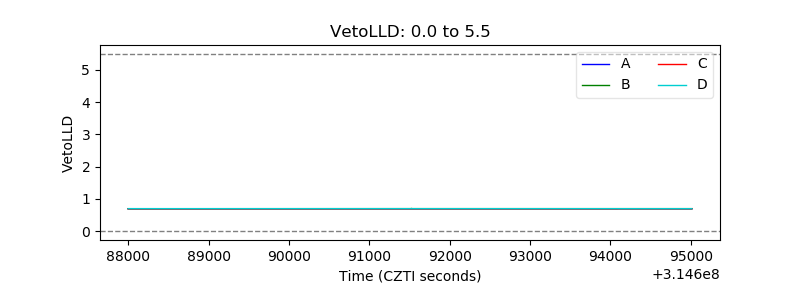 |
| Alpha Counter | 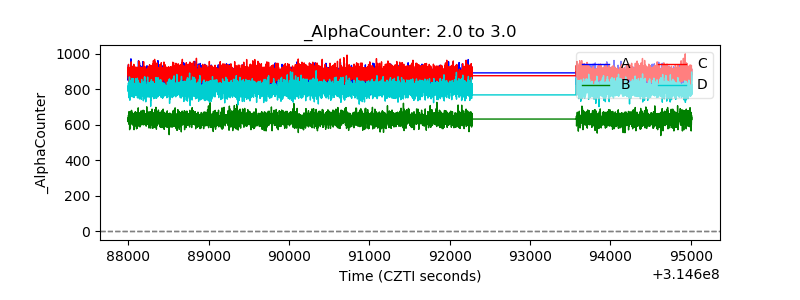 |
| _CPM_Rate | 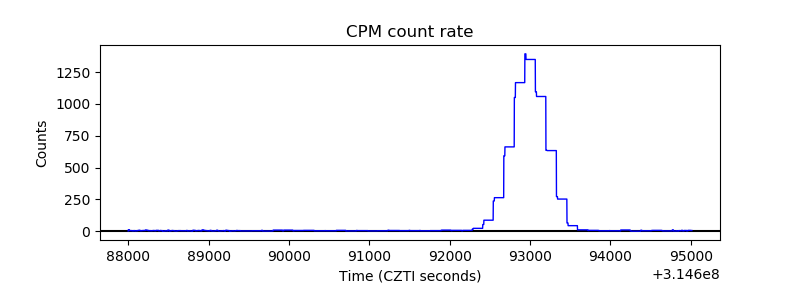 |
| CZT Counter | 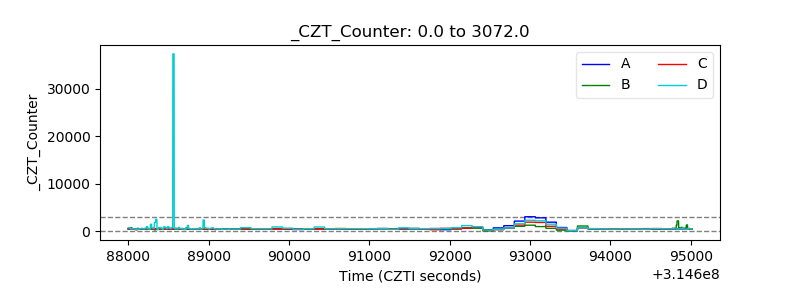 |
| +2.5 Volts monitor | 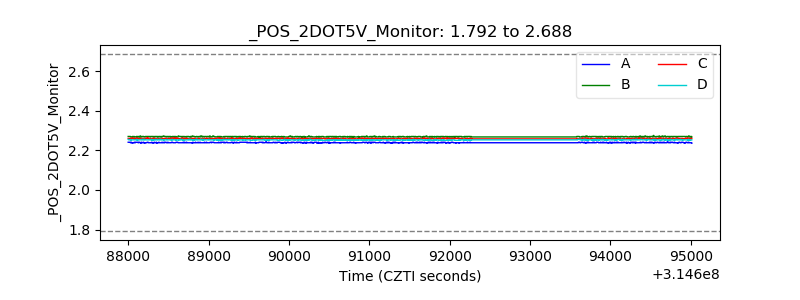 |
| +5 Volts monitor |  |
| _ROLL_ROT | 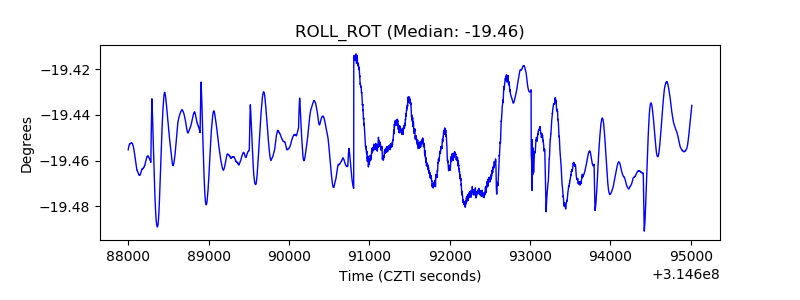 |
| _Roll_DEC | 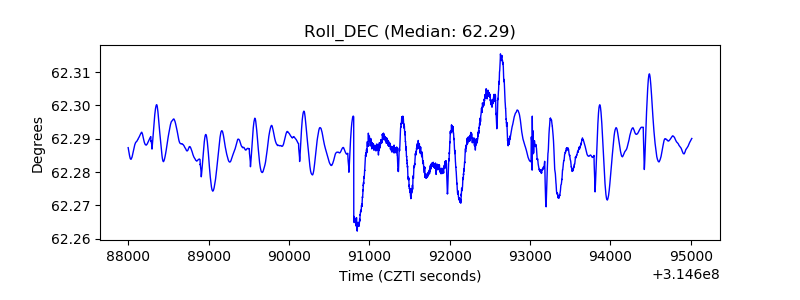 |
| _Roll_RA | 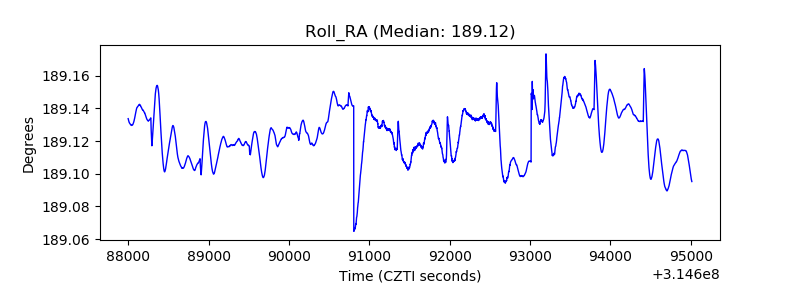 |
| Veto Counter | 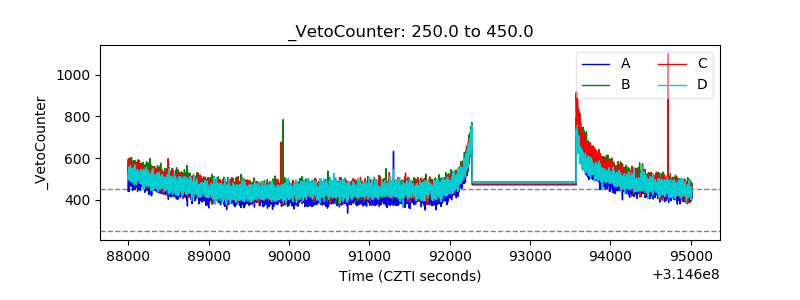 |