| Param | Original file | Final file |
|---|---|---|
| Filename | modeM0/AS1A08_009T01_9000003382_22886cztM0_level2.evt | modeM0/AS1A08_009T01_9000003382_22886cztM0_level2_quad_clean.evt |
| Size (bytes) | 432,118,080 | 96,770,880 |
| Size | 412.1 MB | 92.3 MB |
| Events in quadrant A | 2,948,433 | 642,104 |
| Events in quadrant B | 3,136,138 | 647,494 |
| Events in quadrant C | 2,901,846 | 613,877 |
| Events in quadrant D | 3,681,886 | 597,481 |
| Mode M9 | |||
|---|---|---|---|
| Quadrant | BADHDUFLAG | Total packets | Discarded packets |
| A | 0 | 12 | 0 |
| B | 0 | 12 | 0 |
| C | 0 | 12 | 0 |
| D | 0 | 12 | 0 |
| Mode M0 | |||
|---|---|---|---|
| Quadrant | BADHDUFLAG | Total packets | Discarded packets |
| A | 0 | 12568 | 1 |
| B | 0 | 13140 | 1 |
| C | 0 | 12568 | 1 |
| D | 0 | 14700 | 1 |
| Mode SS | |||
|---|---|---|---|
| Quadrant | BADHDUFLAG | Total packets | Discarded packets |
| A | 0 | 124 | 0 |
| B | 0 | 124 | 0 |
| C | 0 | 124 | 0 |
| D | 0 | 124 | 0 |
| Quadrant | Total seconds | Saturated seconds | Saturation percentage |
|---|---|---|---|
| A | 6158 | 61 | 0.990581% |
| B | 6159 | 100 | 1.623640% |
| C | 6159 | 60 | 0.974184% |
| D | 6159 | 161 | 2.614061% |
Noise dominated data is calculated using 1-second bins in cleaned event files. If a bin has >2000 counts, and if more than 50% of those come from <1% of pixels, then it is considered to be noise-dominated and hence unusable.
| Quadrant | # 1 sec bins | Bins with >0 counts | Bins with >2000 counts | High rate bins dominated by noise | Noise dominated (total time) | Noise dominated (detector-on time) | Marked lightcurve |
|---|---|---|---|---|---|---|---|
| A | 7293 | 6159 | 0 | 0 | 0.00% | 0.00% | 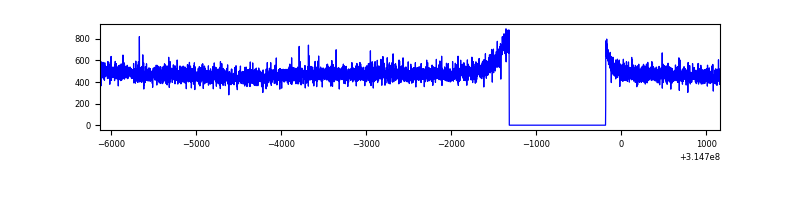 |
| B | 7294 | 6160 | 22 | 22 | 0.30% | 0.36% | 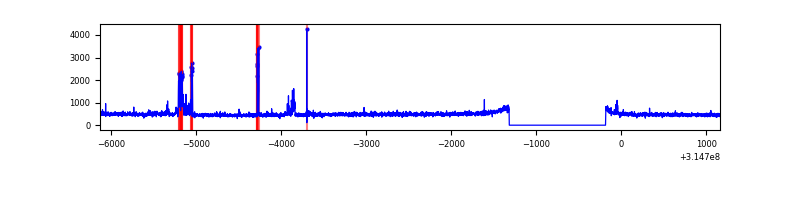 |
| C | 7294 | 6160 | 0 | 0 | 0.00% | 0.00% | 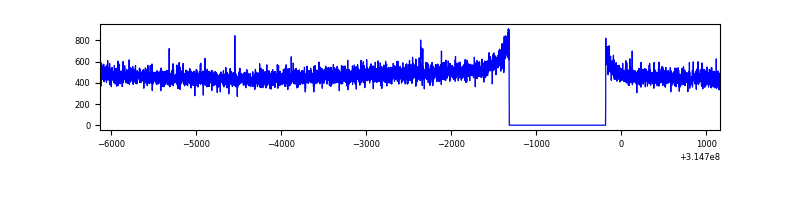 |
| D | 7294 | 6160 | 97 | 97 | 1.33% | 1.57% | 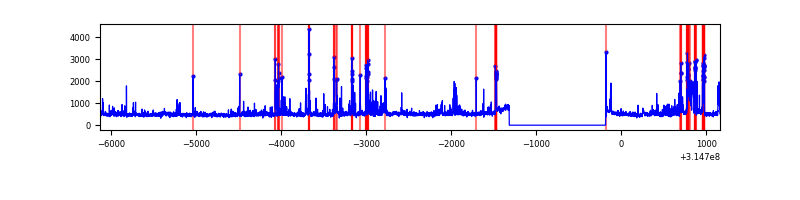 |
Top three noisy pixels from each quadrant. If the there are fewer than three noisy pixels in the level2.evt file, extra rows are filled as -1
| Pixel properties | Quadrant properties | ||||||
|---|---|---|---|---|---|---|---|
| Quadrant | DetID | PixID | Counts | Sigma | Mean | Median | Sigma |
| A | 13 | 254 | 9634 | 58.37 | 763 | 746 | 152.3 |
| A | 0 | 226 | 6689 | 39.03 | 763 | 746 | 152.3 |
| A | 3 | 137 | 6187 | 35.73 | 763 | 746 | 152.3 |
| B | 3 | 64 | 127753 | 900.16 | 750 | 731 | 141.1 |
| B | 0 | 190 | 30175 | 208.66 | 750 | 731 | 141.1 |
| B | 0 | 228 | 26442 | 182.21 | 750 | 731 | 141.1 |
| C | 14 | 238 | 116033 | 703.86 | 714 | 717 | 163.8 |
| C | 13 | 61 | 5016 | 26.24 | 714 | 717 | 163.8 |
| C | 2 | 16 | 2659 | 11.85 | 714 | 717 | 163.8 |
| D | 1 | 52 | 334506 | 1894.96 | 727 | 705 | 176.2 |
| D | 7 | 238 | 237624 | 1344.97 | 727 | 705 | 176.2 |
| D | 12 | 233 | 158521 | 895.91 | 727 | 705 | 176.2 |
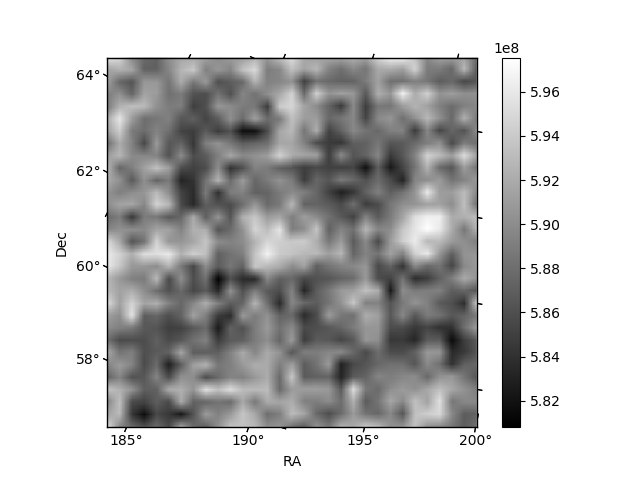
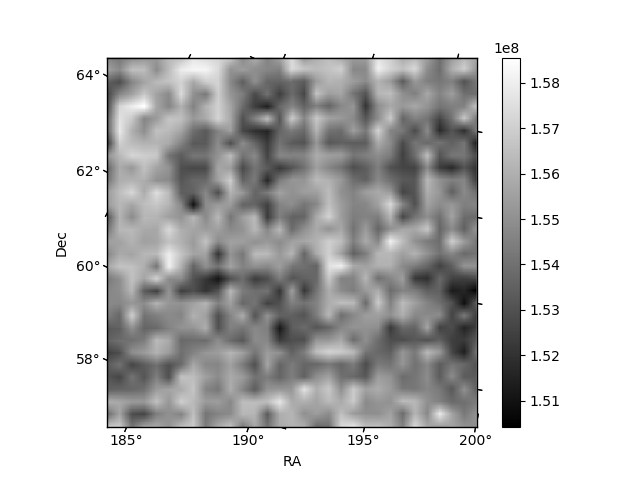
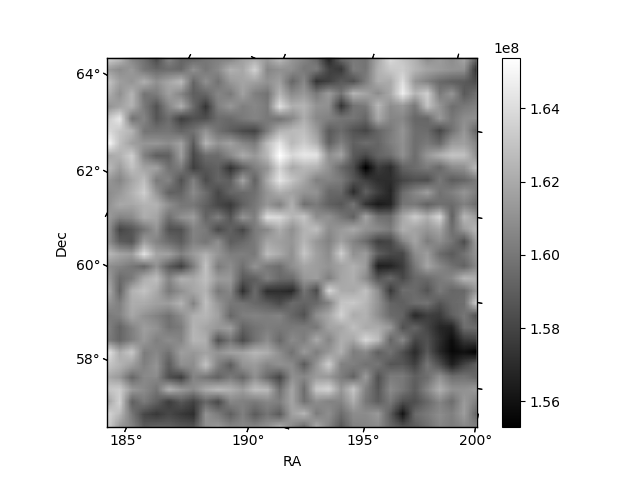
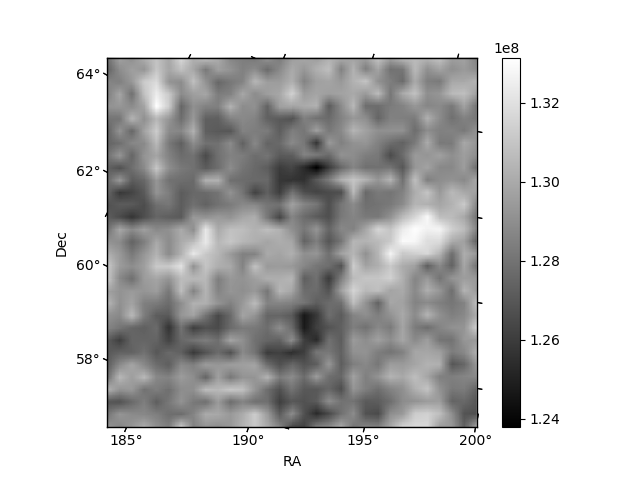
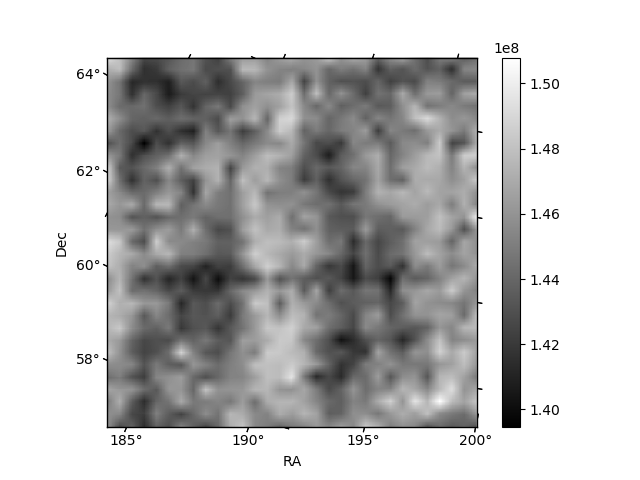
Histogram calculated using DETX and DETY for each event in the final _common_clean file
| Quadrant A | 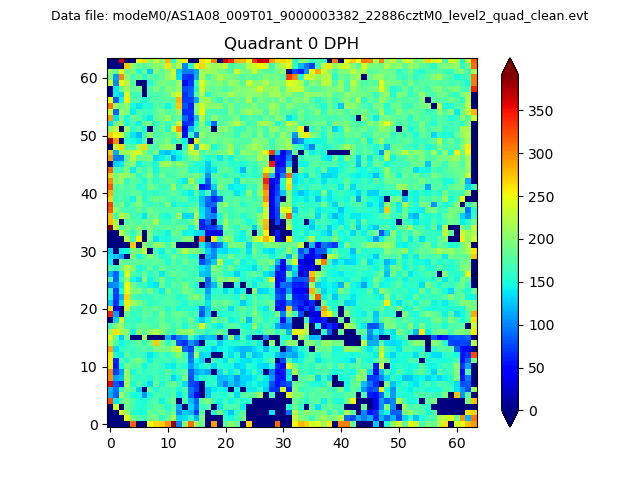 |
 |
Quadrant B |
|---|---|---|---|
| Quadrant D | 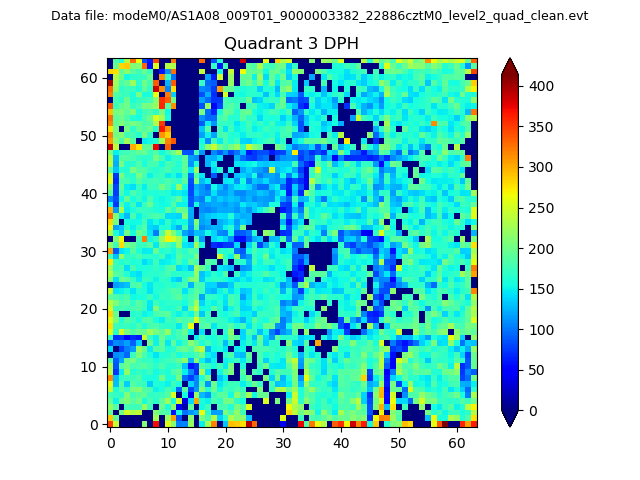 |
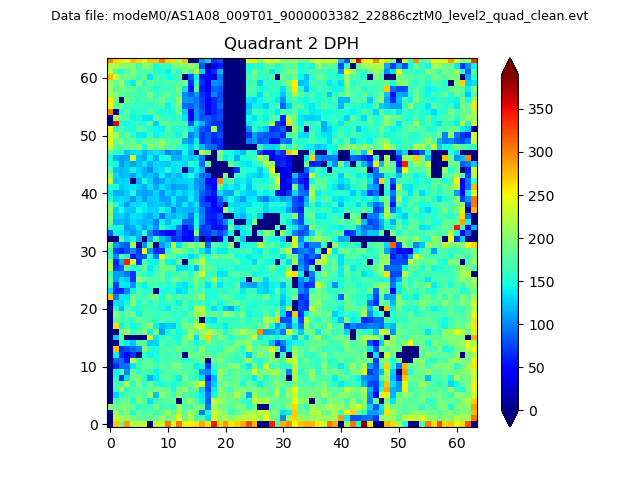 |
Quadrant C |
| Plot type | Count rate plots | Images |
|---|---|---|
| Comparison with Poisson distribution Blue bars denote a histogram of data divided into 1 sec bins. Red curve is a Poisson curve with rate = median count rate of data. |
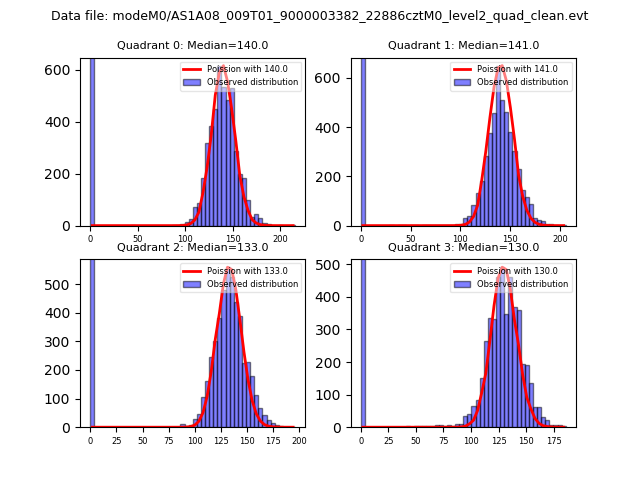 |
 |
| Quadrant-wise count rates Data is divided into 100 sec bins |
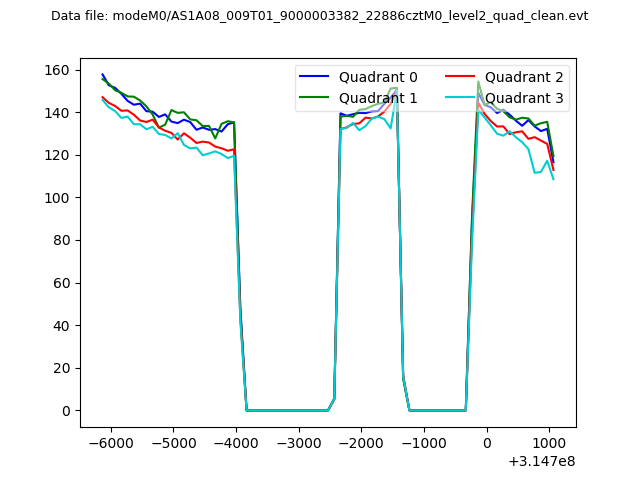 |
|
| Module-wise count rates for Quadrant A Data is divided into 100 sec bins |
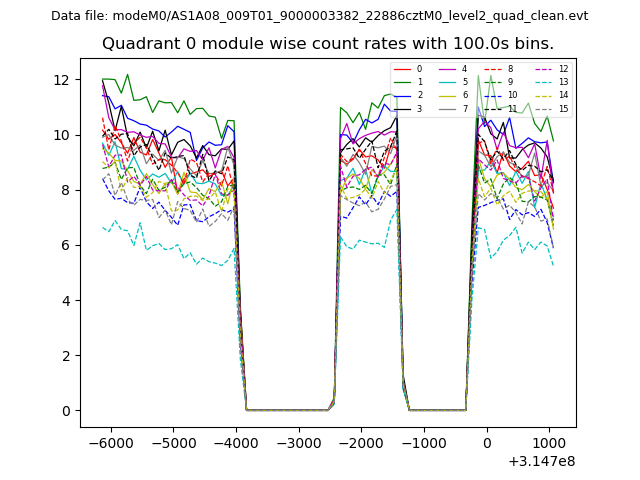 |
 |
| Module-wise count rates for Quadrant B Data is divided into 100 sec bins |
 |
 |
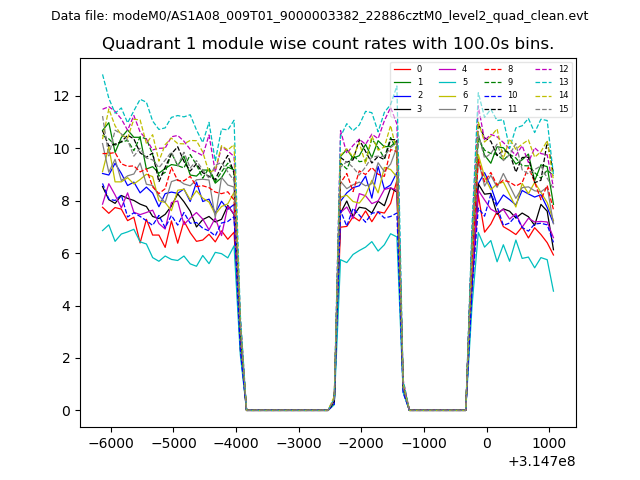
| Module-wise count rates for Quadrant C Data is divided into 100 sec bins |
 |
 |
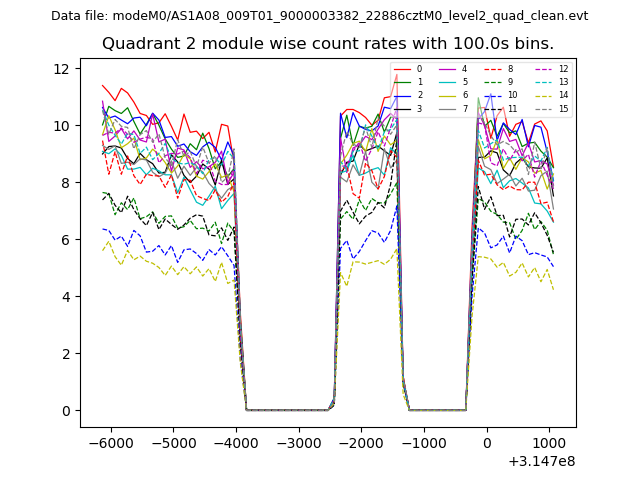
| Module-wise count rates for Quadrant D Data is divided into 100 sec bins |
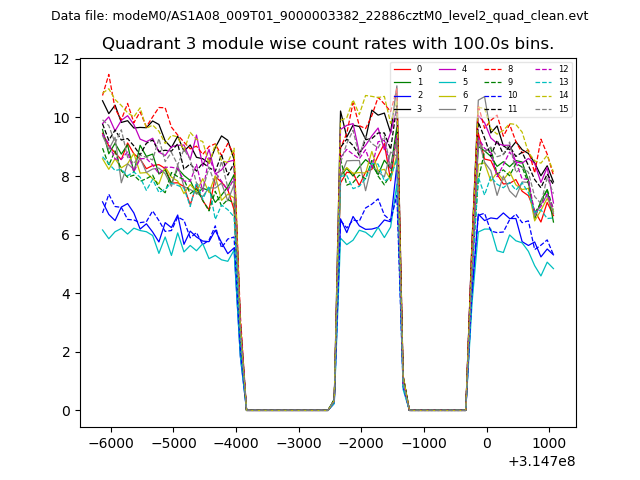 |
 |
| Parameter | Plot |
|---|---|
| CZT HV Monitor | 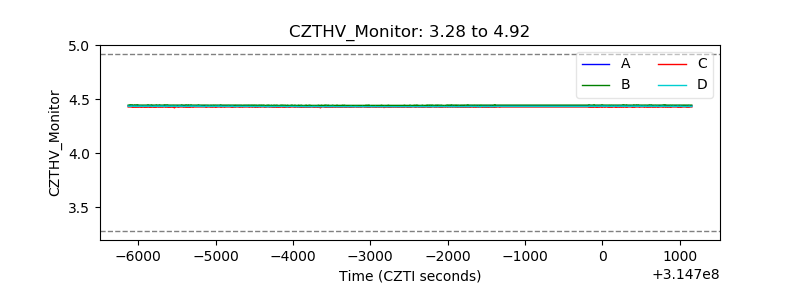 |
| D_VDD | 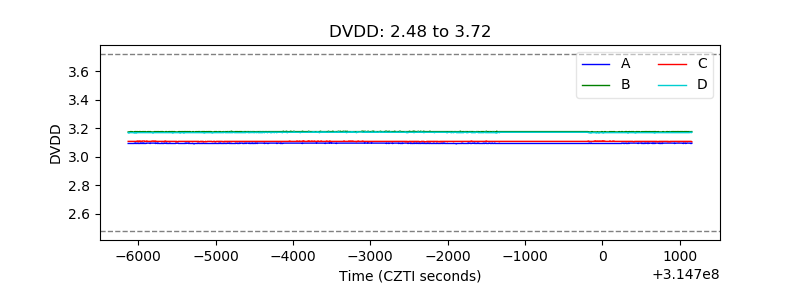 |
| Temperature 1 | 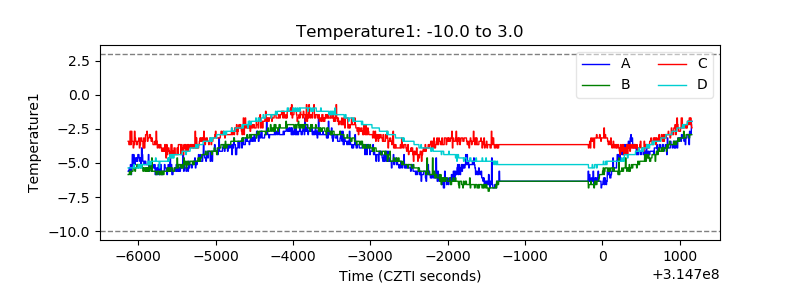 |
| Veto HV Monitor |  |
| Veto LLD | 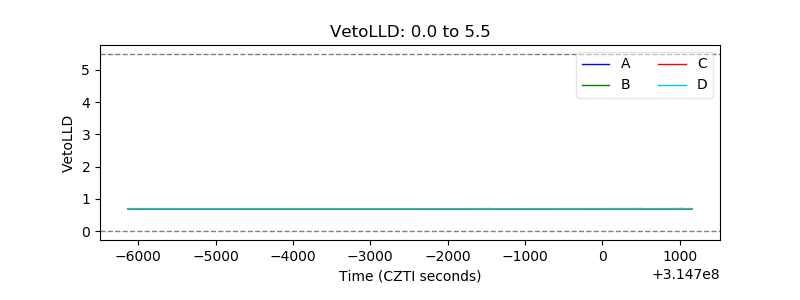 |
| Alpha Counter | 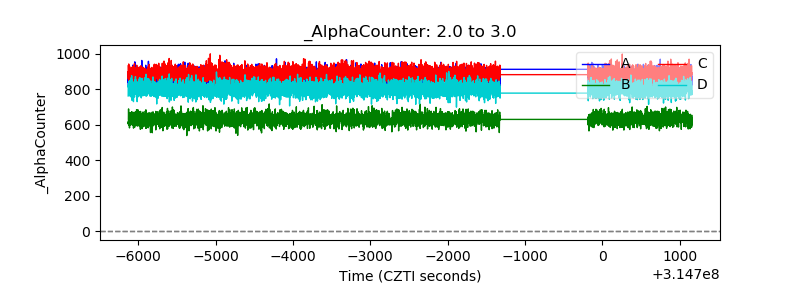 |
| _CPM_Rate |  |
| CZT Counter | 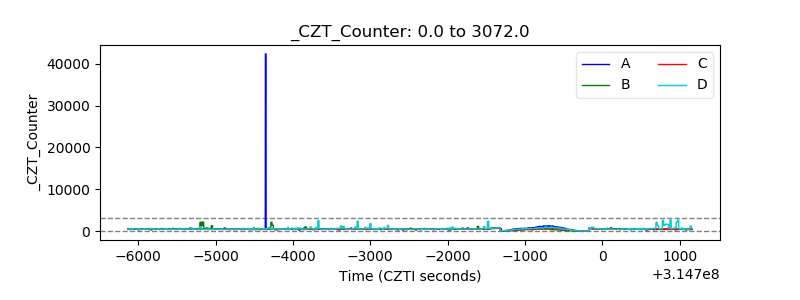 |
| +2.5 Volts monitor | 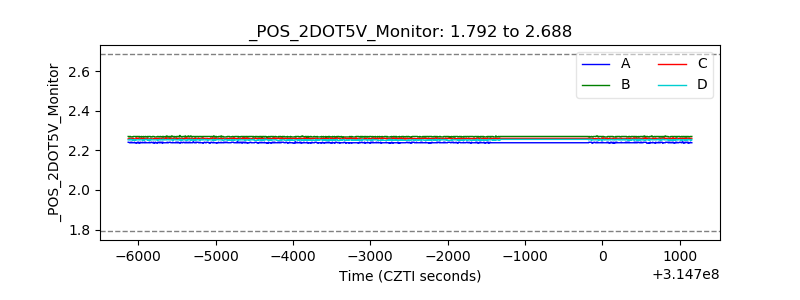 |
| +5 Volts monitor | 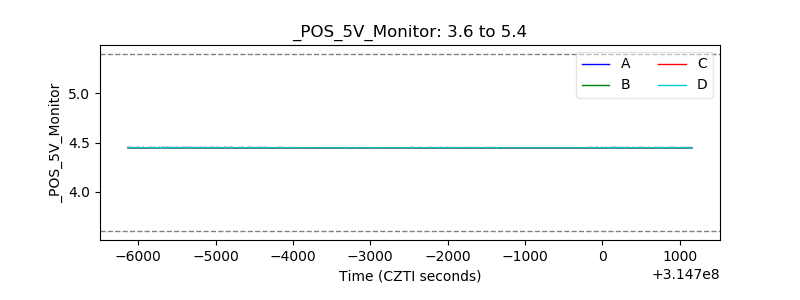 |
| _ROLL_ROT | 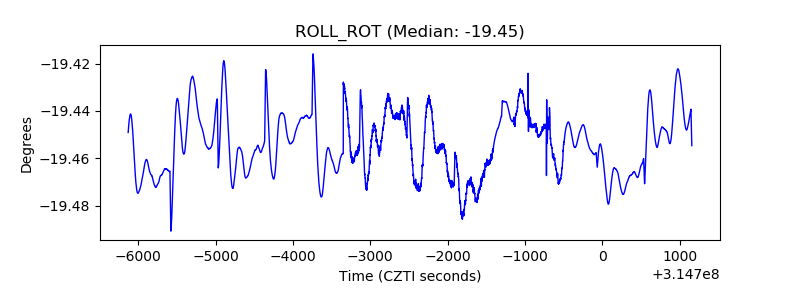 |
| _Roll_DEC |  |
| _Roll_RA | 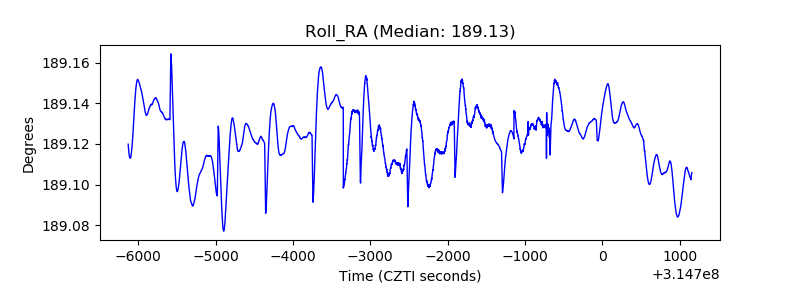 |
| Veto Counter | 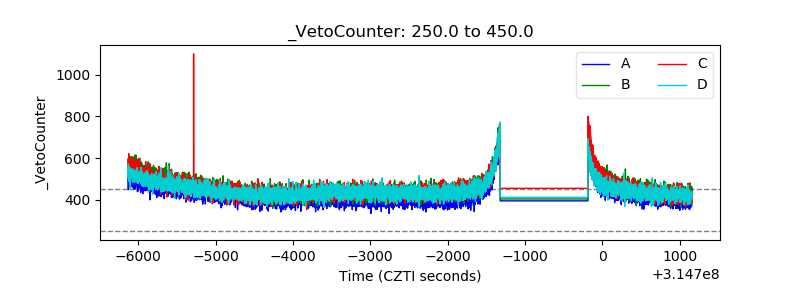 |