| Param | Original file | Final file |
|---|---|---|
| Filename | modeM0/AS1A08_009T01_9000003382_22889cztM0_level2.evt | modeM0/AS1A08_009T01_9000003382_22889cztM0_level2_quad_clean.evt |
| Size (bytes) | 490,371,840 | 94,446,720 |
| Size | 467.7 MB | 90.1 MB |
| Events in quadrant A | 3,196,026 | 607,209 |
| Events in quadrant B | 3,426,141 | 615,727 |
| Events in quadrant C | 3,174,806 | 585,090 |
| Events in quadrant D | 4,580,634 | 566,555 |
| Mode M9 | |||
|---|---|---|---|
| Quadrant | BADHDUFLAG | Total packets | Discarded packets |
| A | 0 | 3 | 0 |
| B | 0 | 3 | 0 |
| C | 0 | 3 | 0 |
| D | 0 | 3 | 0 |
| Mode M0 | |||
|---|---|---|---|
| Quadrant | BADHDUFLAG | Total packets | Discarded packets |
| A | 0 | 14148 | 1 |
| B | 0 | 14702 | 1 |
| C | 0 | 14104 | 1 |
| D | 0 | 18237 | 1 |
| Mode SS | |||
|---|---|---|---|
| Quadrant | BADHDUFLAG | Total packets | Discarded packets |
| A | 0 | 142 | 0 |
| B | 0 | 142 | 0 |
| C | 0 | 142 | 0 |
| D | 0 | 142 | 0 |
| Quadrant | Total seconds | Saturated seconds | Saturation percentage |
|---|---|---|---|
| A | 6967 | 37 | 0.531075% |
| B | 6968 | 62 | 0.889782% |
| C | 6968 | 68 | 0.975890% |
| D | 6968 | 276 | 3.960964% |
Noise dominated data is calculated using 1-second bins in cleaned event files. If a bin has >2000 counts, and if more than 50% of those come from <1% of pixels, then it is considered to be noise-dominated and hence unusable.
| Quadrant | # 1 sec bins | Bins with >0 counts | Bins with >2000 counts | High rate bins dominated by noise | Noise dominated (total time) | Noise dominated (detector-on time) | Marked lightcurve |
|---|---|---|---|---|---|---|---|
| A | 7302 | 6968 | 0 | 0 | 0.00% | 0.00% | 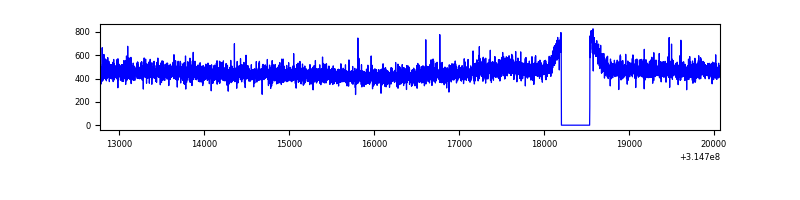 |
| B | 7303 | 6969 | 0 | 0 | 0.00% | 0.00% | 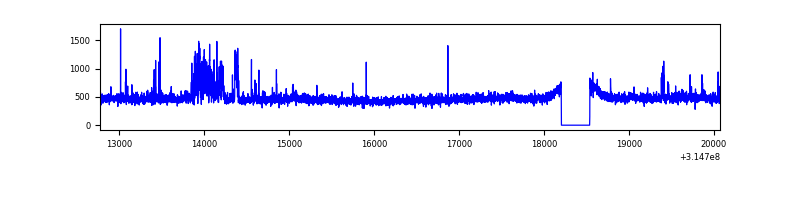 |
| C | 7303 | 6969 | 0 | 0 | 0.00% | 0.00% | 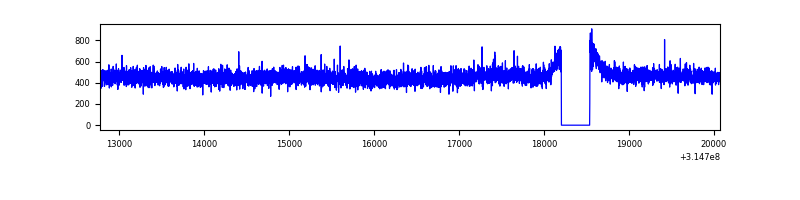 |
| D | 7303 | 6969 | 183 | 183 | 2.51% | 2.63% |  |
Top three noisy pixels from each quadrant. If the there are fewer than three noisy pixels in the level2.evt file, extra rows are filled as -1
| Pixel properties | Quadrant properties | ||||||
|---|---|---|---|---|---|---|---|
| Quadrant | DetID | PixID | Counts | Sigma | Mean | Median | Sigma |
| A | 13 | 254 | 11780 | 66.38 | 825 | 806 | 165.3 |
| A | 13 | 252 | 8408 | 45.98 | 825 | 806 | 165.3 |
| A | 0 | 226 | 7229 | 38.85 | 825 | 806 | 165.3 |
| B | 0 | 190 | 162116 | 1026.32 | 818 | 797 | 157.2 |
| B | 0 | 229 | 25322 | 156.03 | 818 | 797 | 157.2 |
| B | 12 | 111 | 18849 | 114.85 | 818 | 797 | 157.2 |
| C | 14 | 238 | 124776 | 680.4 | 781 | 783 | 182.2 |
| C | 13 | 61 | 5485 | 25.8 | 781 | 783 | 182.2 |
| C | 7 | 247 | 4249 | 19.02 | 781 | 783 | 182.2 |
| D | 1 | 52 | 561830 | 2948.25 | 783 | 758 | 190.3 |
| D | 7 | 238 | 363227 | 1904.66 | 783 | 758 | 190.3 |
| D | 12 | 227 | 219354 | 1148.65 | 783 | 758 | 190.3 |
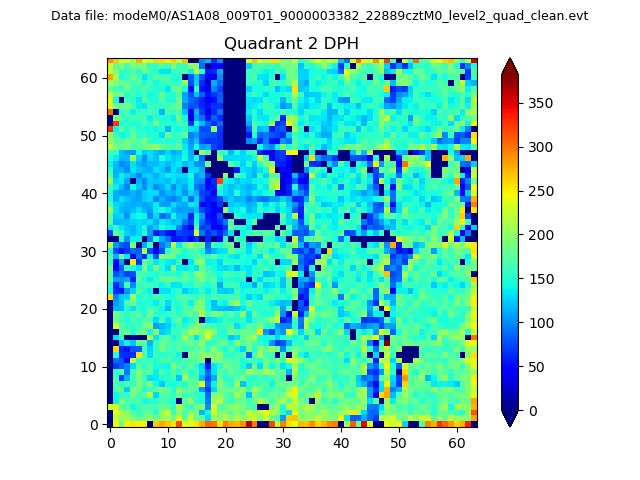
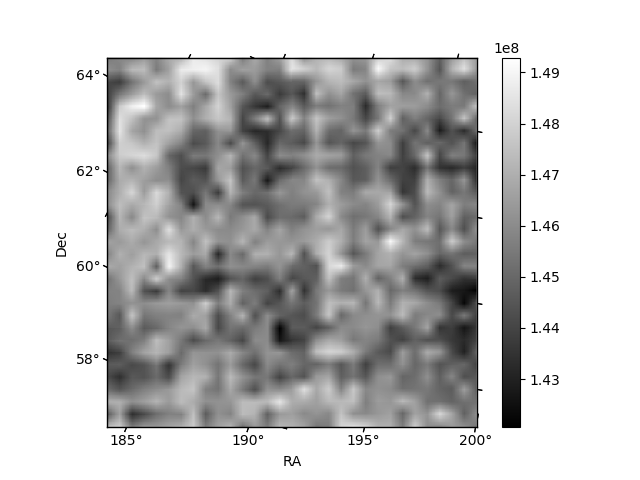
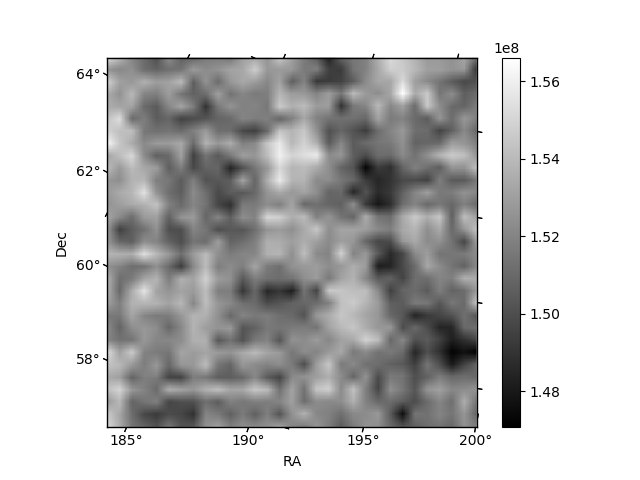
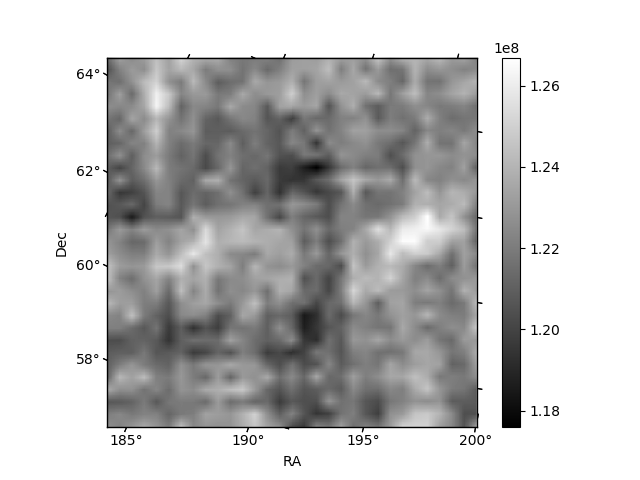
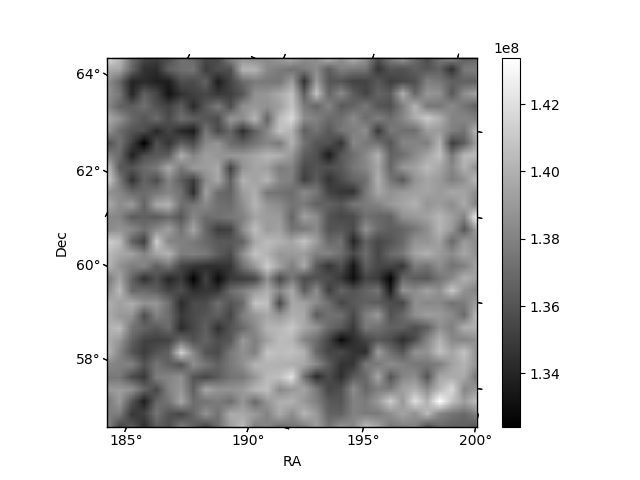
Histogram calculated using DETX and DETY for each event in the final _common_clean file
| Quadrant A | 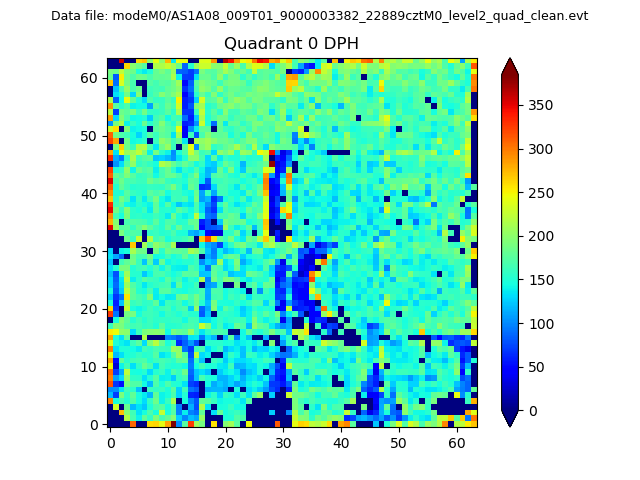 |
 |
Quadrant B |
|---|---|---|---|
| Quadrant D | 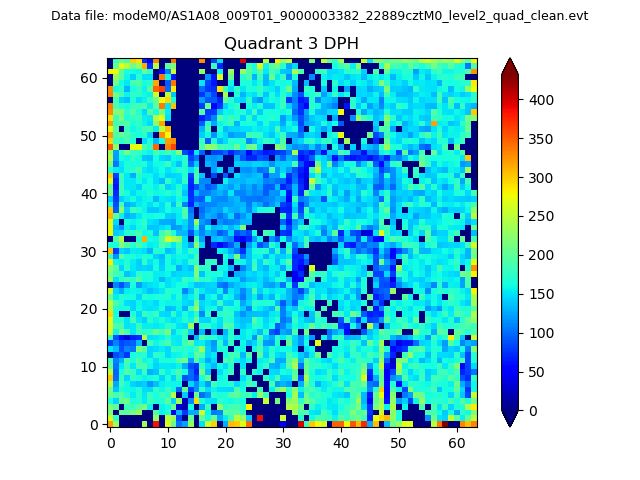 |
 |
Quadrant C |
| Plot type | Count rate plots | Images |
|---|---|---|
| Comparison with Poisson distribution Blue bars denote a histogram of data divided into 1 sec bins. Red curve is a Poisson curve with rate = median count rate of data. |
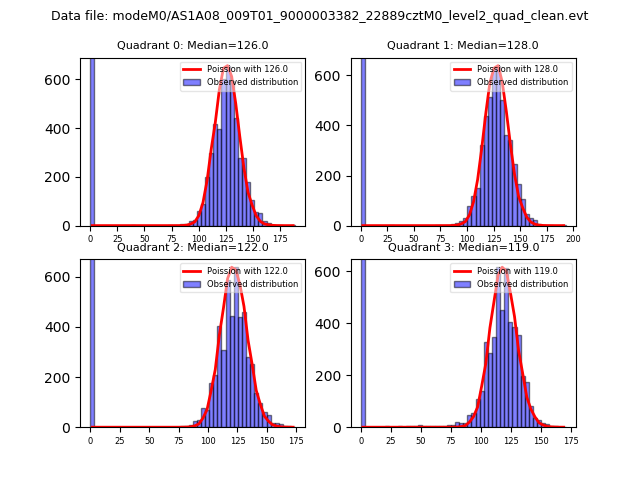 |
 |
| Quadrant-wise count rates Data is divided into 100 sec bins |
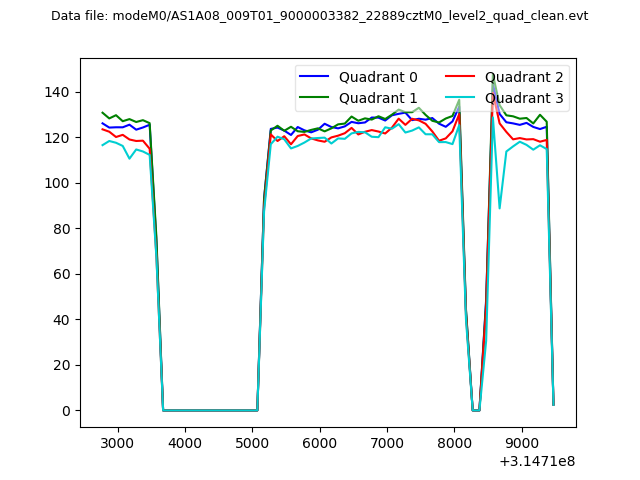 |
|
| Module-wise count rates for Quadrant A Data is divided into 100 sec bins |
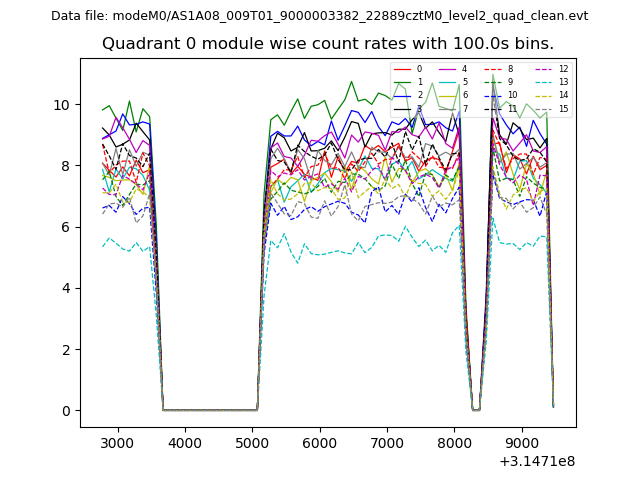 |
 |
| Module-wise count rates for Quadrant B Data is divided into 100 sec bins |
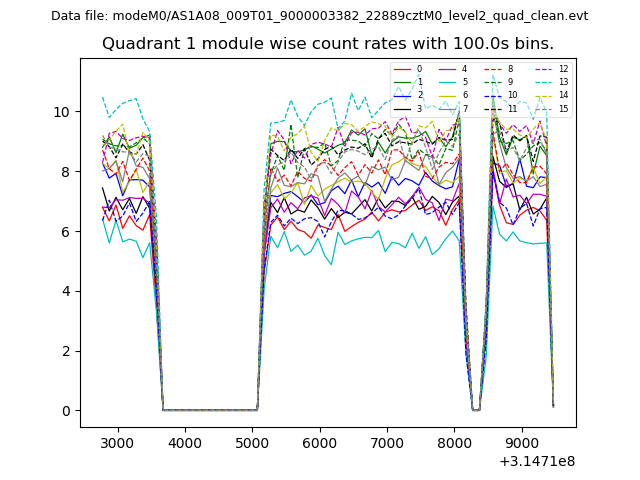 |
 |
| Module-wise count rates for Quadrant C Data is divided into 100 sec bins |
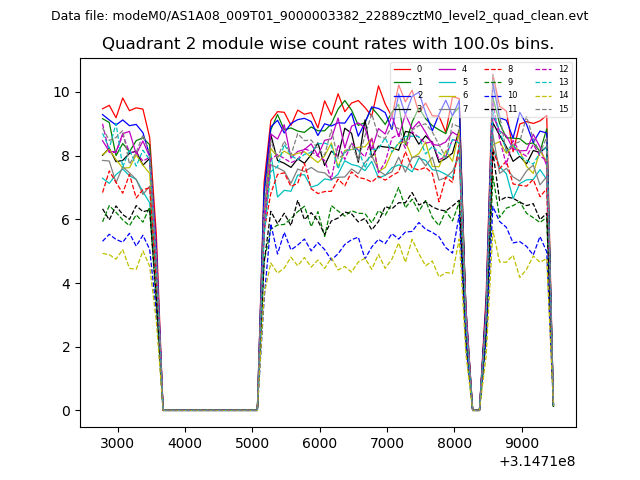 |
 |
| Module-wise count rates for Quadrant D Data is divided into 100 sec bins |
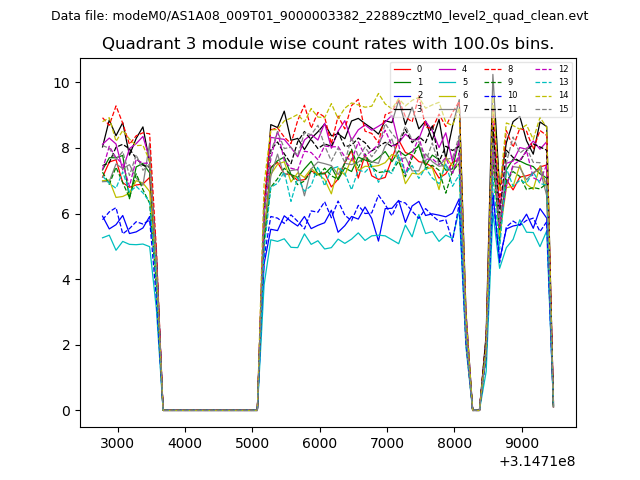 |
 |
| Parameter | Plot |
|---|---|
| CZT HV Monitor | 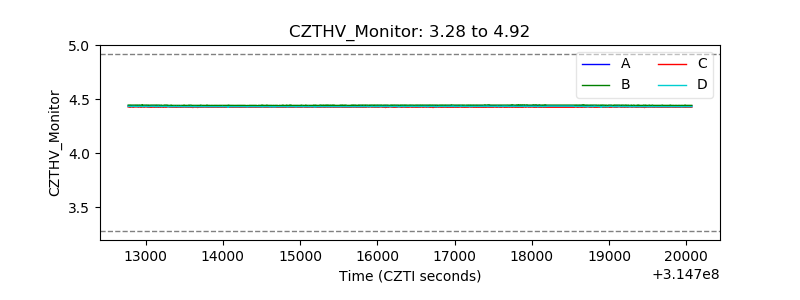 |
| D_VDD | 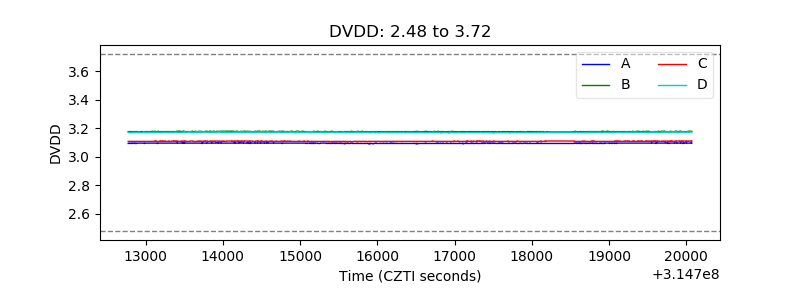 |
| Temperature 1 | 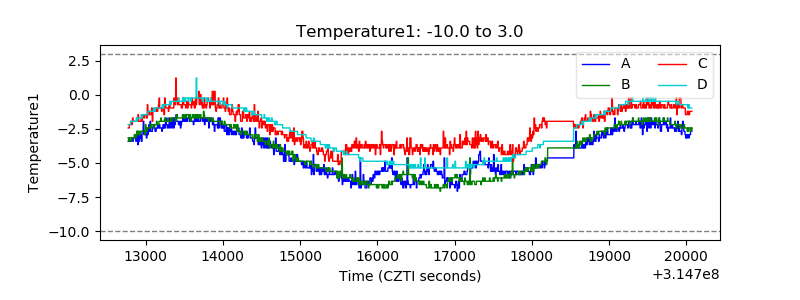 |
| Veto HV Monitor | 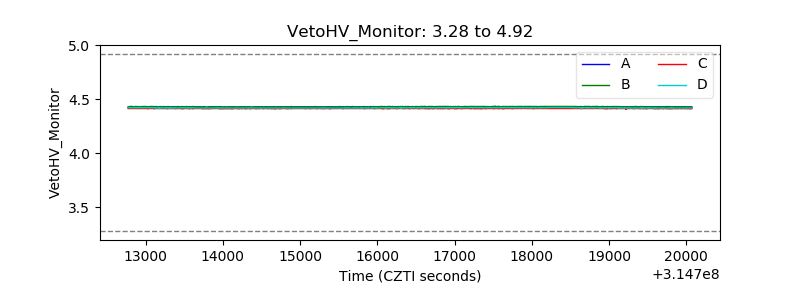 |
| Veto LLD | 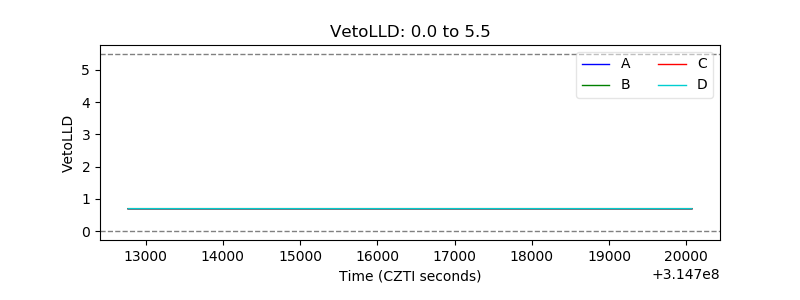 |
| Alpha Counter | 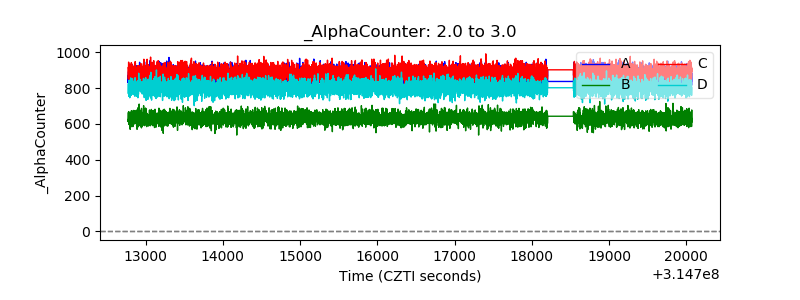 |
| _CPM_Rate | 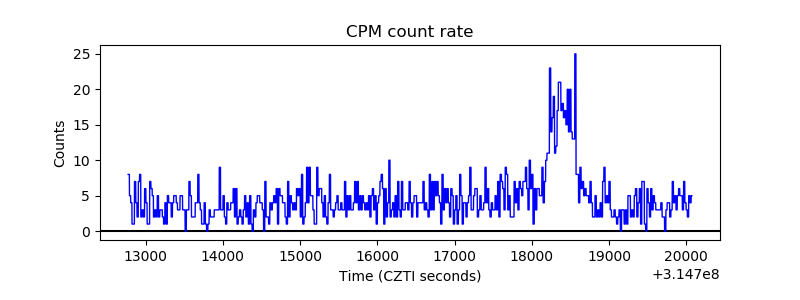 |
| CZT Counter | 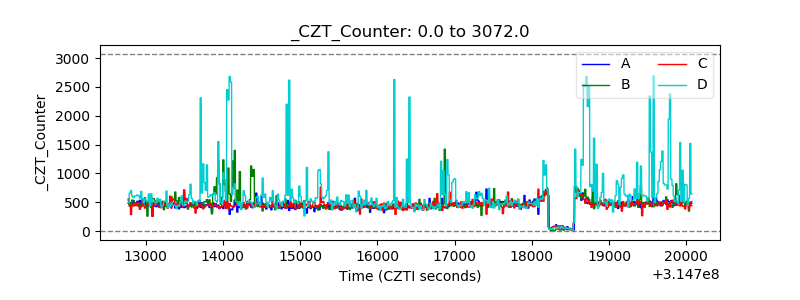 |
| +2.5 Volts monitor |  |
| +5 Volts monitor |  |
| _ROLL_ROT | 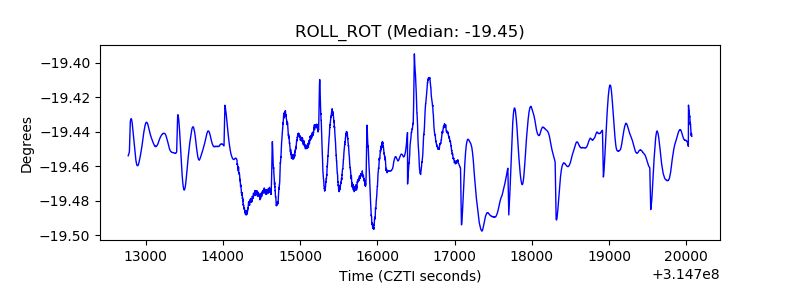 |
| _Roll_DEC | 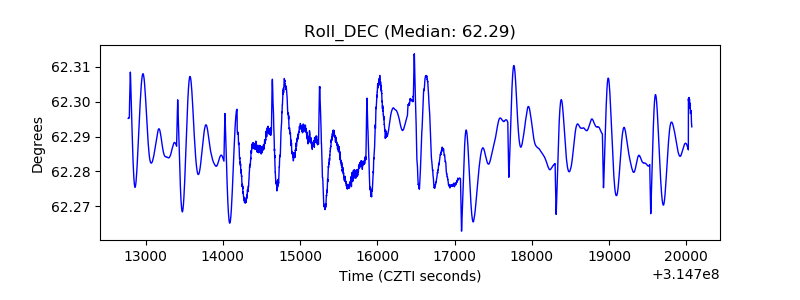 |
| _Roll_RA | 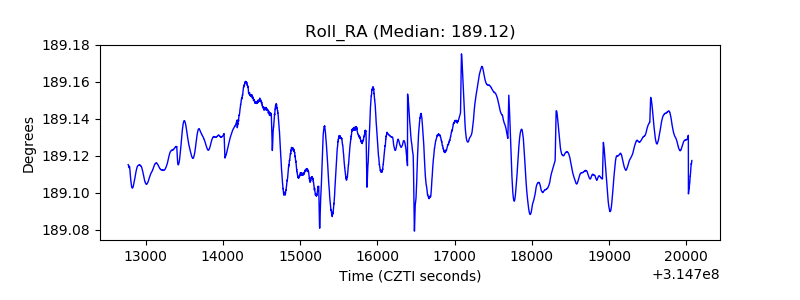 |
| Veto Counter | 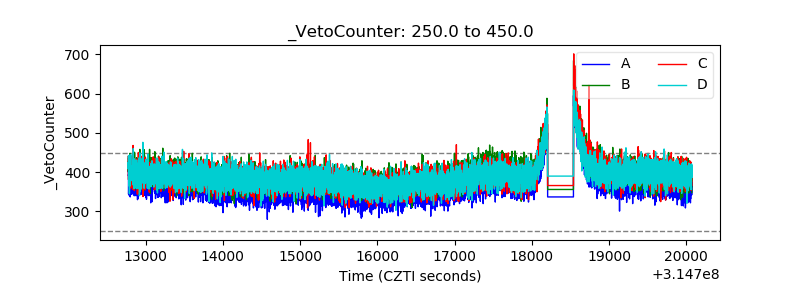 |