| Param | Original file | Final file |
|---|---|---|
| Filename | modeM0/AS1A08_009T01_9000003382_22890cztM0_level2.evt | modeM0/AS1A08_009T01_9000003382_22890cztM0_level2_quad_clean.evt |
| Size (bytes) | 508,800,960 | 90,397,440 |
| Size | 485.2 MB | 86.2 MB |
| Events in quadrant A | 3,312,633 | 571,498 |
| Events in quadrant B | 3,443,396 | 576,490 |
| Events in quadrant C | 3,310,719 | 551,299 |
| Events in quadrant D | 4,855,201 | 538,588 |
| Mode M9 | |||
|---|---|---|---|
| Quadrant | BADHDUFLAG | Total packets | Discarded packets |
| A | 0 | 4 | 0 |
| B | 0 | 4 | 0 |
| C | 0 | 4 | 0 |
| D | 0 | 4 | 0 |
| Mode M0 | |||
|---|---|---|---|
| Quadrant | BADHDUFLAG | Total packets | Discarded packets |
| A | 0 | 14588 | 1 |
| B | 0 | 14829 | 1 |
| C | 0 | 14606 | 1 |
| D | 0 | 19181 | 1 |
| Mode SS | |||
|---|---|---|---|
| Quadrant | BADHDUFLAG | Total packets | Discarded packets |
| A | 0 | 144 | 0 |
| B | 0 | 144 | 0 |
| C | 0 | 144 | 0 |
| D | 0 | 144 | 0 |
| Quadrant | Total seconds | Saturated seconds | Saturation percentage |
|---|---|---|---|
| A | 7182 | 61 | 0.849346% |
| B | 7182 | 84 | 1.169591% |
| C | 7182 | 102 | 1.420217% |
| D | 7183 | 187 | 2.603369% |
Noise dominated data is calculated using 1-second bins in cleaned event files. If a bin has >2000 counts, and if more than 50% of those come from <1% of pixels, then it is considered to be noise-dominated and hence unusable.
| Quadrant | # 1 sec bins | Bins with >0 counts | Bins with >2000 counts | High rate bins dominated by noise | Noise dominated (total time) | Noise dominated (detector-on time) | Marked lightcurve |
|---|---|---|---|---|---|---|---|
| A | 7567 | 7183 | 1 | 1 | 0.01% | 0.01% | 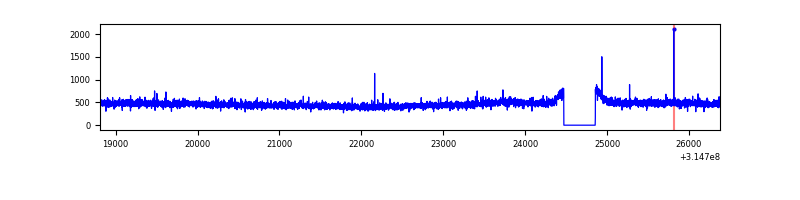 |
| B | 7567 | 7183 | 0 | 0 | 0.00% | 0.00% | 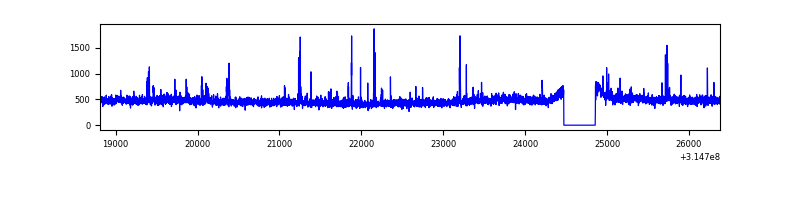 |
| C | 7567 | 7183 | 0 | 0 | 0.00% | 0.00% | 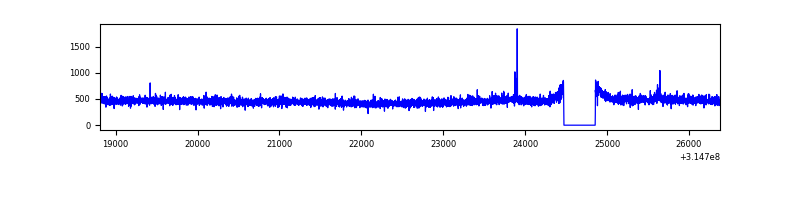 |
| D | 7568 | 7184 | 122 | 122 | 1.61% | 1.70% | 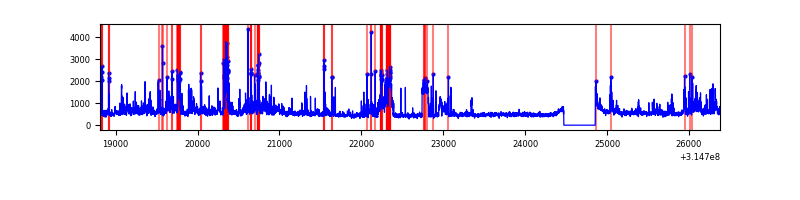 |
Top three noisy pixels from each quadrant. If the there are fewer than three noisy pixels in the level2.evt file, extra rows are filled as -1
| Pixel properties | Quadrant properties | ||||||
|---|---|---|---|---|---|---|---|
| Quadrant | DetID | PixID | Counts | Sigma | Mean | Median | Sigma |
| A | 13 | 254 | 12288 | 66.59 | 856 | 834 | 172.0 |
| A | 3 | 137 | 7578 | 39.21 | 856 | 834 | 172.0 |
| A | 0 | 226 | 7455 | 38.49 | 856 | 834 | 172.0 |
| B | 3 | 64 | 29796 | 179.26 | 847 | 828 | 161.6 |
| B | 0 | 190 | 22999 | 137.2 | 847 | 828 | 161.6 |
| B | 12 | 111 | 19744 | 117.06 | 847 | 828 | 161.6 |
| C | 14 | 238 | 128535 | 665.3 | 811 | 813 | 192.0 |
| C | 7 | 247 | 16948 | 84.05 | 811 | 813 | 192.0 |
| C | 13 | 61 | 5616 | 25.02 | 811 | 813 | 192.0 |
| D | 7 | 238 | 822967 | 4084.05 | 823 | 798 | 201.3 |
| D | 12 | 233 | 307299 | 1522.51 | 823 | 798 | 201.3 |
| D | 1 | 52 | 176376 | 872.17 | 823 | 798 | 201.3 |
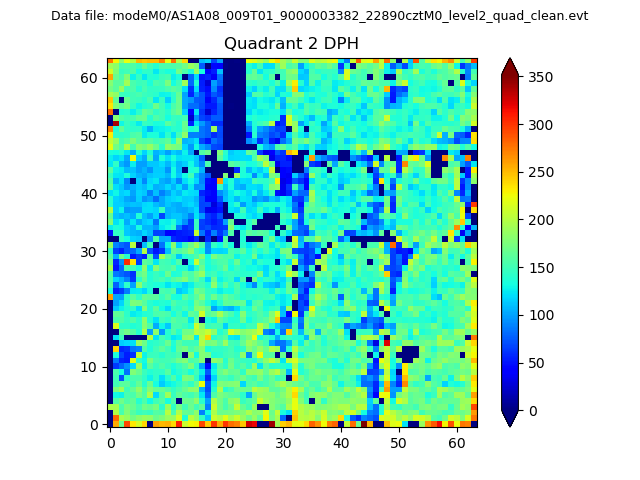
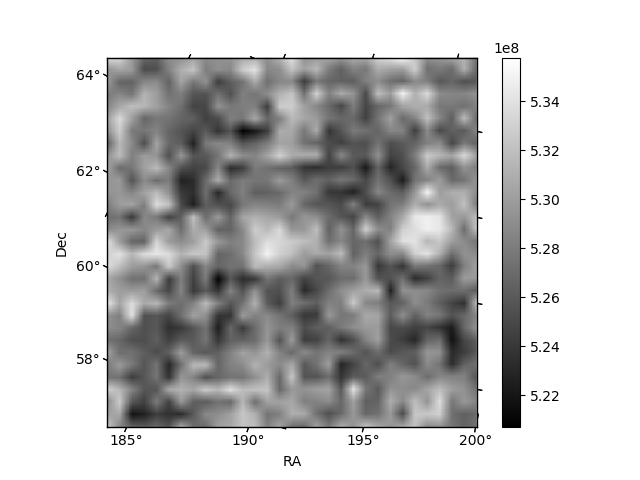
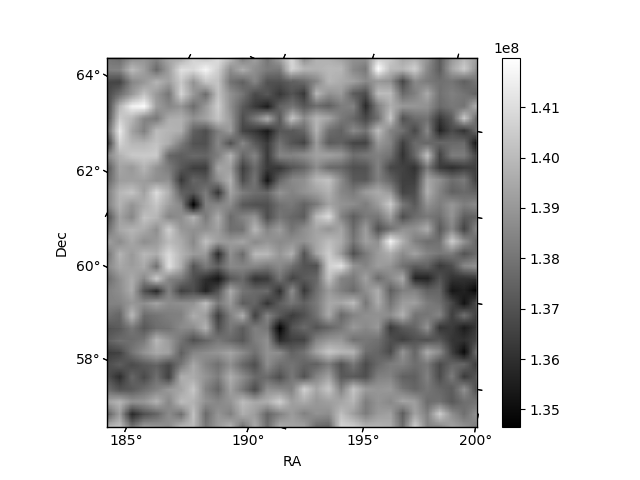
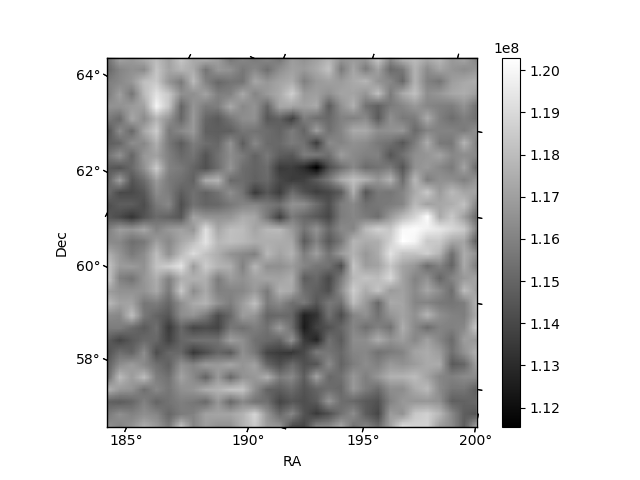
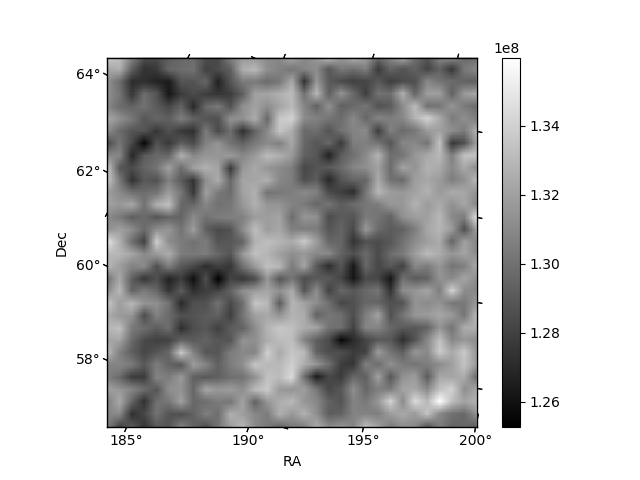
Histogram calculated using DETX and DETY for each event in the final _common_clean file
| Quadrant A | 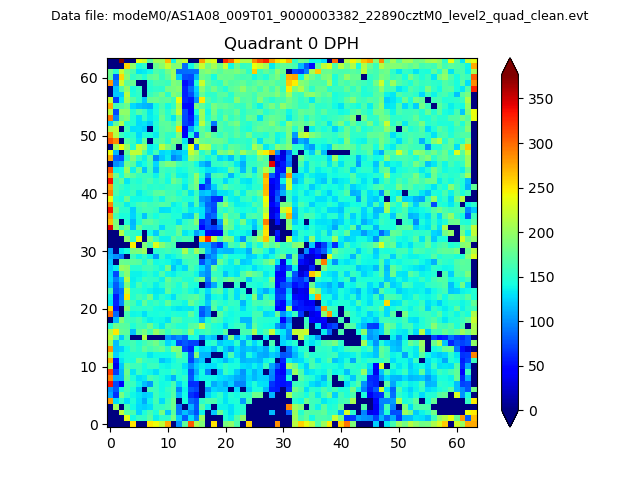 |
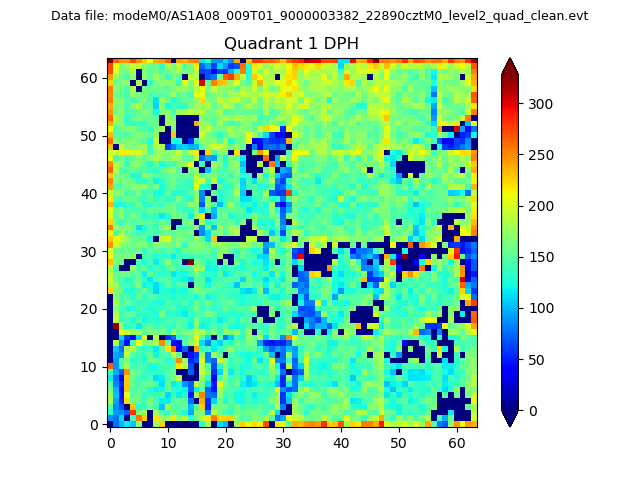 |
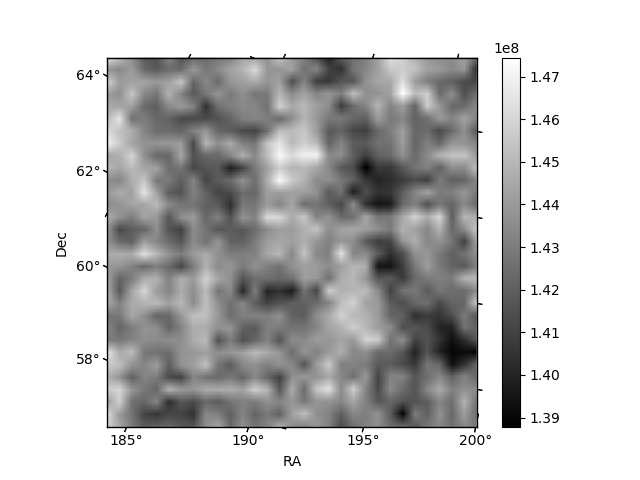
Quadrant B |
|---|---|---|---|
| Quadrant D | 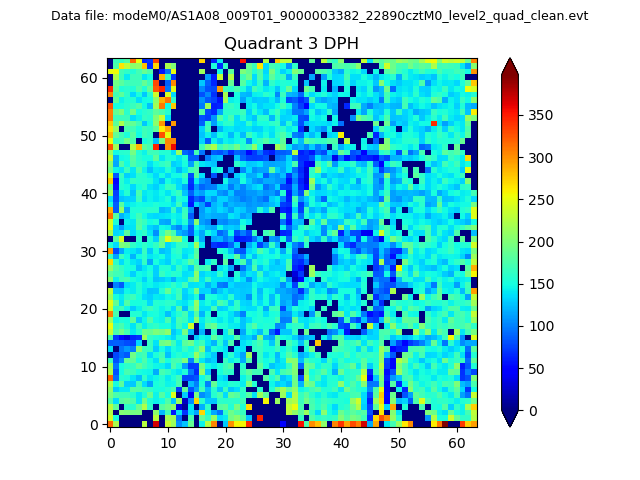 |
 |
Quadrant C |
| Plot type | Count rate plots | Images |
|---|---|---|
| Comparison with Poisson distribution Blue bars denote a histogram of data divided into 1 sec bins. Red curve is a Poisson curve with rate = median count rate of data. |
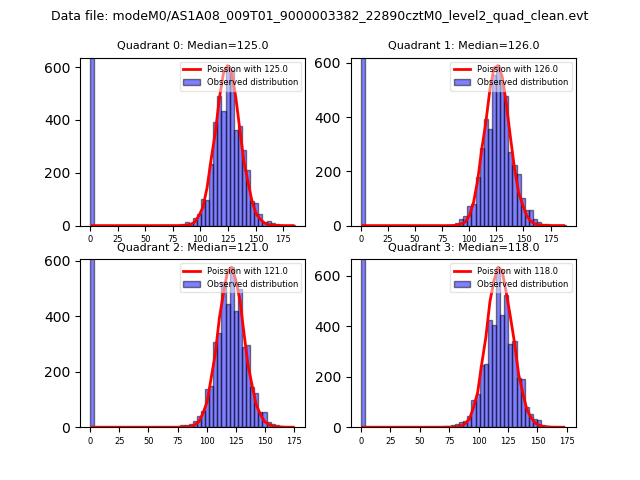 |
 |
| Quadrant-wise count rates Data is divided into 100 sec bins |
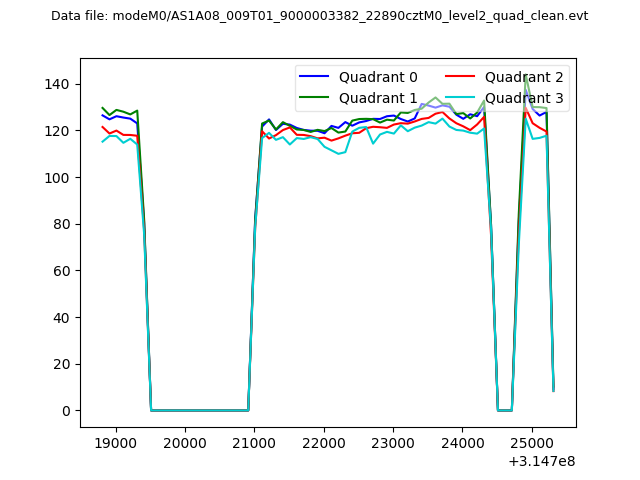 |
|
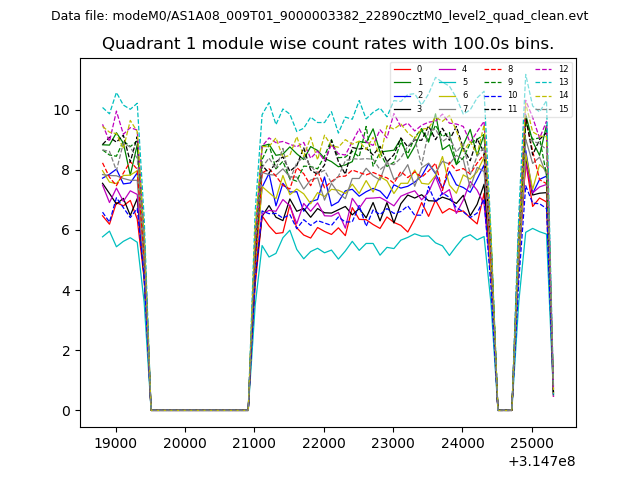
| Module-wise count rates for Quadrant A Data is divided into 100 sec bins |
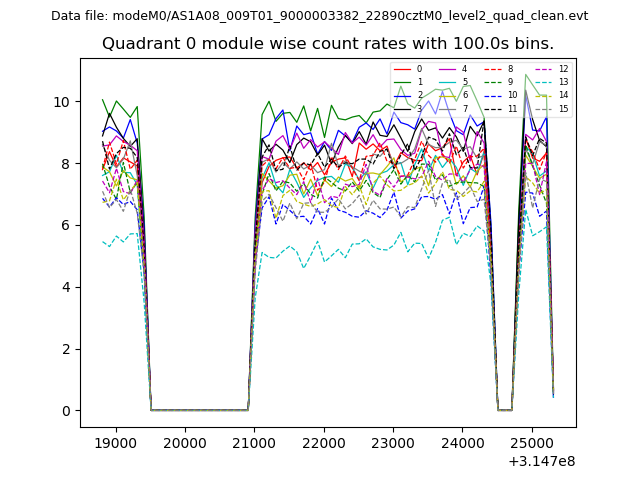 |
 |
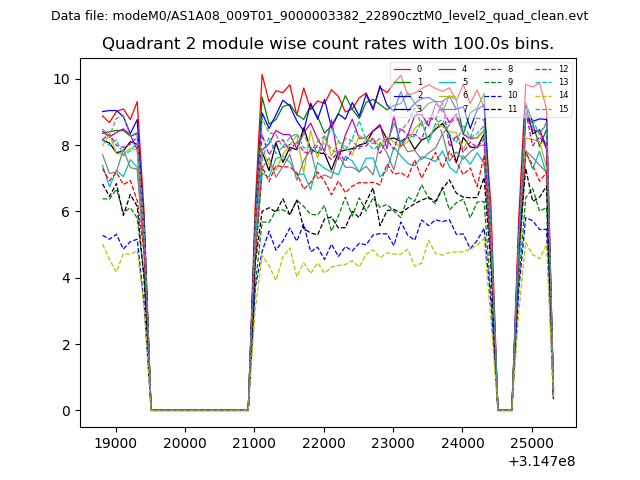
| Module-wise count rates for Quadrant B Data is divided into 100 sec bins |
 |
 |
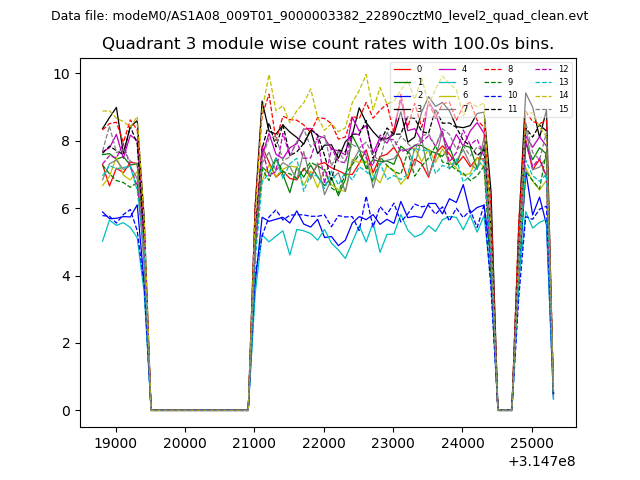
| Module-wise count rates for Quadrant C Data is divided into 100 sec bins |
 |
 |
| Module-wise count rates for Quadrant D Data is divided into 100 sec bins |
 |
 |
| Parameter | Plot |
|---|---|
| CZT HV Monitor | 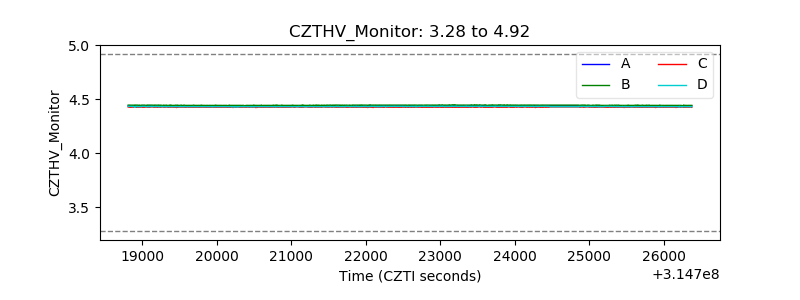 |
| D_VDD | 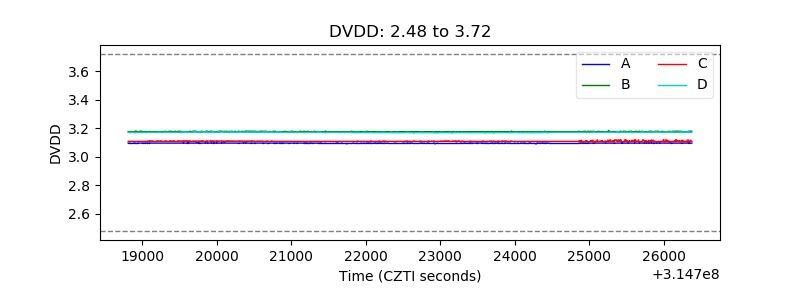 |
| Temperature 1 | 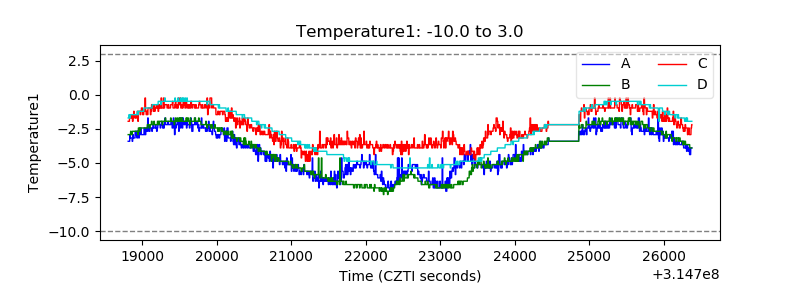 |
| Veto HV Monitor | 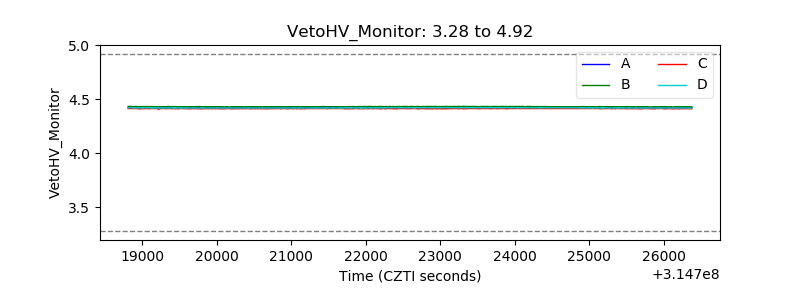 |
| Veto LLD | 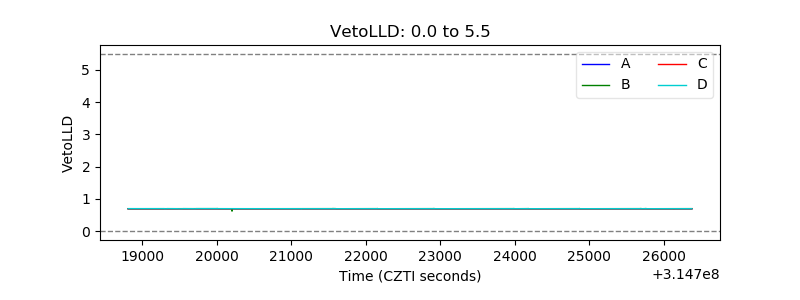 |
| Alpha Counter | 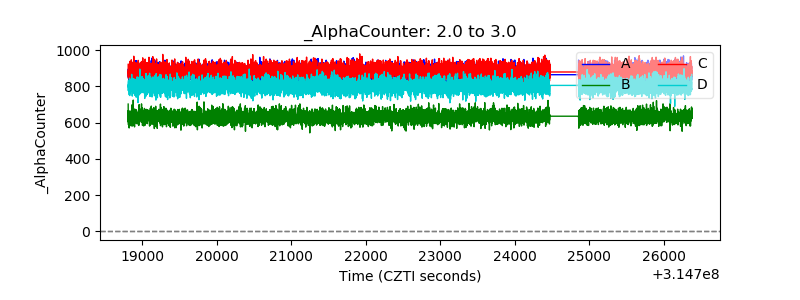 |
| _CPM_Rate | 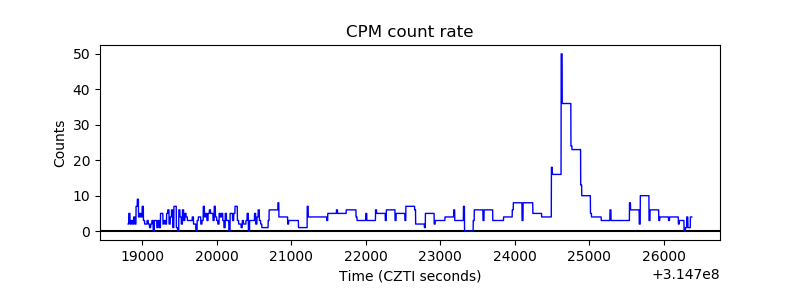 |
| CZT Counter | 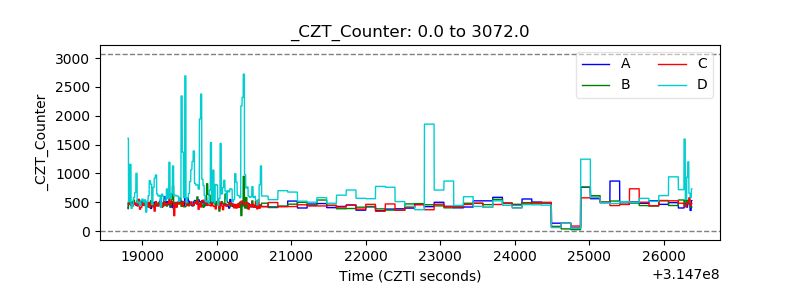 |
| +2.5 Volts monitor |  |
| +5 Volts monitor |  |
| _ROLL_ROT | 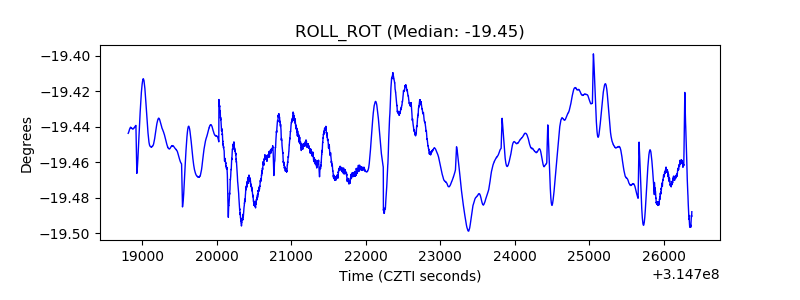 |
| _Roll_DEC | 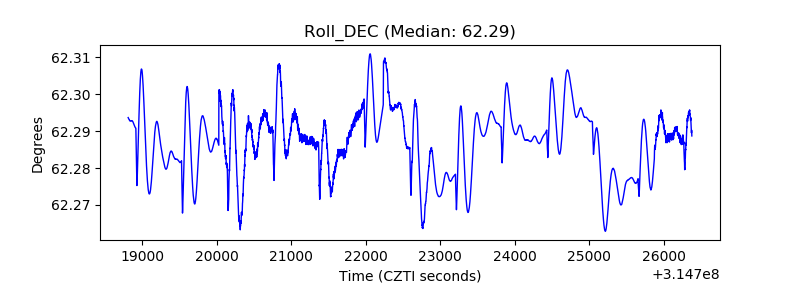 |
| _Roll_RA | 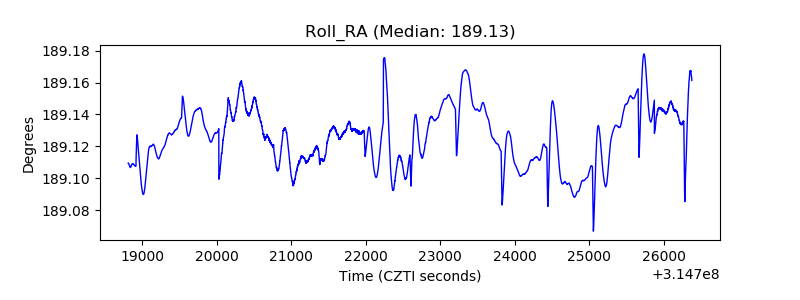 |
| Veto Counter | 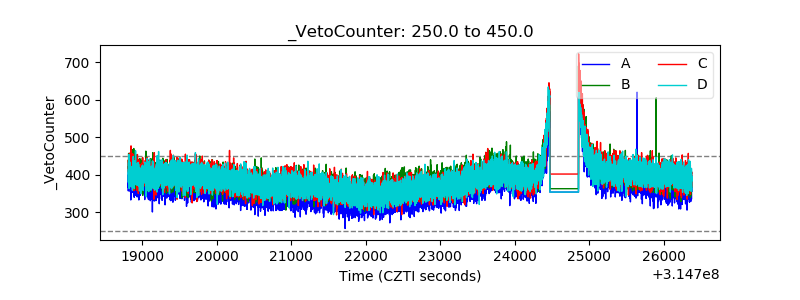 |