| Param | Original file | Final file |
|---|---|---|
| Filename | modeM0/AS1A08_009T01_9000003382_22892cztM0_level2.evt | modeM0/AS1A08_009T01_9000003382_22892cztM0_level2_quad_clean.evt |
| Size (bytes) | 336,525,120 | 64,555,200 |
| Size | 320.9 MB | 61.6 MB |
| Events in quadrant A | 2,195,712 | 410,227 |
| Events in quadrant B | 2,280,010 | 412,906 |
| Events in quadrant C | 2,217,191 | 397,832 |
| Events in quadrant D | 3,163,846 | 388,932 |
| Mode M0 | |||
|---|---|---|---|
| Quadrant | BADHDUFLAG | Total packets | Discarded packets |
| A | 0 | 9944 | 1 |
| B | 0 | 10108 | 1 |
| C | 0 | 9966 | 1 |
| D | 0 | 12721 | 2 |
| Mode SS | |||
|---|---|---|---|
| Quadrant | BADHDUFLAG | Total packets | Discarded packets |
| A | 0 | 98 | 0 |
| B | 0 | 98 | 0 |
| C | 0 | 98 | 0 |
| D | 0 | 98 | 0 |
| Quadrant | Total seconds | Saturated seconds | Saturation percentage |
|---|---|---|---|
| A | 4914 | 28 | 0.569801% |
| B | 4915 | 44 | 0.895219% |
| C | 4915 | 44 | 0.895219% |
| D | 4914 | 73 | 1.485551% |
Noise dominated data is calculated using 1-second bins in cleaned event files. If a bin has >2000 counts, and if more than 50% of those come from <1% of pixels, then it is considered to be noise-dominated and hence unusable.
| Quadrant | # 1 sec bins | Bins with >0 counts | Bins with >2000 counts | High rate bins dominated by noise | Noise dominated (total time) | Noise dominated (detector-on time) | Marked lightcurve |
|---|---|---|---|---|---|---|---|
| A | 4914 | 4914 | 1 | 1 | 0.02% | 0.02% | 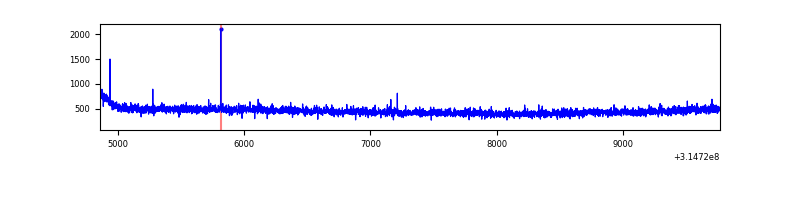 |
| B | 4915 | 4915 | 4 | 4 | 0.08% | 0.08% | 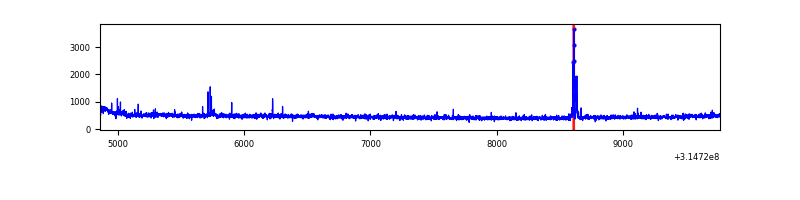 |
| C | 4915 | 4915 | 0 | 0 | 0.00% | 0.00% |  |
| D | 4914 | 4914 | 36 | 36 | 0.73% | 0.73% | 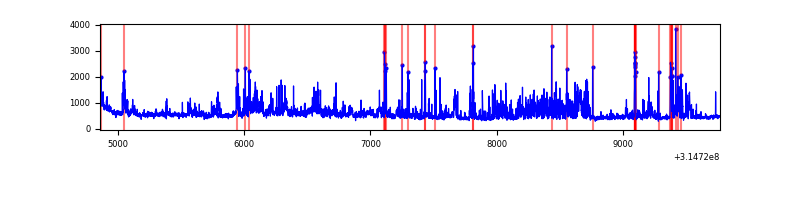 |
Top three noisy pixels from each quadrant. If the there are fewer than three noisy pixels in the level2.evt file, extra rows are filled as -1
| Pixel properties | Quadrant properties | ||||||
|---|---|---|---|---|---|---|---|
| Quadrant | DetID | PixID | Counts | Sigma | Mean | Median | Sigma |
| A | 13 | 254 | 8554 | 69.54 | 566 | 553 | 115.1 |
| A | 13 | 252 | 5550 | 43.43 | 566 | 553 | 115.1 |
| A | 0 | 226 | 4958 | 38.29 | 566 | 553 | 115.1 |
| B | 10 | 247 | 30710 | 276.5 | 563 | 549 | 109.1 |
| B | 0 | 189 | 14794 | 130.59 | 563 | 549 | 109.1 |
| B | 12 | 111 | 13024 | 114.36 | 563 | 549 | 109.1 |
| C | 14 | 238 | 85555 | 664.46 | 541 | 544 | 127.9 |
| C | 8 | 128 | 10004 | 73.94 | 541 | 544 | 127.9 |
| C | 7 | 247 | 6609 | 47.41 | 541 | 544 | 127.9 |
| D | 7 | 238 | 614614 | 4631.52 | 547 | 530 | 132.6 |
| D | 13 | 153 | 168231 | 1264.83 | 547 | 530 | 132.6 |
| D | 12 | 233 | 68667 | 513.9 | 547 | 530 | 132.6 |
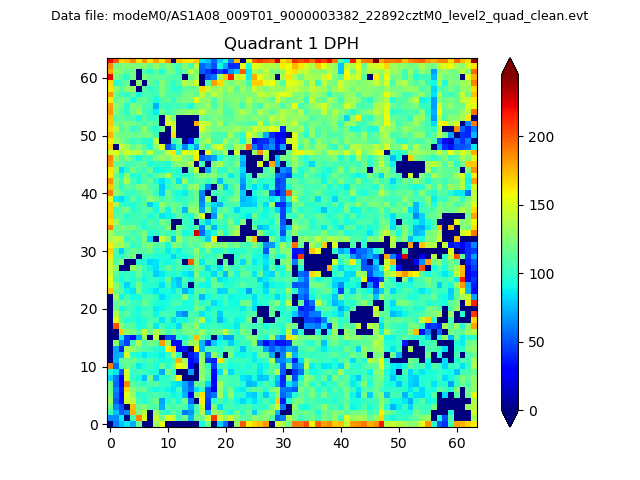
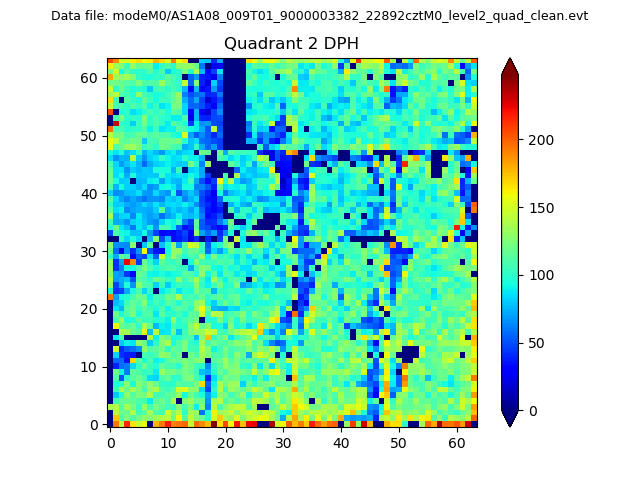
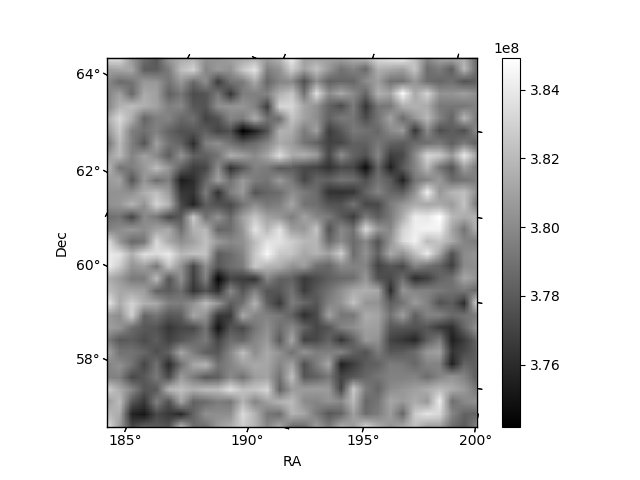
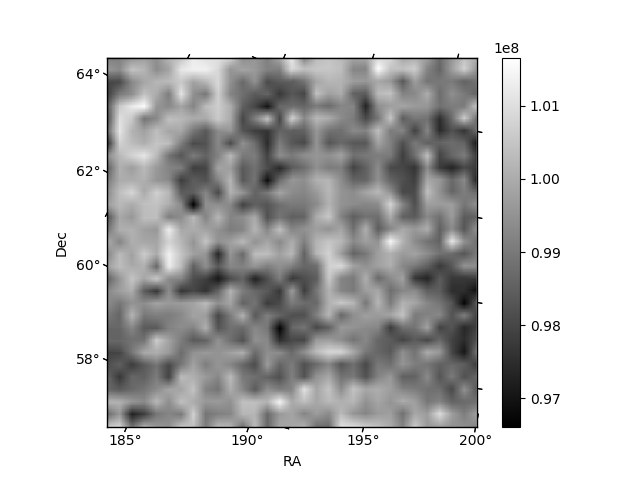
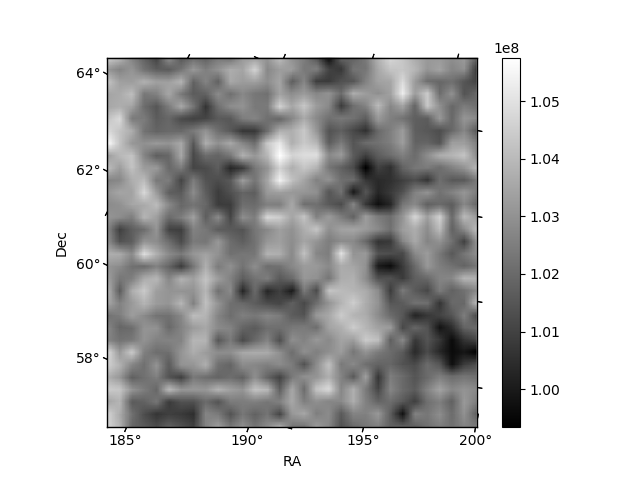
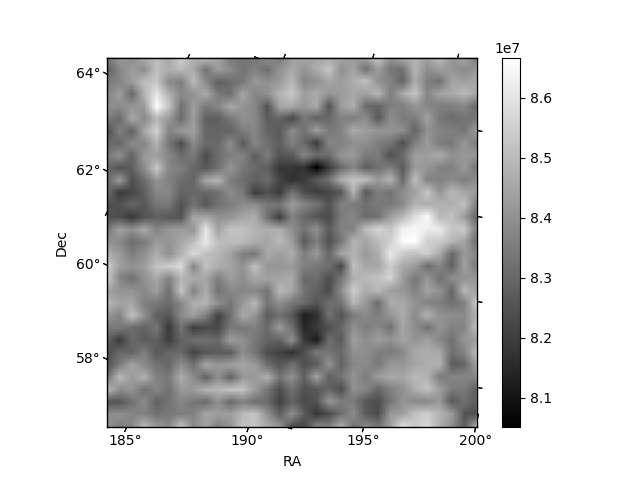
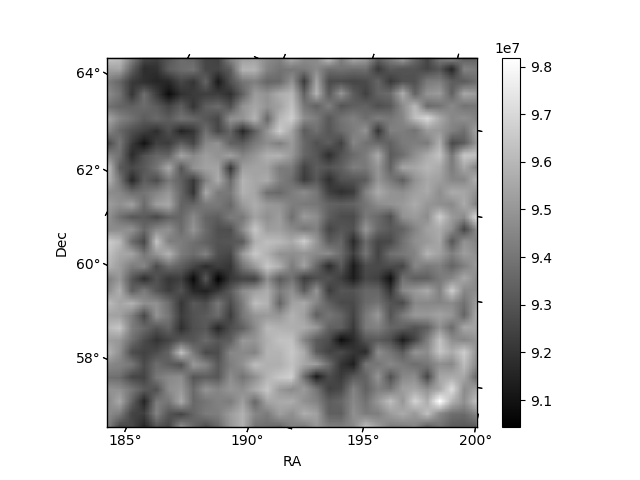
Histogram calculated using DETX and DETY for each event in the final _common_clean file
| Quadrant A | 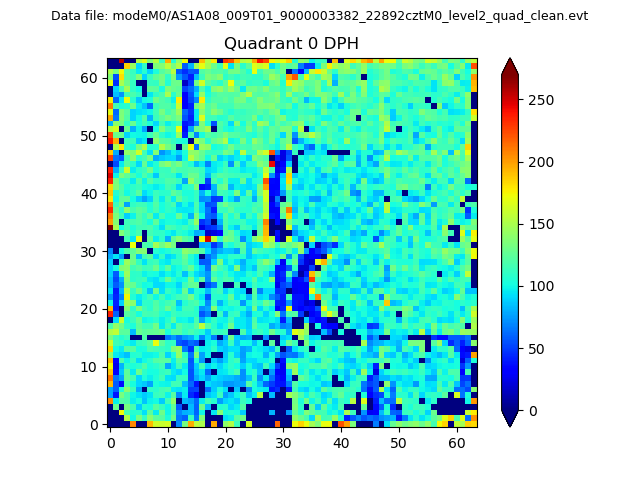 |
 |
Quadrant B |
|---|---|---|---|
| Quadrant D | 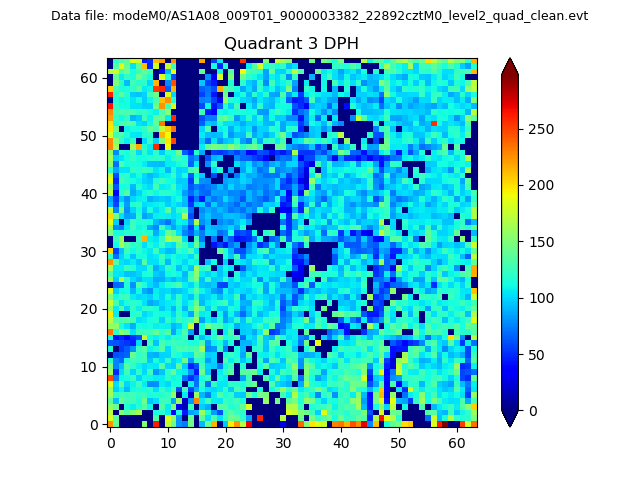 |
 |
Quadrant C |
| Plot type | Count rate plots | Images |
|---|---|---|
| Comparison with Poisson distribution Blue bars denote a histogram of data divided into 1 sec bins. Red curve is a Poisson curve with rate = median count rate of data. |
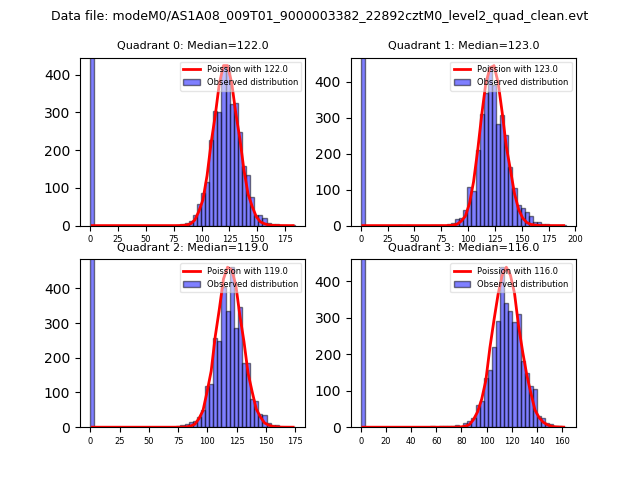 |
 |
| Quadrant-wise count rates Data is divided into 100 sec bins |
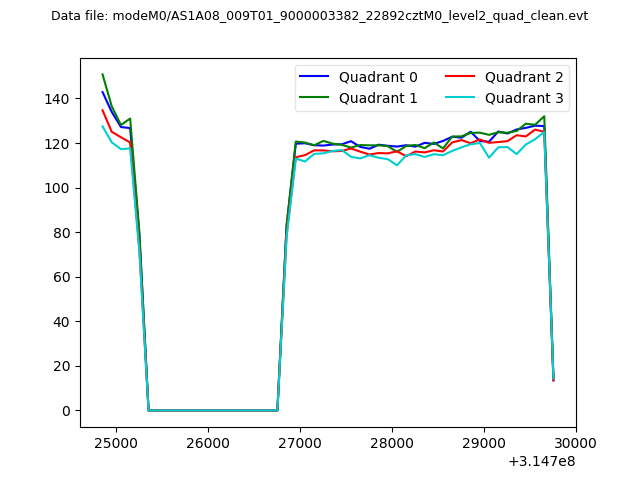 |
|
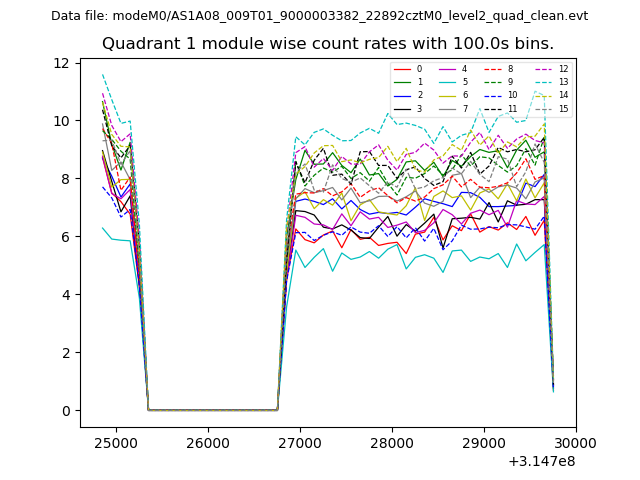
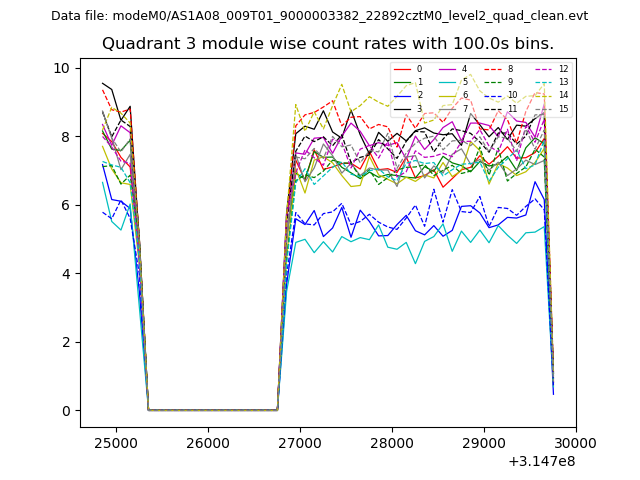
| Module-wise count rates for Quadrant A Data is divided into 100 sec bins |
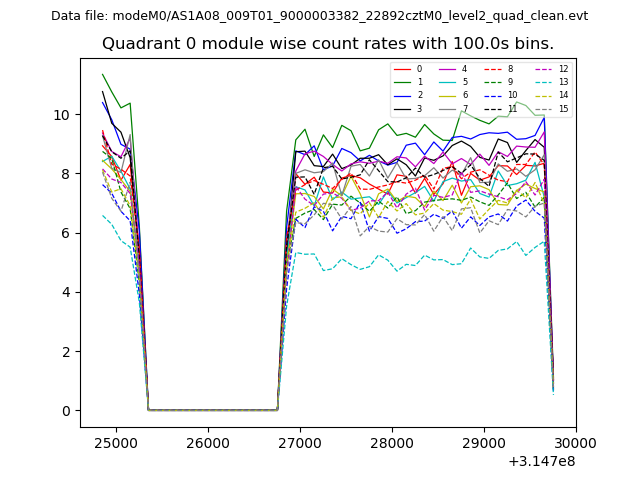 |
 |
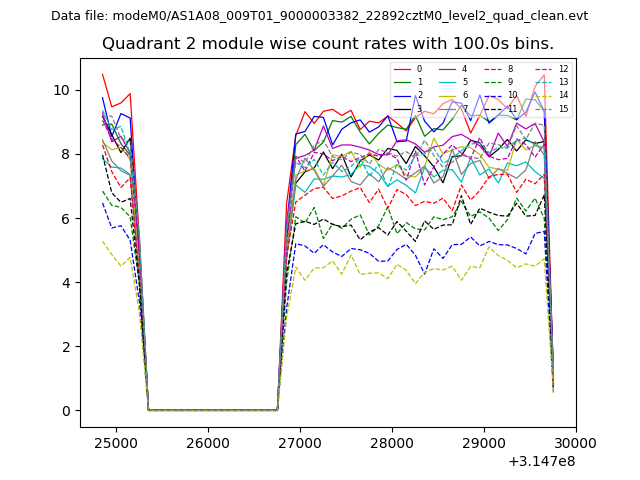
| Module-wise count rates for Quadrant B Data is divided into 100 sec bins |
 |
 |
| Module-wise count rates for Quadrant C Data is divided into 100 sec bins |
 |
 |
| Module-wise count rates for Quadrant D Data is divided into 100 sec bins |
 |
 |
| Parameter | Plot |
|---|---|
| CZT HV Monitor | 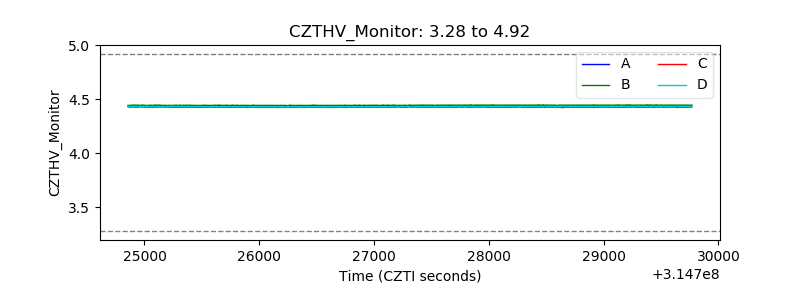 |
| D_VDD | 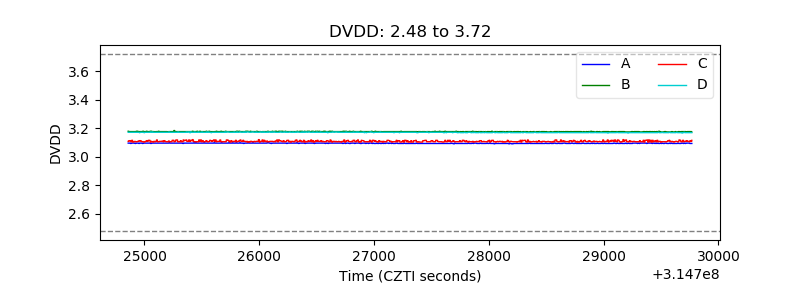 |
| Temperature 1 | 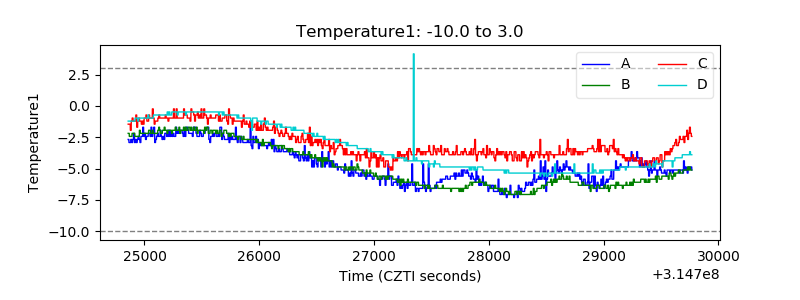 |
| Veto HV Monitor | 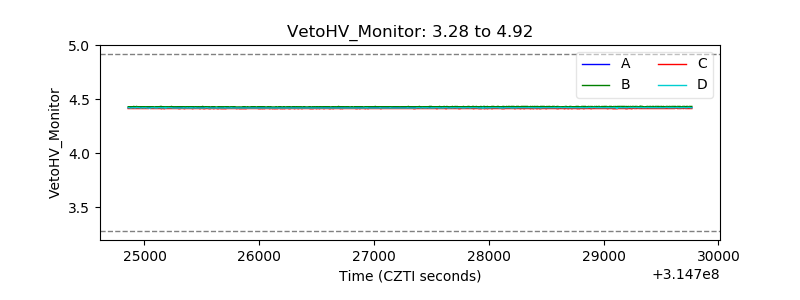 |
| Veto LLD | 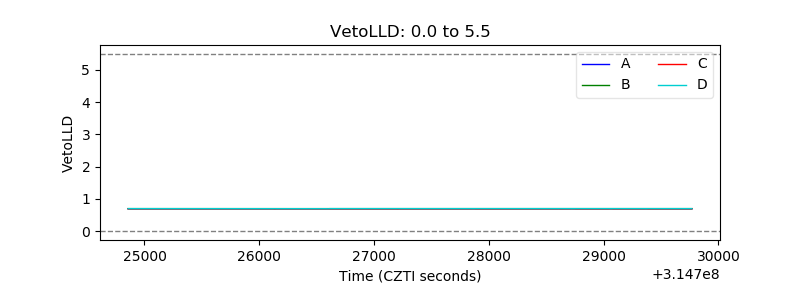 |
| Alpha Counter | 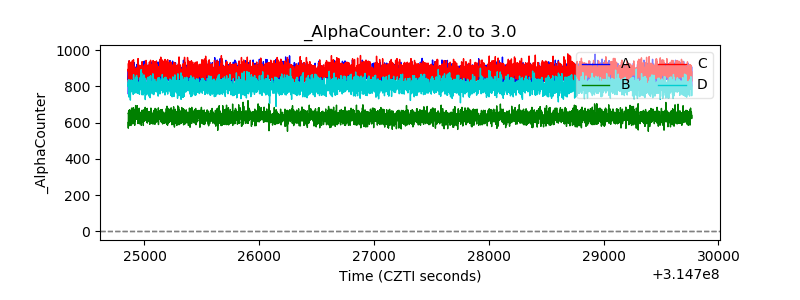 |
| _CPM_Rate | 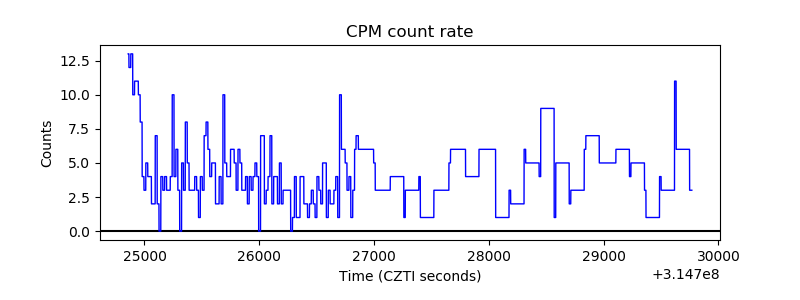 |
| CZT Counter | 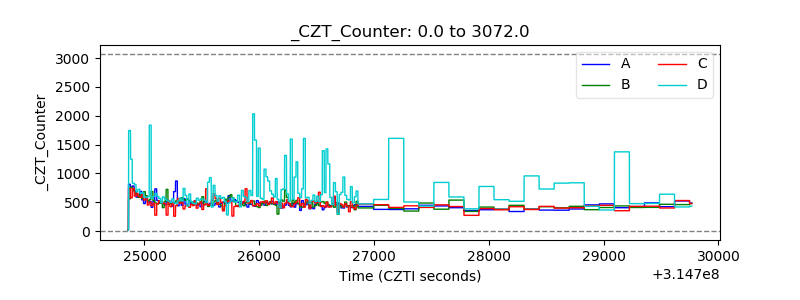 |
| +2.5 Volts monitor |  |
| +5 Volts monitor |  |
| _ROLL_ROT |  |
| _Roll_DEC | 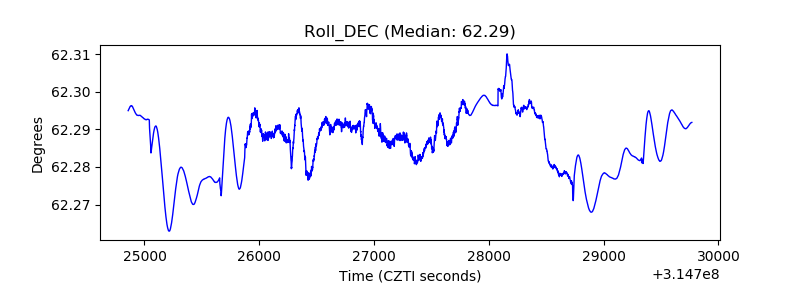 |
| _Roll_RA | 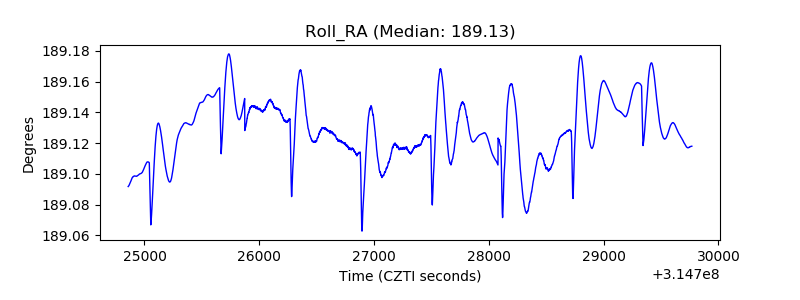 |
| Veto Counter | 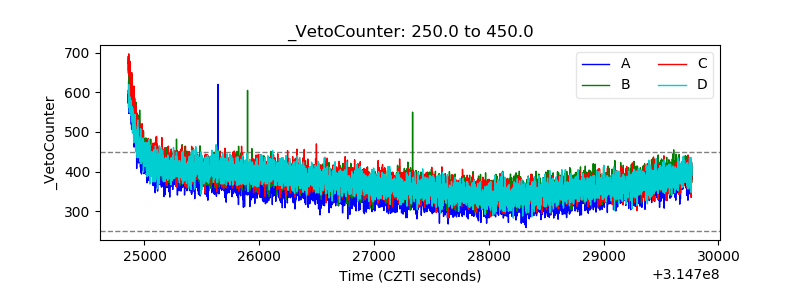 |