| Param | Original file | Final file |
|---|---|---|
| Filename | modeM0/AS1A08_009T01_9000003382_22896cztM0_level2.evt | modeM0/AS1A08_009T01_9000003382_22896cztM0_level2_quad_clean.evt |
| Size (bytes) | 472,438,080 | 115,557,120 |
| Size | 450.6 MB | 110.2 MB |
| Events in quadrant A | 3,102,033 | 771,948 |
| Events in quadrant B | 3,239,456 | 791,637 |
| Events in quadrant C | 3,239,911 | 756,450 |
| Events in quadrant D | 4,274,573 | 716,151 |
| Mode M9 | |||
|---|---|---|---|
| Quadrant | BADHDUFLAG | Total packets | Discarded packets |
| A | 0 | 16 | 0 |
| B | 0 | 17 | 0 |
| C | 0 | 17 | 0 |
| D | 0 | 17 | 0 |
| Mode M0 | |||
|---|---|---|---|
| Quadrant | BADHDUFLAG | Total packets | Discarded packets |
| A | 0 | 13700 | 2 |
| B | 0 | 14057 | 2 |
| C | 0 | 14130 | 2 |
| D | 0 | 17260 | 2 |
| Mode SS | |||
|---|---|---|---|
| Quadrant | BADHDUFLAG | Total packets | Discarded packets |
| A | 0 | 136 | 0 |
| B | 0 | 136 | 0 |
| C | 0 | 136 | 0 |
| D | 0 | 136 | 0 |
| Quadrant | Total seconds | Saturated seconds | Saturation percentage |
|---|---|---|---|
| A | 6648 | 21 | 0.315884% |
| B | 6648 | 29 | 0.436221% |
| C | 6648 | 87 | 1.308664% |
| D | 6648 | 246 | 3.700361% |
Noise dominated data is calculated using 1-second bins in cleaned event files. If a bin has >2000 counts, and if more than 50% of those come from <1% of pixels, then it is considered to be noise-dominated and hence unusable.
| Quadrant | # 1 sec bins | Bins with >0 counts | Bins with >2000 counts | High rate bins dominated by noise | Noise dominated (total time) | Noise dominated (detector-on time) | Marked lightcurve |
|---|---|---|---|---|---|---|---|
| A | 7788 | 6649 | 0 | 0 | 0.00% | 0.00% |  |
| B | 7788 | 6649 | 1 | 1 | 0.01% | 0.02% |  |
| C | 7788 | 6649 | 4 | 4 | 0.05% | 0.06% | 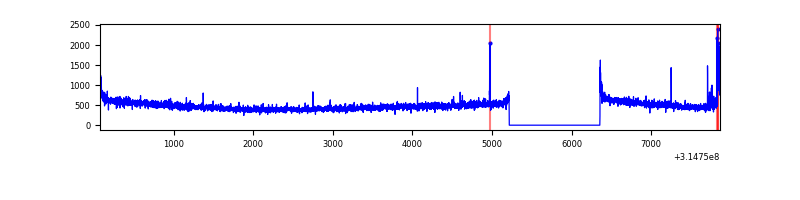 |
| D | 7788 | 6649 | 212 | 212 | 2.72% | 3.19% | 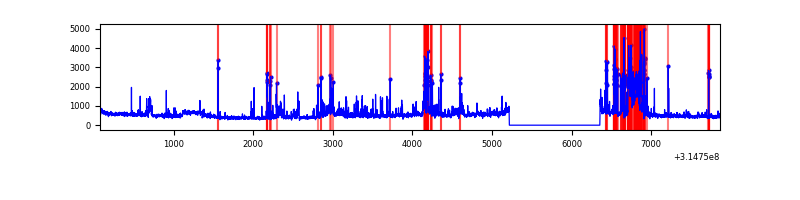 |
Top three noisy pixels from each quadrant. If the there are fewer than three noisy pixels in the level2.evt file, extra rows are filled as -1
| Pixel properties | Quadrant properties | ||||||
|---|---|---|---|---|---|---|---|
| Quadrant | DetID | PixID | Counts | Sigma | Mean | Median | Sigma |
| A | 13 | 254 | 10596 | 60.57 | 804 | 789 | 161.9 |
| A | 3 | 137 | 6894 | 37.7 | 804 | 789 | 161.9 |
| A | 0 | 226 | 6860 | 37.49 | 804 | 789 | 161.9 |
| B | 0 | 230 | 39771 | 255.33 | 806 | 784 | 152.7 |
| B | 12 | 111 | 18029 | 112.94 | 806 | 784 | 152.7 |
| B | 11 | 111 | 16072 | 100.12 | 806 | 784 | 152.7 |
| C | 14 | 238 | 125190 | 687.44 | 778 | 784 | 181.0 |
| C | 0 | 239 | 56050 | 305.39 | 778 | 784 | 181.0 |
| C | 0 | 10 | 14474 | 75.65 | 778 | 784 | 181.0 |
| D | 1 | 52 | 638268 | 3422.76 | 768 | 745 | 186.3 |
| D | 2 | 152 | 221341 | 1184.35 | 768 | 745 | 186.3 |
| D | 9 | 1 | 149384 | 798.02 | 768 | 745 | 186.3 |
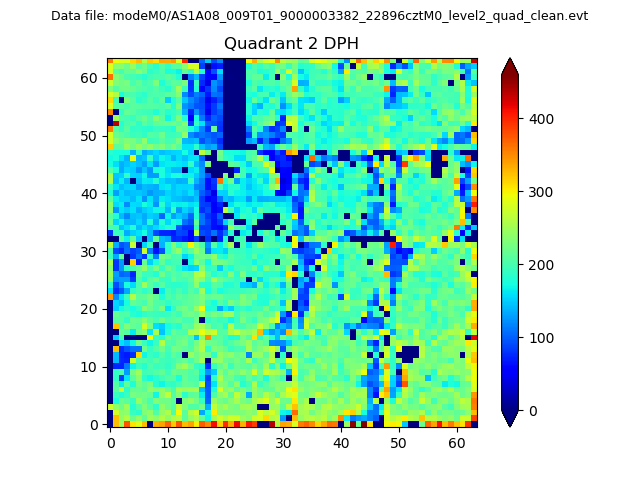
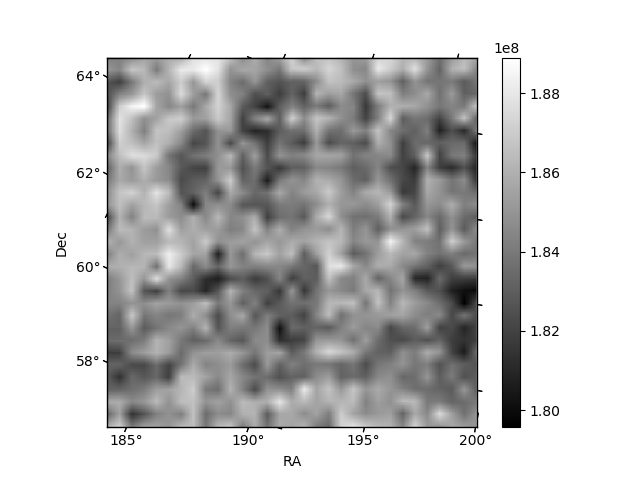
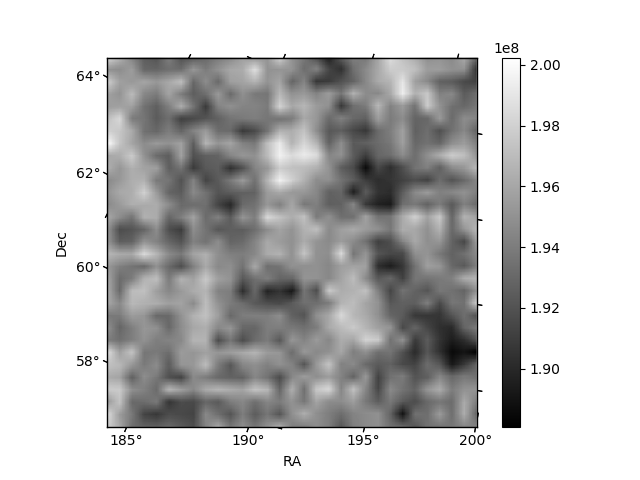
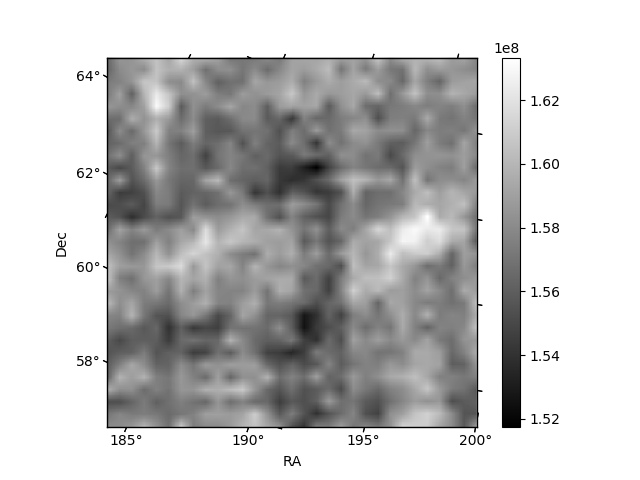
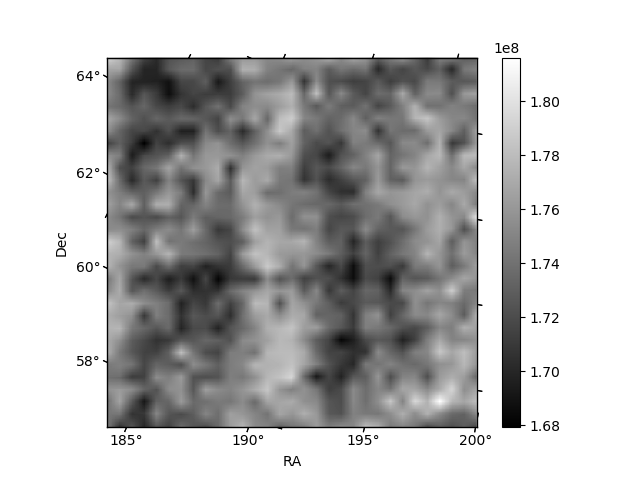
Histogram calculated using DETX and DETY for each event in the final _common_clean file
| Quadrant A | 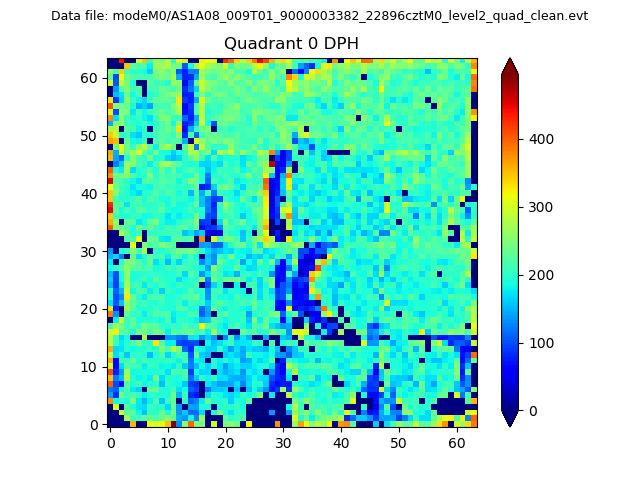 |
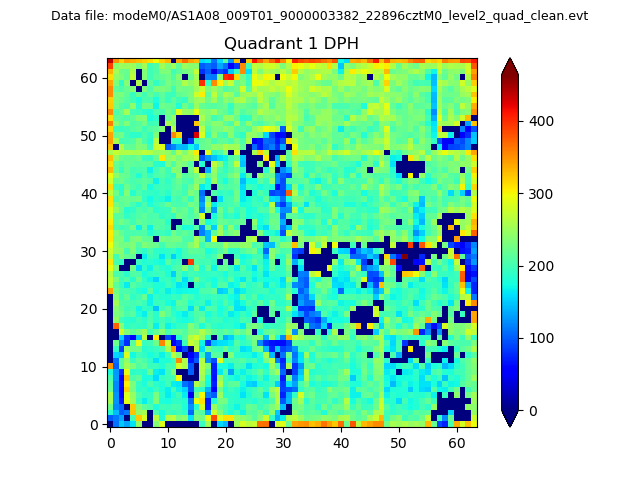 |
Quadrant B |
|---|---|---|---|
| Quadrant D | 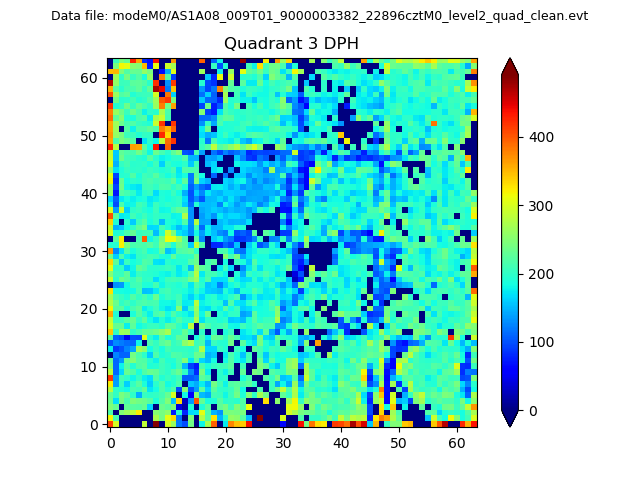 |
 |
Quadrant C |
| Plot type | Count rate plots | Images |
|---|---|---|
| Comparison with Poisson distribution Blue bars denote a histogram of data divided into 1 sec bins. Red curve is a Poisson curve with rate = median count rate of data. |
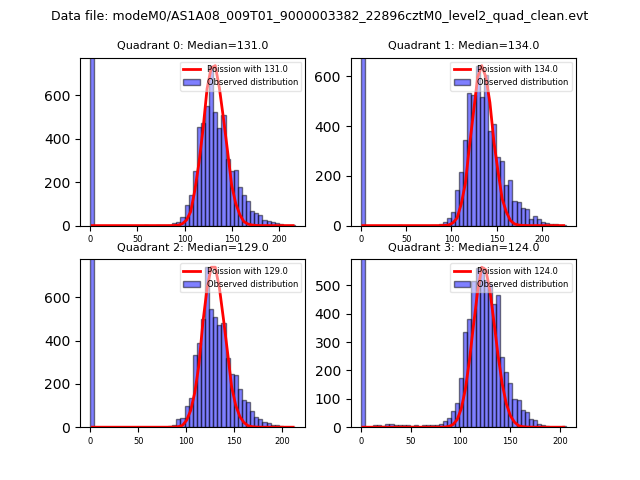 |
 |
| Quadrant-wise count rates Data is divided into 100 sec bins |
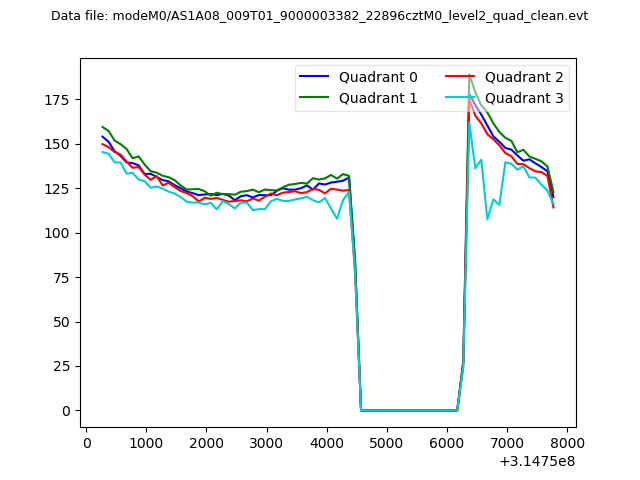 |
|
| Module-wise count rates for Quadrant A Data is divided into 100 sec bins |
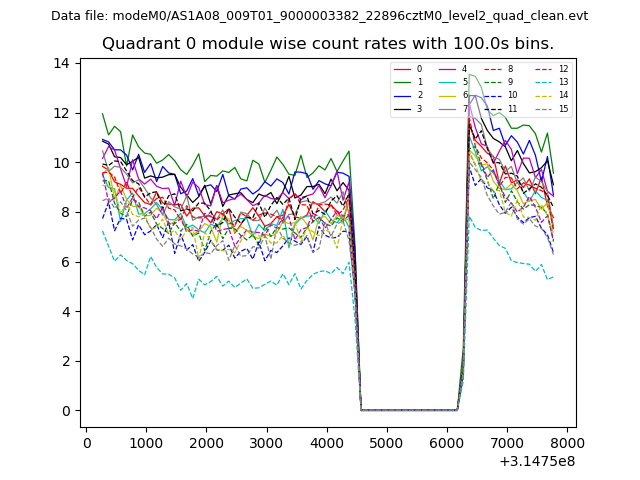 |
 |
| Module-wise count rates for Quadrant B Data is divided into 100 sec bins |
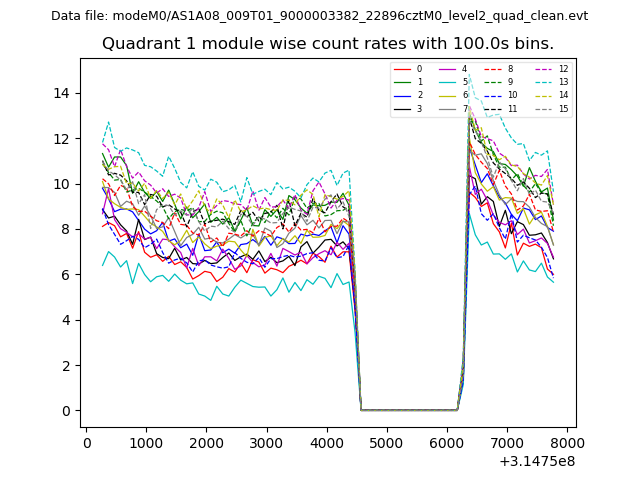 |
 |
| Module-wise count rates for Quadrant C Data is divided into 100 sec bins |
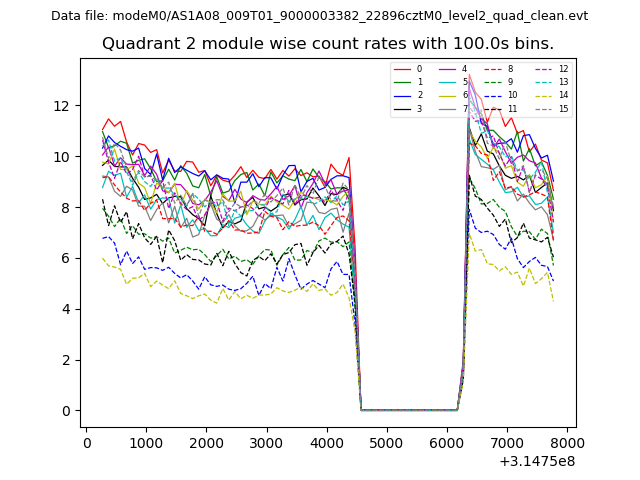 |
 |
| Module-wise count rates for Quadrant D Data is divided into 100 sec bins |
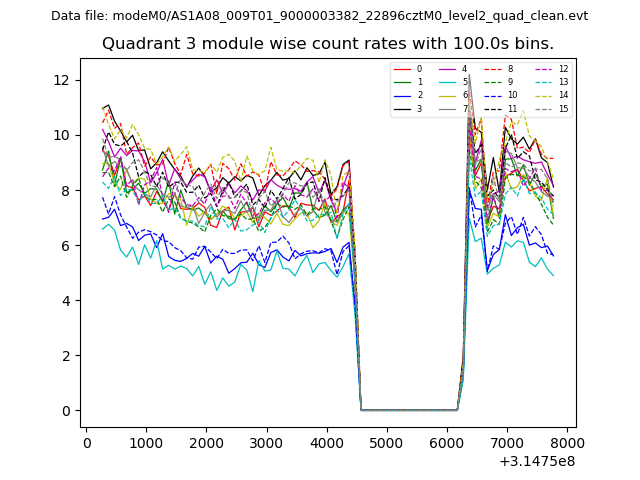 |
 |
| Parameter | Plot |
|---|---|
| CZT HV Monitor | 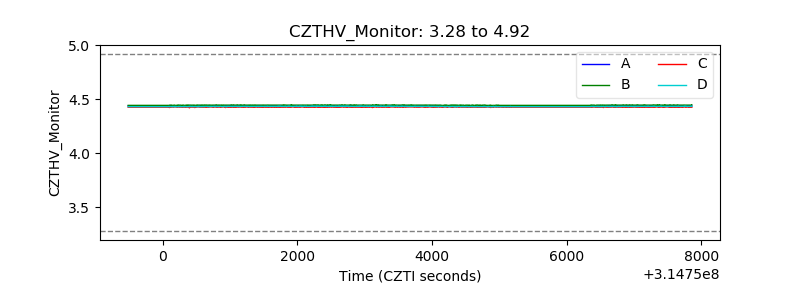 |
| D_VDD | 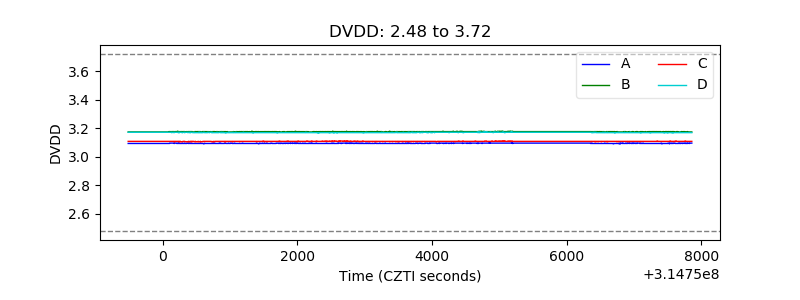 |
| Temperature 1 | 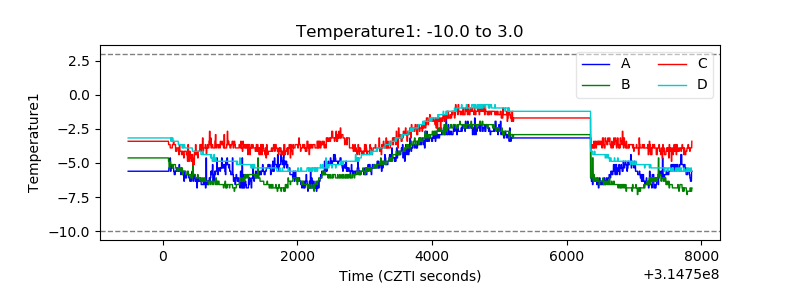 |
| Veto HV Monitor | 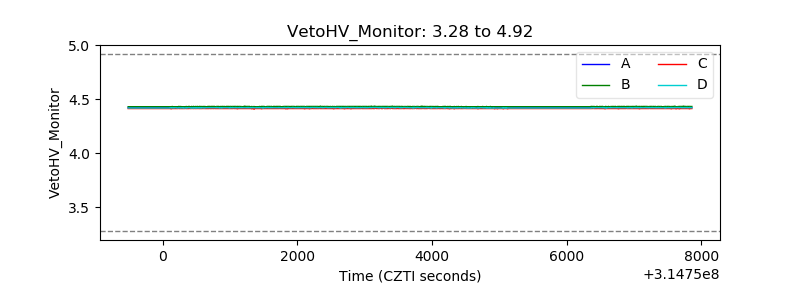 |
| Veto LLD | 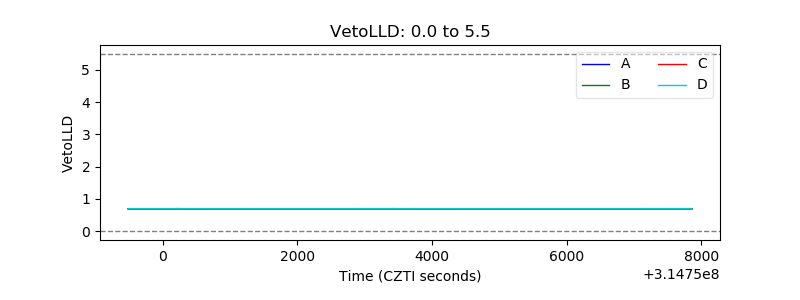 |
| Alpha Counter | 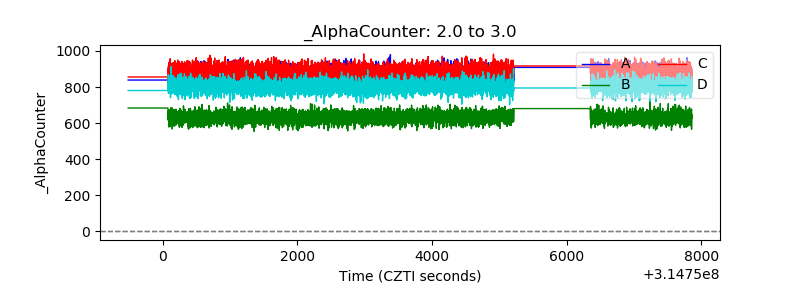 |
| _CPM_Rate | 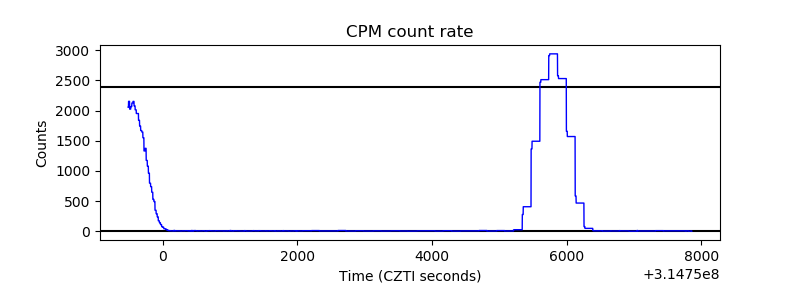 |
| CZT Counter | 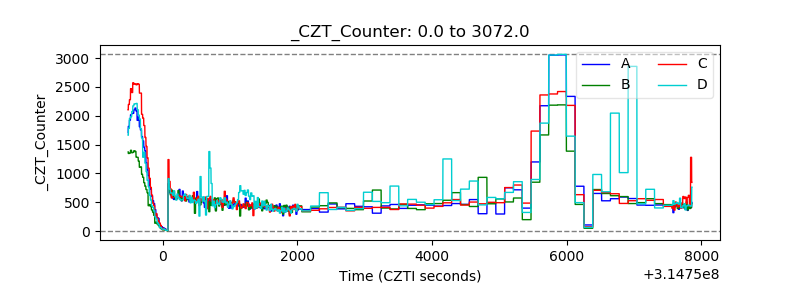 |
| +2.5 Volts monitor | 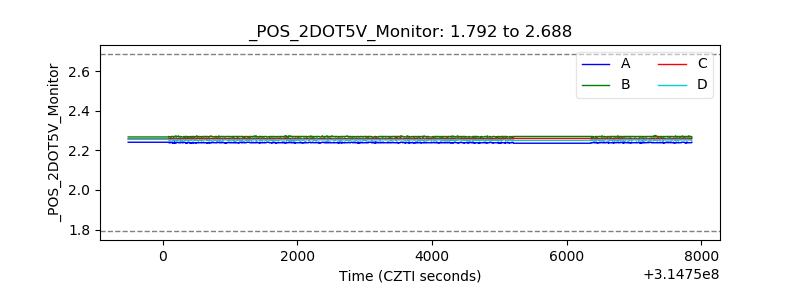 |
| +5 Volts monitor | 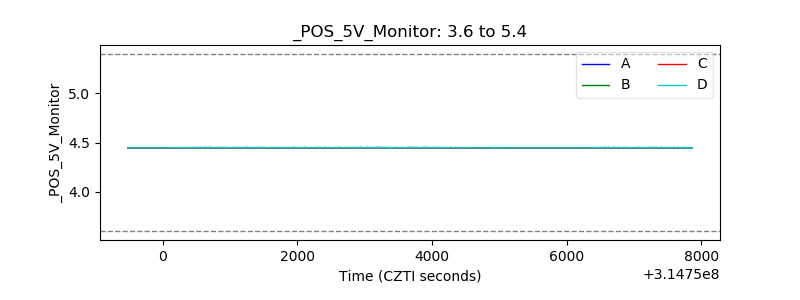 |
| _ROLL_ROT | 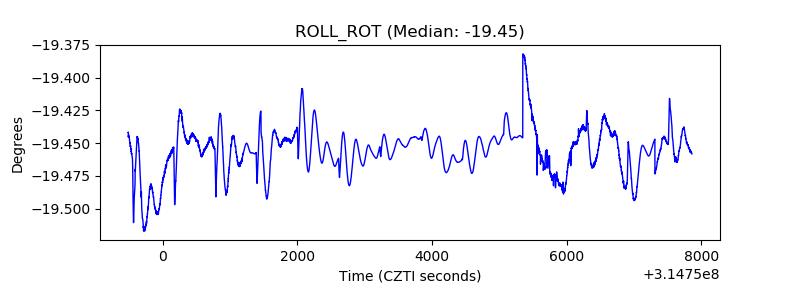 |
| _Roll_DEC | 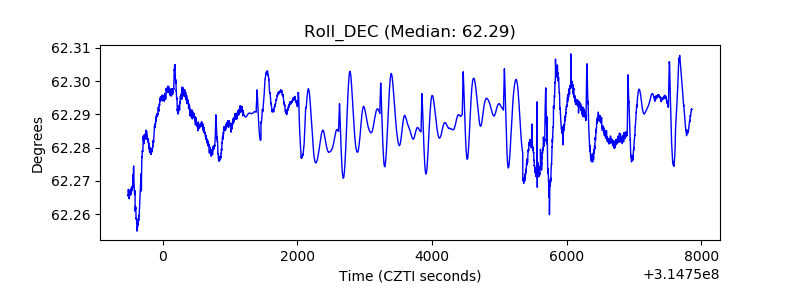 |
| _Roll_RA | 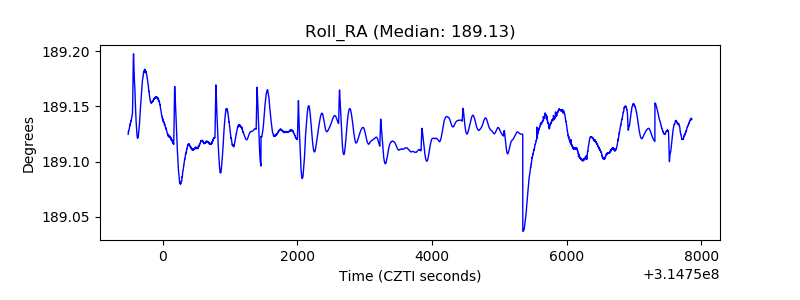 |
| Veto Counter | 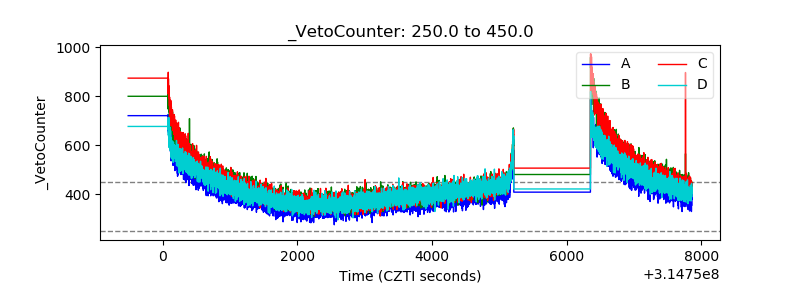 |