| Param | Original file | Final file |
|---|---|---|
| Filename | modeM0/AS1A08_009T01_9000003382_22897cztM0_level2.evt | modeM0/AS1A08_009T01_9000003382_22897cztM0_level2_quad_clean.evt |
| Size (bytes) | 523,791,360 | 114,053,760 |
| Size | 499.5 MB | 108.8 MB |
| Events in quadrant A | 3,077,336 | 777,293 |
| Events in quadrant B | 3,214,980 | 799,433 |
| Events in quadrant C | 4,049,972 | 730,348 |
| Events in quadrant D | 5,081,892 | 695,826 |
| Mode M9 | |||
|---|---|---|---|
| Quadrant | BADHDUFLAG | Total packets | Discarded packets |
| A | 0 | 20 | 0 |
| B | 0 | 21 | 0 |
| C | 0 | 21 | 0 |
| D | 0 | 21 | 0 |
| Mode M0 | |||
|---|---|---|---|
| Quadrant | BADHDUFLAG | Total packets | Discarded packets |
| A | 0 | 13379 | 2 |
| B | 0 | 13773 | 2 |
| C | 0 | 16262 | 2 |
| D | 0 | 19481 | 2 |
| Mode SS | |||
|---|---|---|---|
| Quadrant | BADHDUFLAG | Total packets | Discarded packets |
| A | 0 | 130 | 0 |
| B | 0 | 130 | 0 |
| C | 0 | 130 | 0 |
| D | 0 | 130 | 0 |
| Quadrant | Total seconds | Saturated seconds | Saturation percentage |
|---|---|---|---|
| A | 6470 | 15 | 0.231839% |
| B | 6470 | 34 | 0.525502% |
| C | 6470 | 363 | 5.610510% |
| D | 6470 | 564 | 8.717156% |
Noise dominated data is calculated using 1-second bins in cleaned event files. If a bin has >2000 counts, and if more than 50% of those come from <1% of pixels, then it is considered to be noise-dominated and hence unusable.
| Quadrant | # 1 sec bins | Bins with >0 counts | Bins with >2000 counts | High rate bins dominated by noise | Noise dominated (total time) | Noise dominated (detector-on time) | Marked lightcurve |
|---|---|---|---|---|---|---|---|
| A | 7715 | 6471 | 0 | 0 | 0.00% | 0.00% | 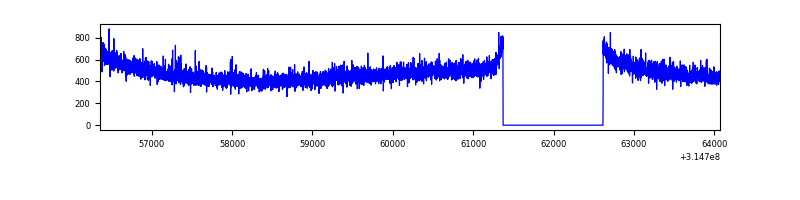 |
| B | 7715 | 6471 | 2 | 2 | 0.03% | 0.03% | 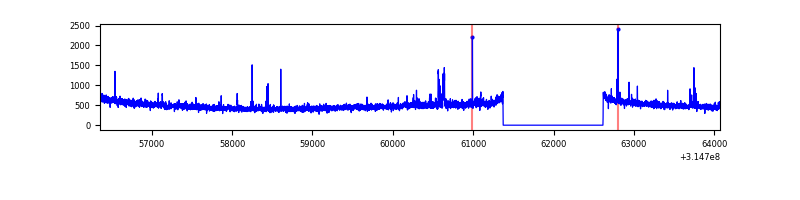 |
| C | 7715 | 6471 | 246 | 246 | 3.19% | 3.80% | 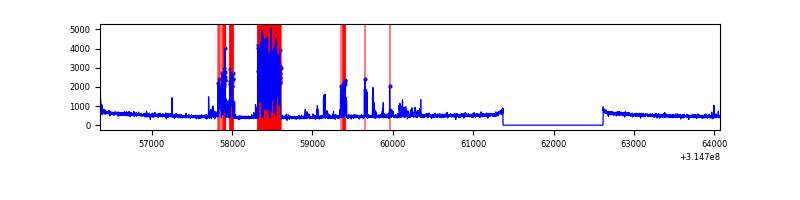 |
| D | 7715 | 6471 | 528 | 528 | 6.84% | 8.16% | 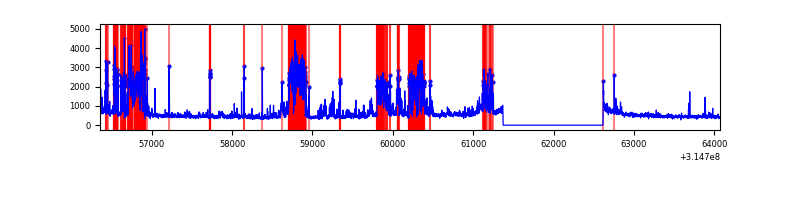 |
Top three noisy pixels from each quadrant. If the there are fewer than three noisy pixels in the level2.evt file, extra rows are filled as -1
| Pixel properties | Quadrant properties | ||||||
|---|---|---|---|---|---|---|---|
| Quadrant | DetID | PixID | Counts | Sigma | Mean | Median | Sigma |
| A | 13 | 254 | 10073 | 59.06 | 797 | 783 | 157.3 |
| A | 0 | 226 | 6825 | 38.41 | 797 | 783 | 157.3 |
| A | 3 | 137 | 6585 | 36.88 | 797 | 783 | 157.3 |
| B | 0 | 190 | 33885 | 221.42 | 801 | 783 | 149.5 |
| B | 4 | 173 | 19198 | 123.18 | 801 | 783 | 149.5 |
| B | 12 | 111 | 17539 | 112.08 | 801 | 783 | 149.5 |
| C | 0 | 239 | 999080 | 5855.63 | 748 | 755 | 170.5 |
| C | 14 | 238 | 121609 | 708.86 | 748 | 755 | 170.5 |
| C | 0 | 10 | 6523 | 33.83 | 748 | 755 | 170.5 |
| D | 1 | 52 | 2000581 | 11207.51 | 742 | 721 | 178.4 |
| D | 9 | 1 | 68405 | 379.31 | 742 | 721 | 178.4 |
| D | 13 | 153 | 61262 | 339.28 | 742 | 721 | 178.4 |
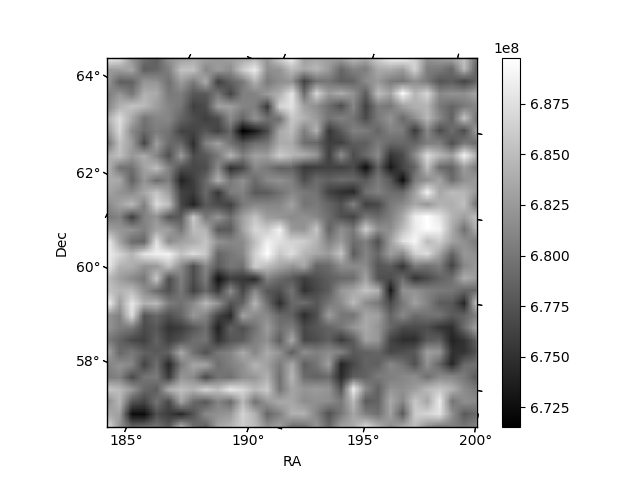
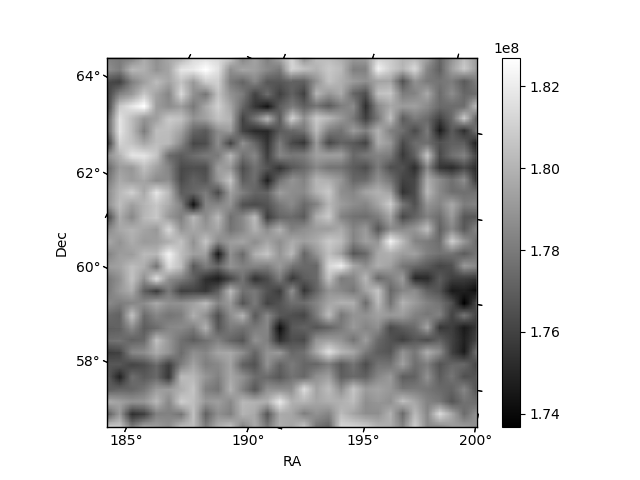
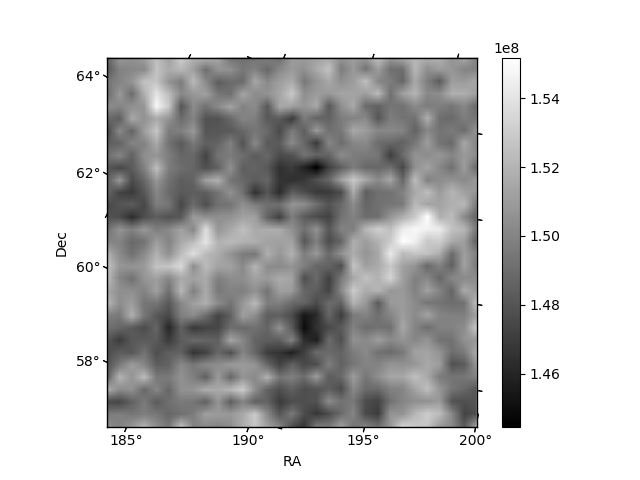
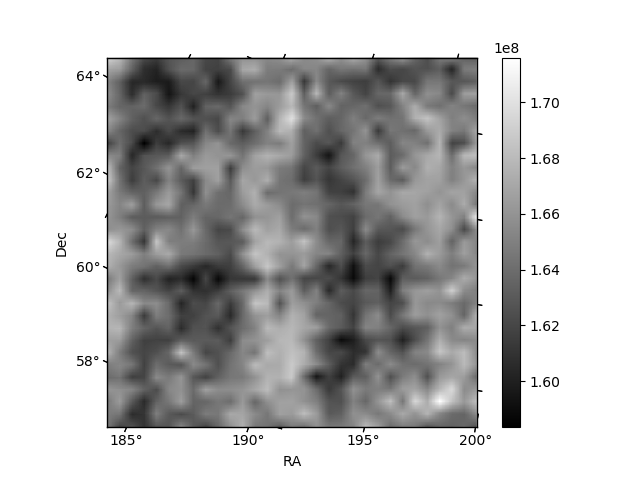
Histogram calculated using DETX and DETY for each event in the final _common_clean file
| Quadrant A | 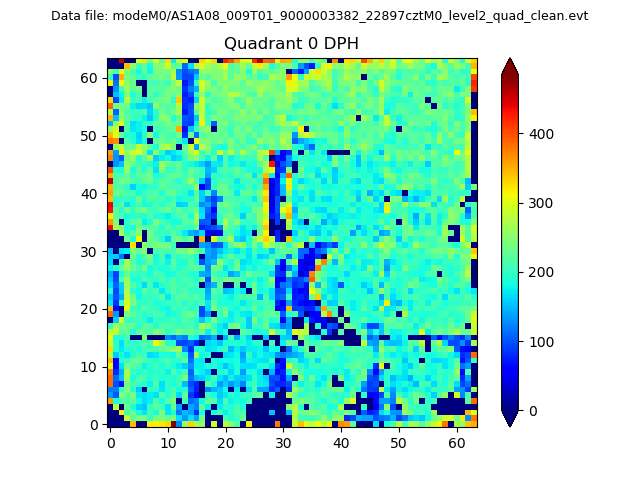 |
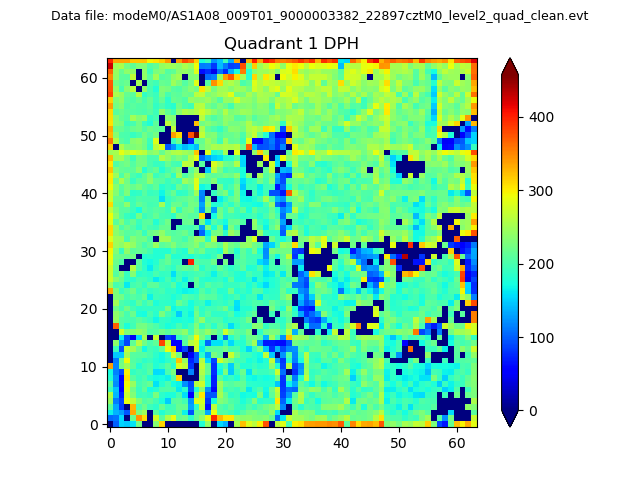 |
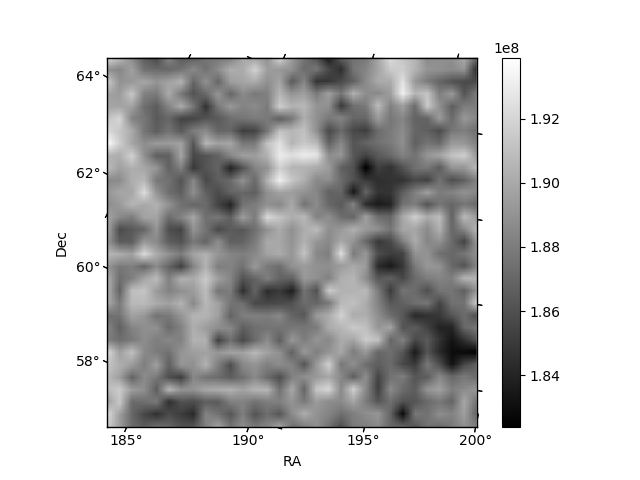
Quadrant B |
|---|---|---|---|
| Quadrant D | 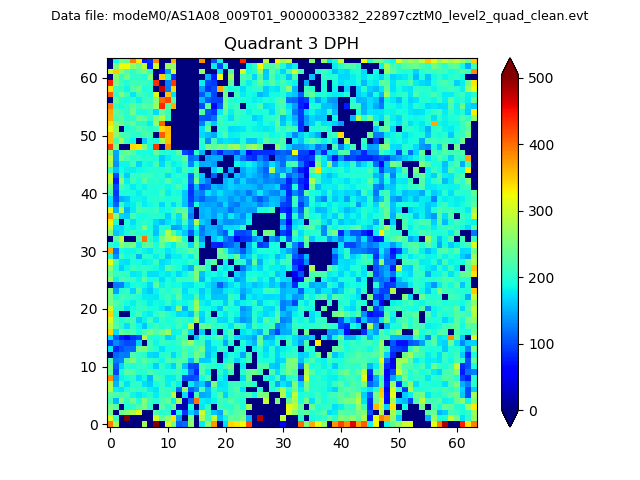 |
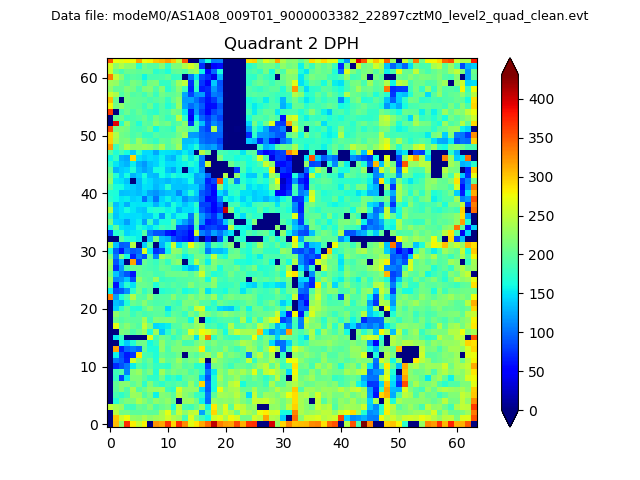 |
Quadrant C |
| Plot type | Count rate plots | Images |
|---|---|---|
| Comparison with Poisson distribution Blue bars denote a histogram of data divided into 1 sec bins. Red curve is a Poisson curve with rate = median count rate of data. |
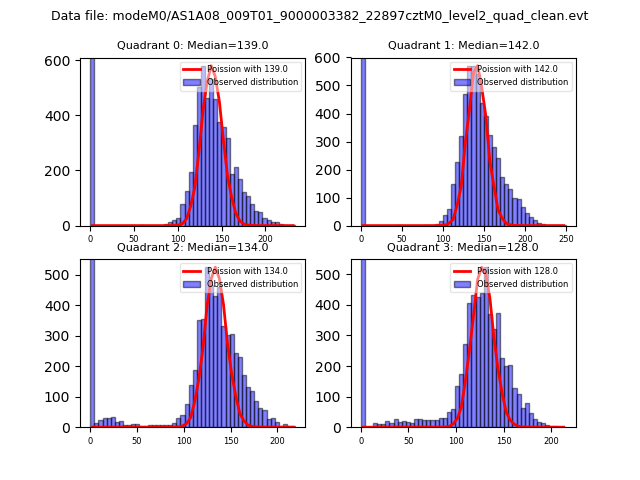 |
 |
| Quadrant-wise count rates Data is divided into 100 sec bins |
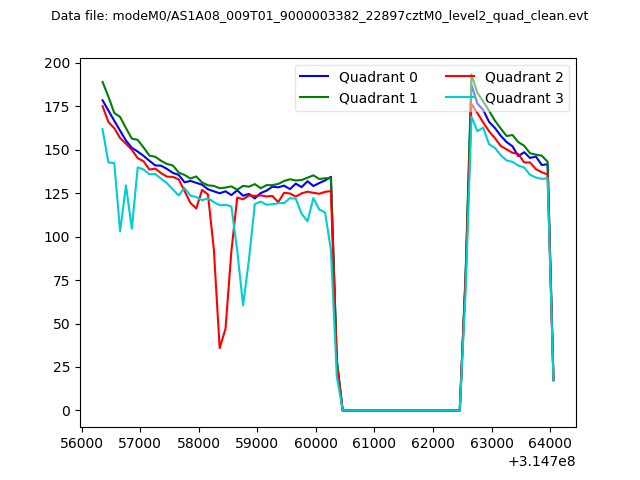 |
|
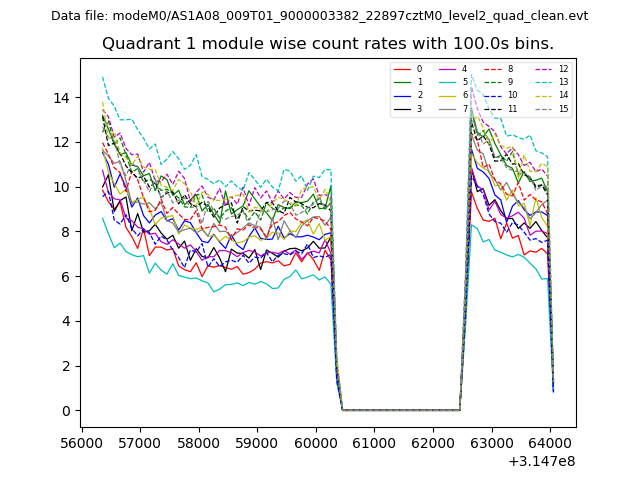
| Module-wise count rates for Quadrant A Data is divided into 100 sec bins |
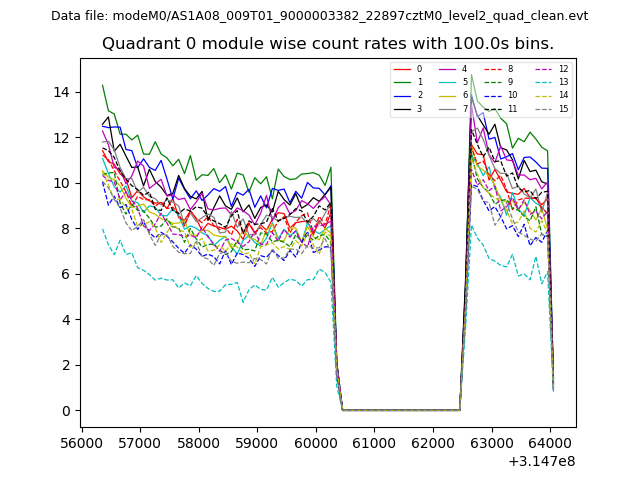 |
 |
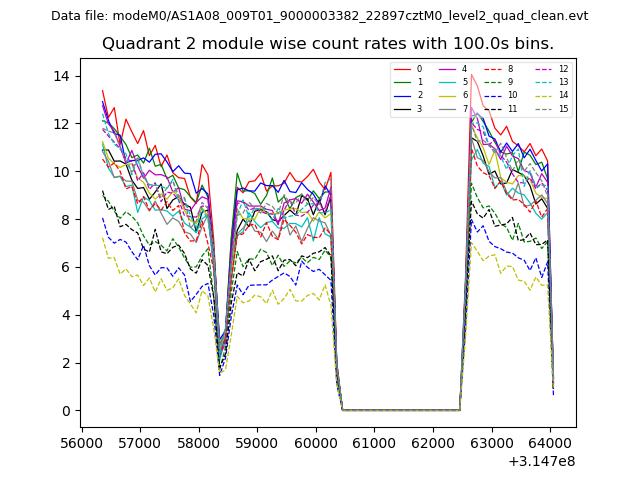
| Module-wise count rates for Quadrant B Data is divided into 100 sec bins |
 |
 |
| Module-wise count rates for Quadrant C Data is divided into 100 sec bins |
 |
 |
| Module-wise count rates for Quadrant D Data is divided into 100 sec bins |
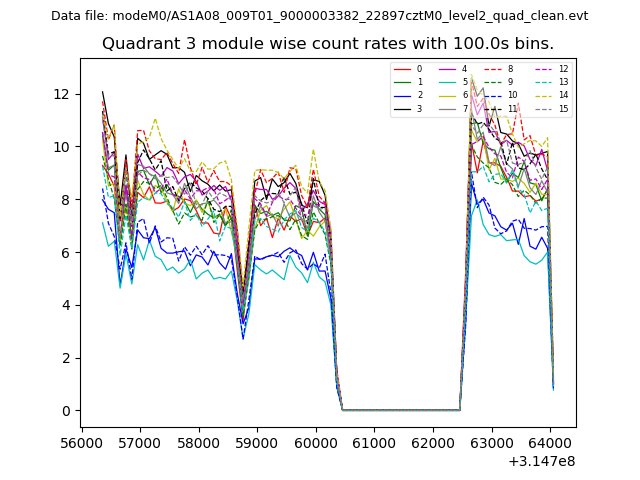 |
 |
| Parameter | Plot |
|---|---|
| CZT HV Monitor | 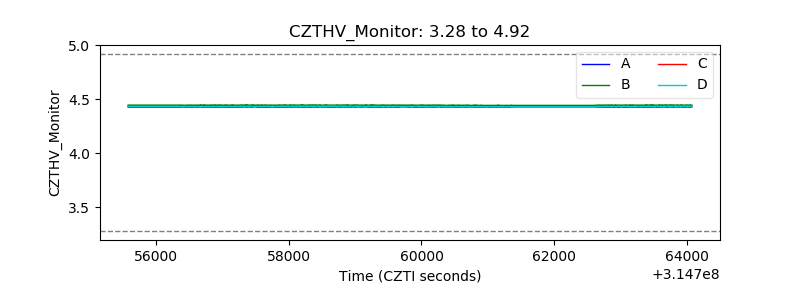 |
| D_VDD | 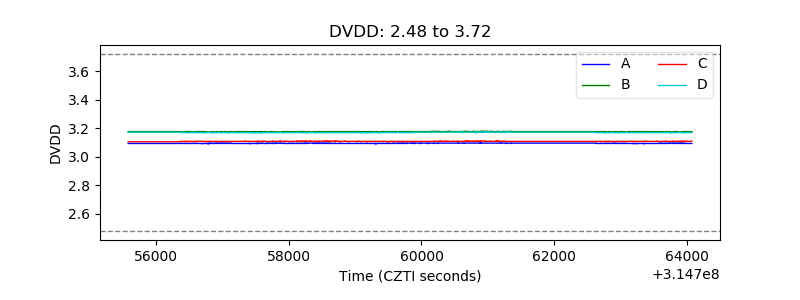 |
| Temperature 1 | 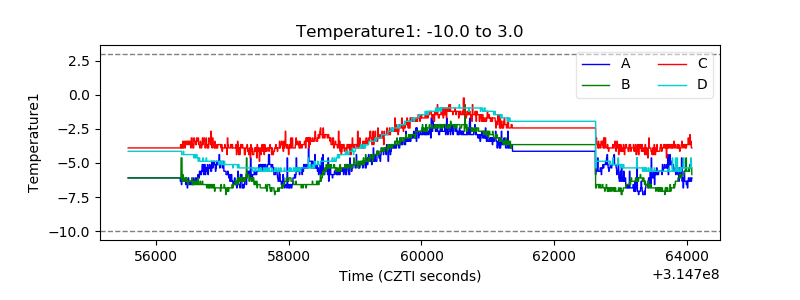 |
| Veto HV Monitor | 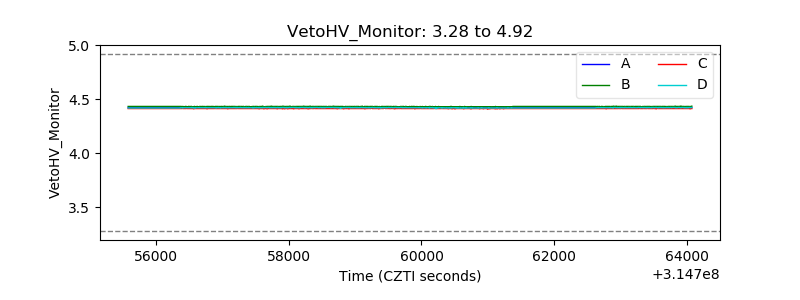 |
| Veto LLD |  |
| Alpha Counter | 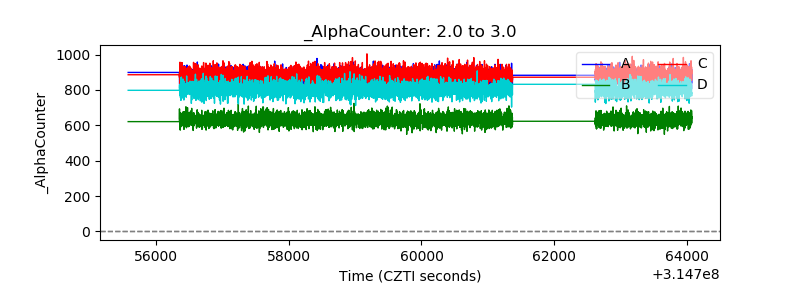 |
| _CPM_Rate | 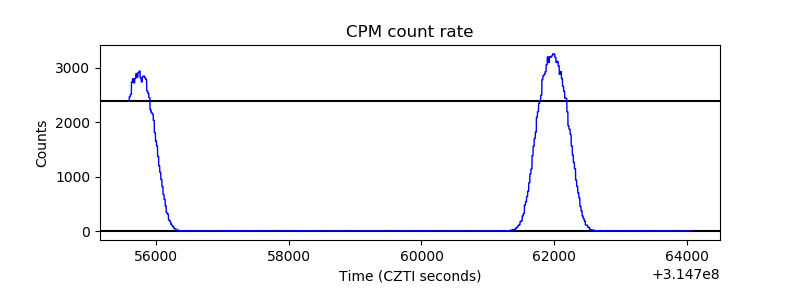 |
| CZT Counter | 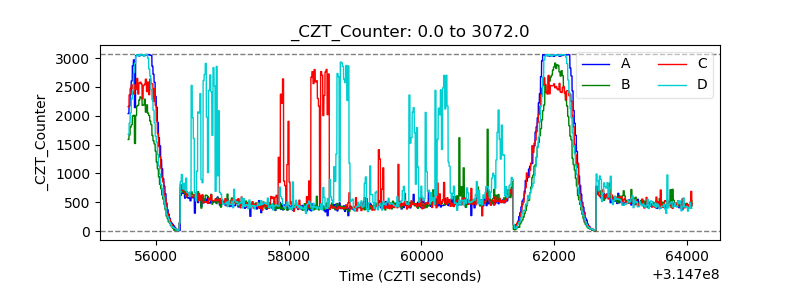 |
| +2.5 Volts monitor |  |
| +5 Volts monitor | 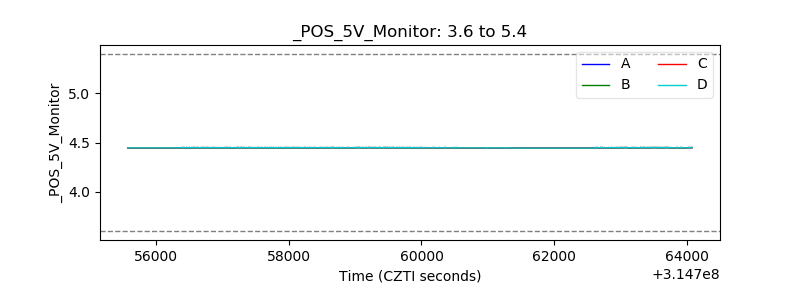 |
| _ROLL_ROT | 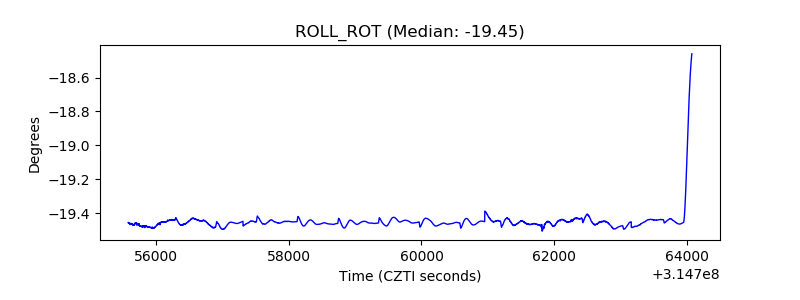 |
| _Roll_DEC | 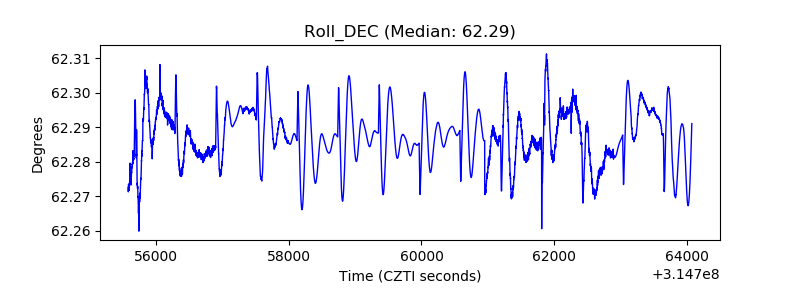 |
| _Roll_RA | 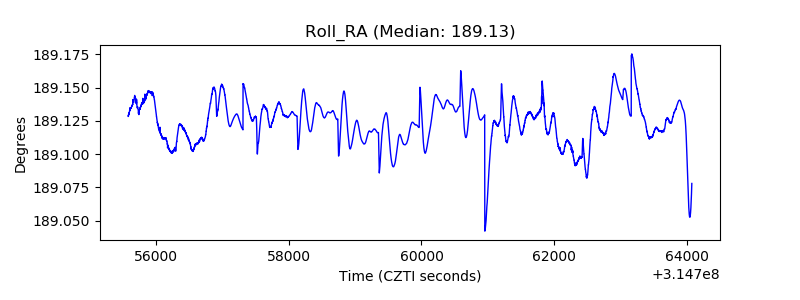 |
| Veto Counter | 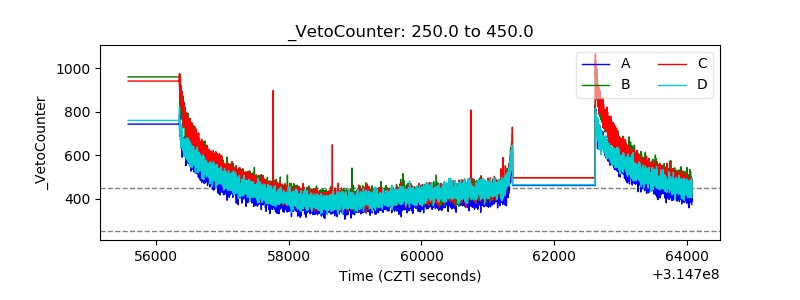 |