| Param | Original file | Final file |
|---|---|---|
| Filename | modeM0/AS1A08_009T01_9000003382_22898cztM0_level2.evt | modeM0/AS1A08_009T01_9000003382_22898cztM0_level2_quad_clean.evt |
| Size (bytes) | 19,321,920 | 6,696,000 |
| Size | 18.4 MB | 6.4 MB |
| Events in quadrant A | 128,674 | 41,151 |
| Events in quadrant B | 150,015 | 47,031 |
| Events in quadrant C | 140,197 | 42,573 |
| Events in quadrant D | 142,695 | 42,897 |
| Mode M9 | |||
|---|---|---|---|
| Quadrant | BADHDUFLAG | Total packets | Discarded packets |
| A | 0 | 14 | 13 |
| B | 0 | 15 | 15 |
| C | 0 | 17 | 17 |
| D | 0 | 10 | 9 |
| Mode M0 | |||
|---|---|---|---|
| Quadrant | BADHDUFLAG | Total packets | Discarded packets |
| A | 0 | 8602 | 8074 |
| B | 0 | 8087 | 7490 |
| C | 0 | 7910 | 7338 |
| D | 0 | 8778 | 8185 |
| Mode SS | |||
|---|---|---|---|
| Quadrant | BADHDUFLAG | Total packets | Discarded packets |
| A | 0 | 76 | 70 |
| B | 0 | 78 | 68 |
| C | 0 | 78 | 70 |
| D | 0 | 78 | 72 |
| Quadrant | Total seconds | Saturated seconds | Saturation percentage |
|---|---|---|---|
| A | 263 | 1 | 0.380228% |
| B | 291 | 1 | 0.343643% |
| C | 279 | 1 | 0.358423% |
| D | 290 | 0 | 0.000000% |
Noise dominated data is calculated using 1-second bins in cleaned event files. If a bin has >2000 counts, and if more than 50% of those come from <1% of pixels, then it is considered to be noise-dominated and hence unusable.
| Quadrant | # 1 sec bins | Bins with >0 counts | Bins with >2000 counts | High rate bins dominated by noise | Noise dominated (total time) | Noise dominated (detector-on time) | Marked lightcurve |
|---|---|---|---|---|---|---|---|
| A | 7635 | 467 | 0 | 0 | 0.00% | 0.00% |  |
| B | 7497 | 519 | 0 | 0 | 0.00% | 0.00% | 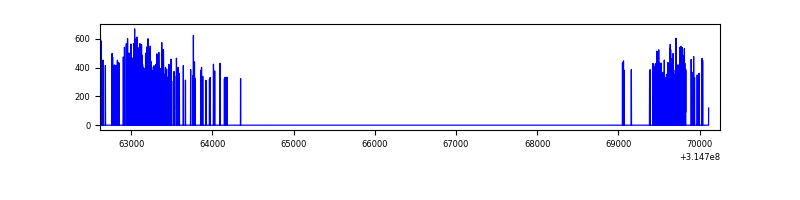 |
| C | 7322 | 495 | 0 | 0 | 0.00% | 0.00% |  |
| D | 7365 | 518 | 0 | 0 | 0.00% | 0.00% | 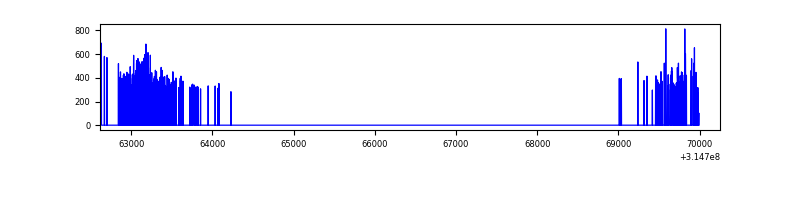 |
Top three noisy pixels from each quadrant. If the there are fewer than three noisy pixels in the level2.evt file, extra rows are filled as -1
| Pixel properties | Quadrant properties | ||||||
|---|---|---|---|---|---|---|---|
| Quadrant | DetID | PixID | Counts | Sigma | Mean | Median | Sigma |
| A | 13 | 254 | 487 | 52.55 | 33 | 32 | 8.7 |
| A | 13 | 252 | 350 | 36.73 | 33 | 32 | 8.7 |
| A | 0 | 226 | 291 | 29.91 | 33 | 32 | 8.7 |
| B | 4 | 173 | 1309 | 136.4 | 37 | 36 | 9.3 |
| B | 10 | 247 | 897 | 92.25 | 37 | 36 | 9.3 |
| B | 12 | 111 | 840 | 86.15 | 37 | 36 | 9.3 |
| C | 14 | 238 | 5405 | 542.93 | 34 | 34 | 9.9 |
| C | 0 | 239 | 432 | 40.23 | 34 | 34 | 9.9 |
| C | 13 | 61 | 211 | 17.89 | 34 | 34 | 9.9 |
| D | 1 | 52 | 7108 | 677.16 | 35 | 33 | 10.4 |
| D | 13 | 153 | 1891 | 177.83 | 35 | 33 | 10.4 |
| D | 2 | 234 | 1109 | 102.99 | 35 | 33 | 10.4 |
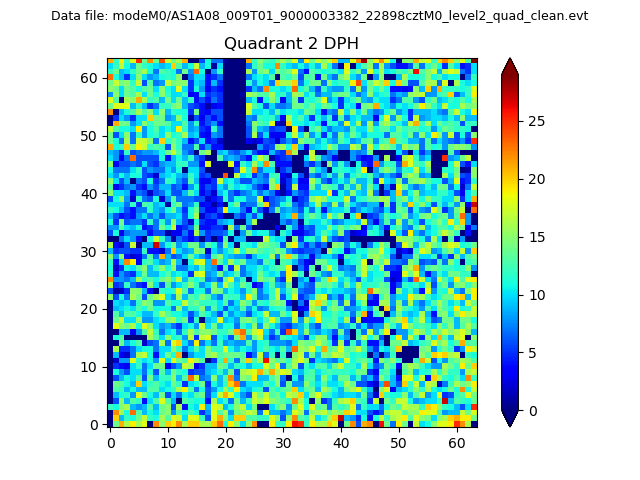
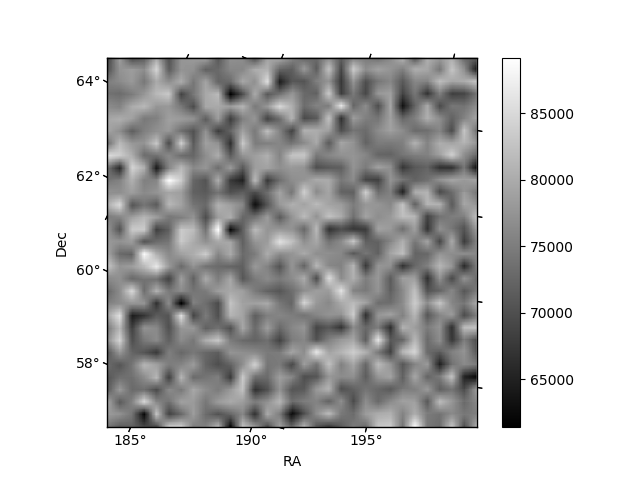
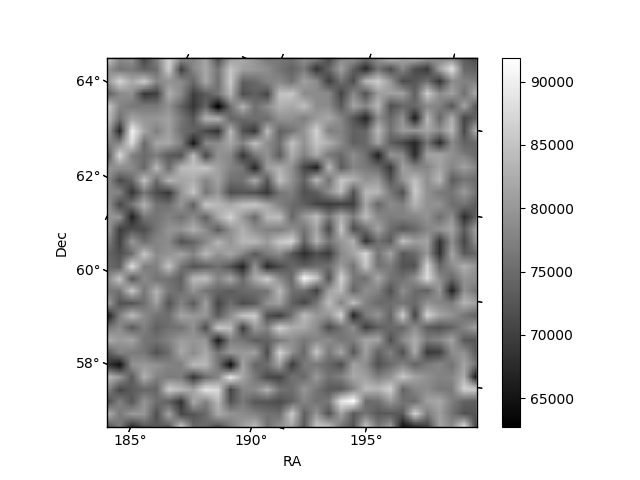
Histogram calculated using DETX and DETY for each event in the final _common_clean file
| Quadrant A | 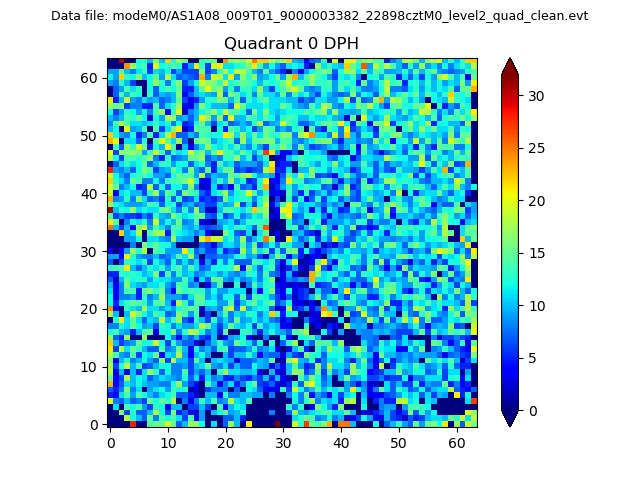 |
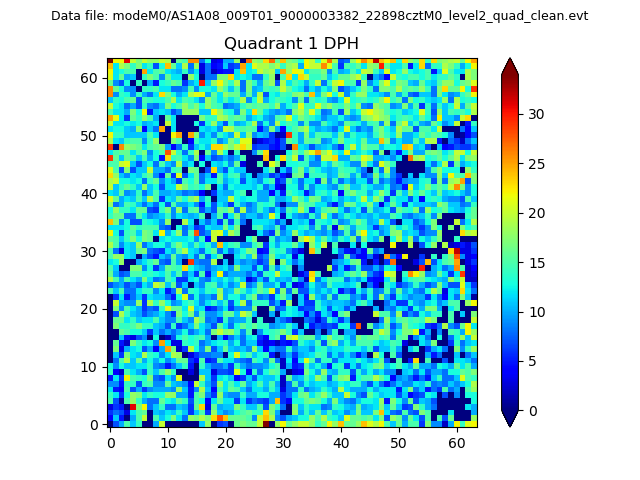 |
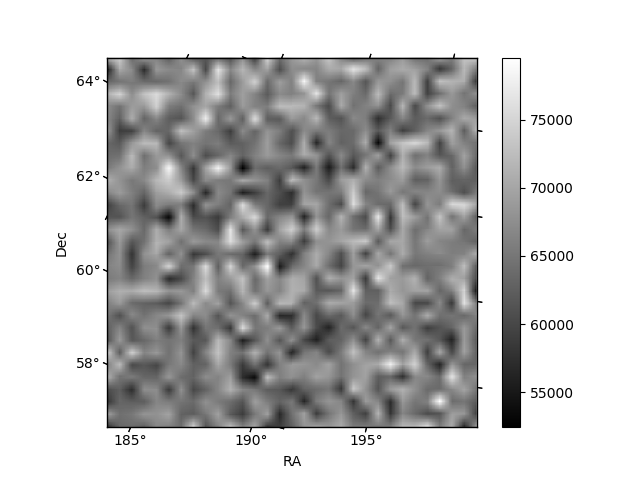
Quadrant B |
|---|---|---|---|
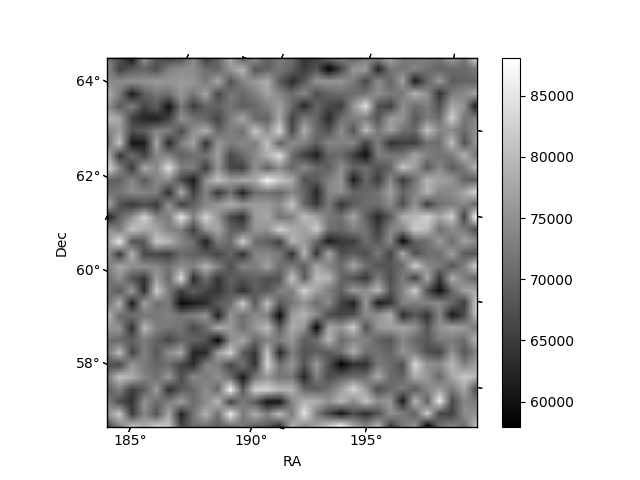
| Quadrant D | 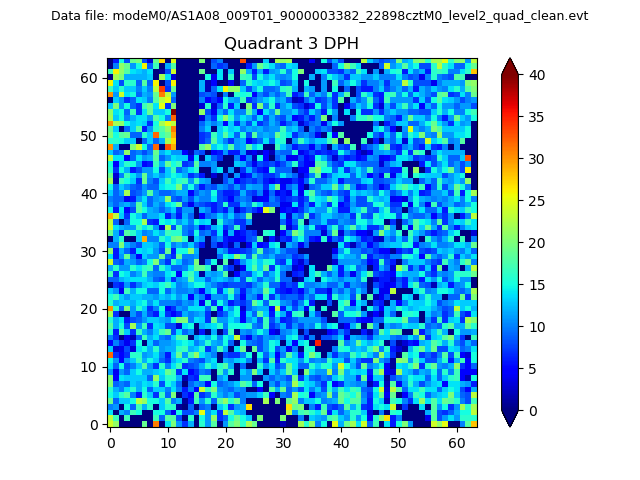 |
 |
Quadrant C |
| Plot type | Count rate plots | Images |
|---|---|---|
| Comparison with Poisson distribution Blue bars denote a histogram of data divided into 1 sec bins. Red curve is a Poisson curve with rate = median count rate of data. |
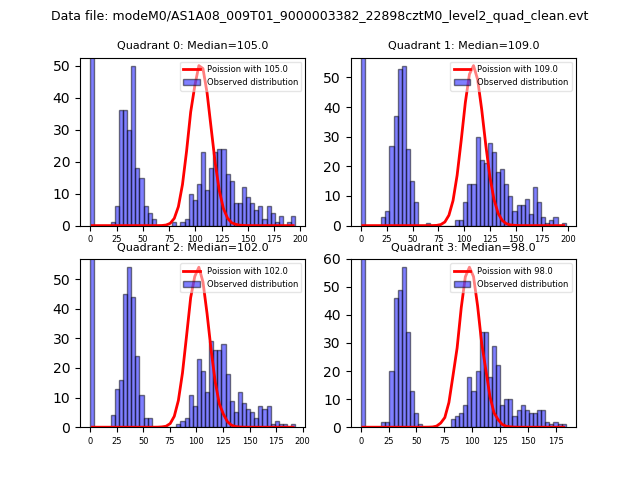 |
 |
| Quadrant-wise count rates Data is divided into 100 sec bins |
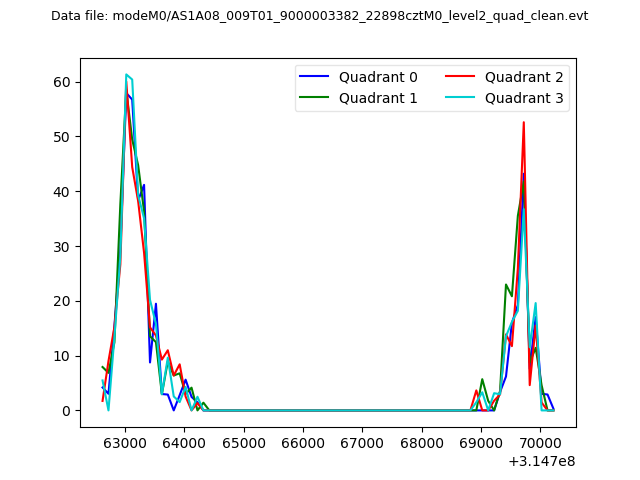 |
|
| Module-wise count rates for Quadrant A Data is divided into 100 sec bins |
 |
 |
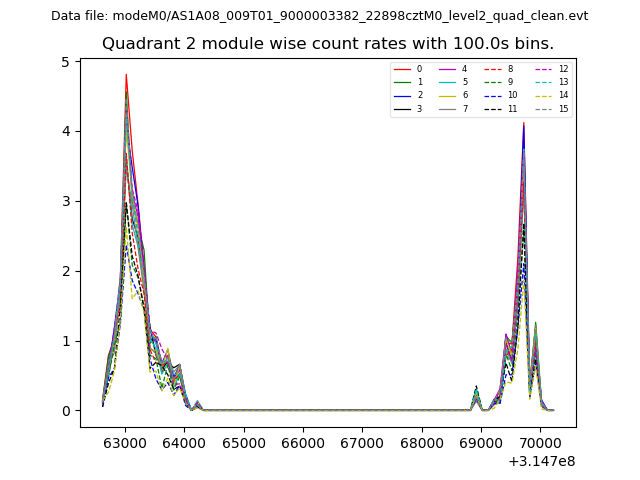
| Module-wise count rates for Quadrant B Data is divided into 100 sec bins |
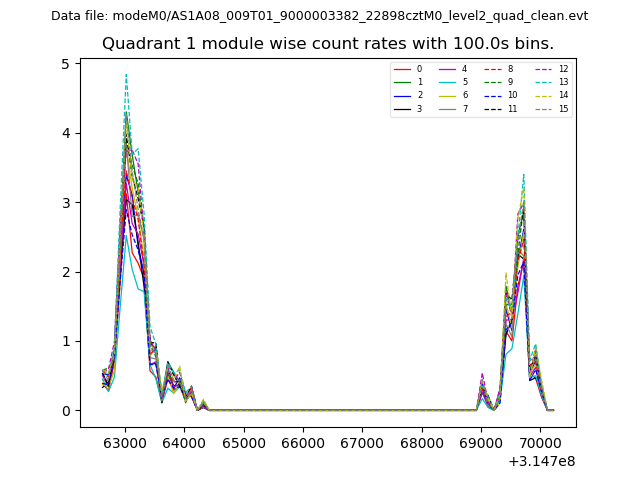 |
 |
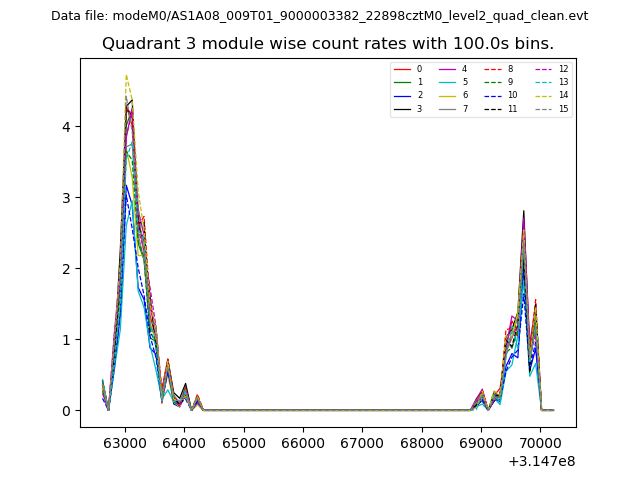
| Module-wise count rates for Quadrant C Data is divided into 100 sec bins |
 |
 |
| Module-wise count rates for Quadrant D Data is divided into 100 sec bins |
 |
 |
| Parameter | Plot |
|---|---|
| CZT HV Monitor | 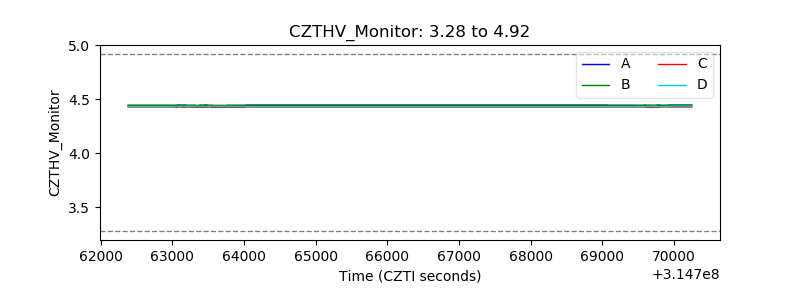 |
| D_VDD | 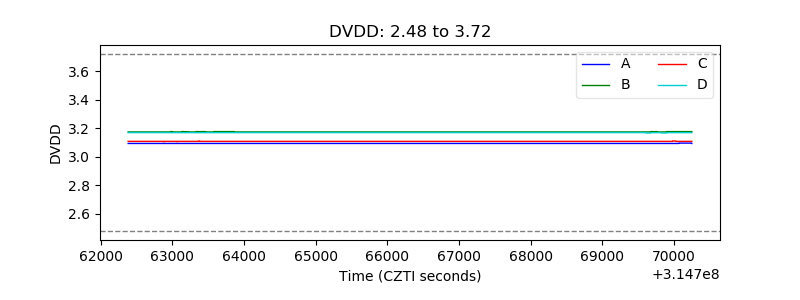 |
| Temperature 1 | 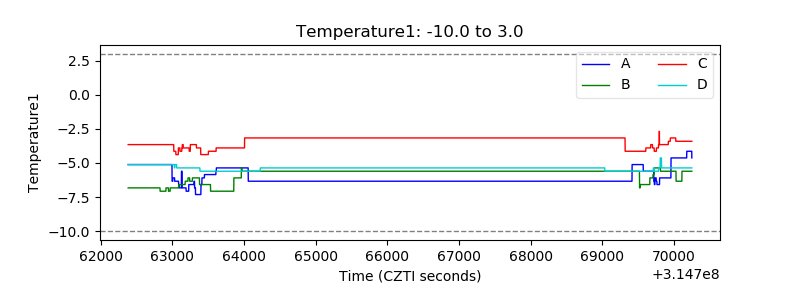 |
| Veto HV Monitor | 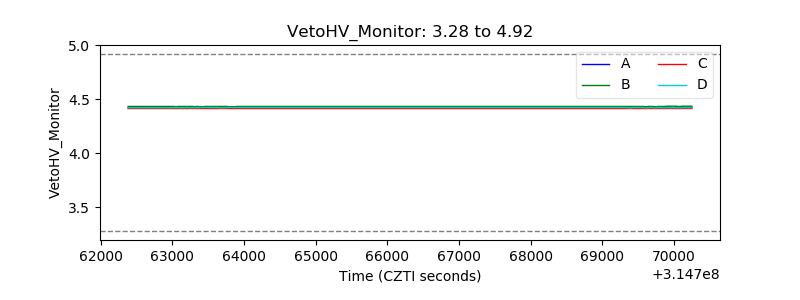 |
| Veto LLD | 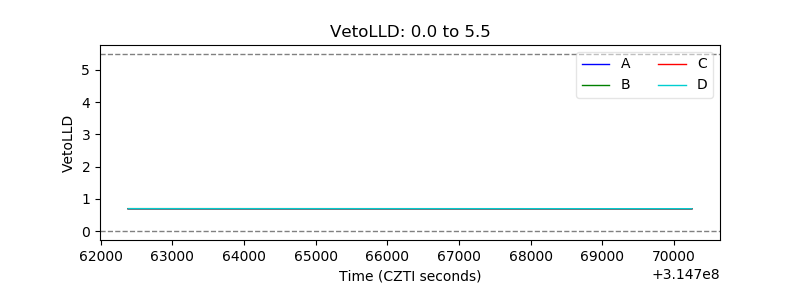 |
| Alpha Counter | 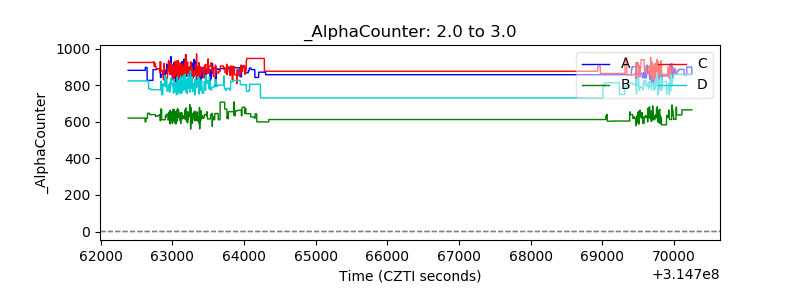 |
| _CPM_Rate | 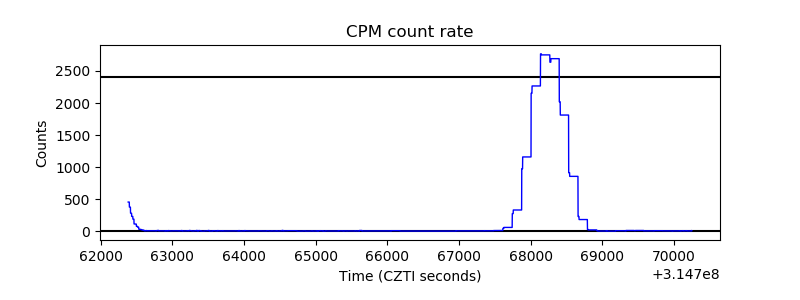 |
| CZT Counter | 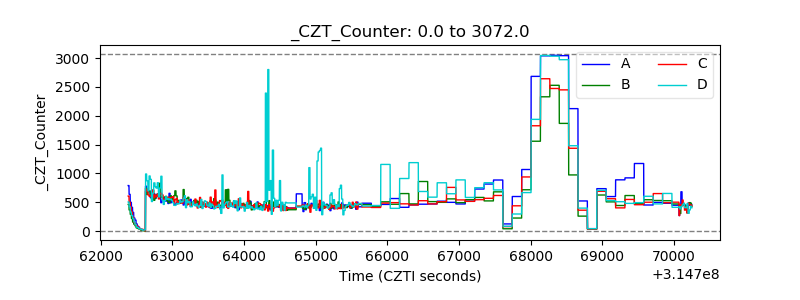 |
| +2.5 Volts monitor |  |
| +5 Volts monitor |  |
| _ROLL_ROT | 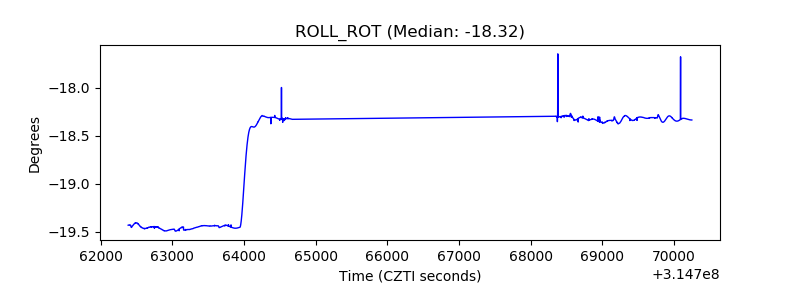 |
| _Roll_DEC | 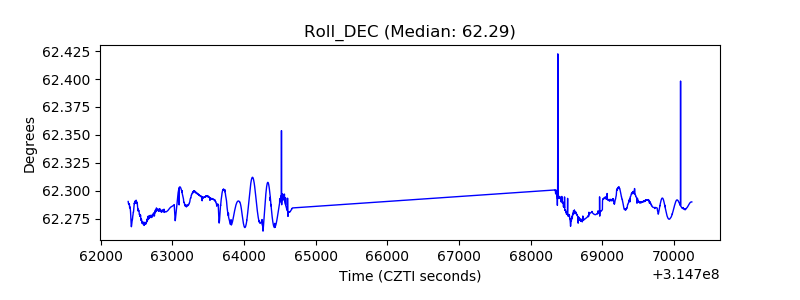 |
| _Roll_RA | 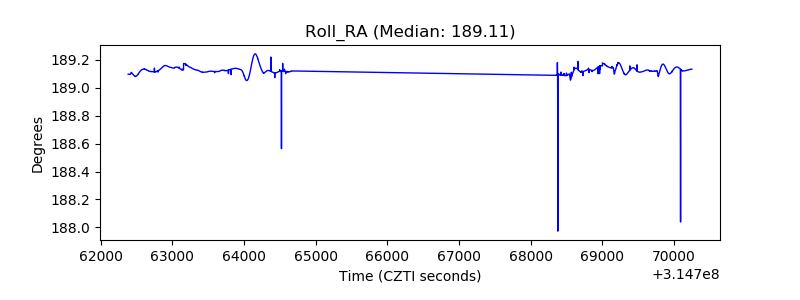 |
| Veto Counter | 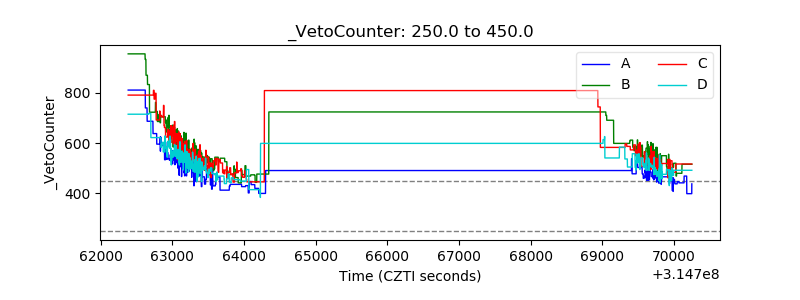 |