| Param | Original file | Final file |
|---|---|---|
| Filename | modeM0/AS1A08_009T01_9000003382_22900cztM0_level2.evt | modeM0/AS1A08_009T01_9000003382_22900cztM0_level2_quad_clean.evt |
| Size (bytes) | 458,493,120 | 98,069,760 |
| Size | 437.3 MB | 93.5 MB |
| Events in quadrant A | 2,990,831 | 652,441 |
| Events in quadrant B | 3,064,504 | 664,268 |
| Events in quadrant C | 3,007,481 | 620,443 |
| Events in quadrant D | 4,402,311 | 600,903 |
| Mode M9 | |||
|---|---|---|---|
| Quadrant | BADHDUFLAG | Total packets | Discarded packets |
| A | 0 | 12 | 0 |
| B | 0 | 12 | 0 |
| C | 0 | 12 | 0 |
| D | 0 | 12 | 0 |
| Mode M0 | |||
|---|---|---|---|
| Quadrant | BADHDUFLAG | Total packets | Discarded packets |
| A | 0 | 12665 | 1 |
| B | 0 | 12891 | 1 |
| C | 0 | 12883 | 1 |
| D | 0 | 17120 | 1 |
| Mode SS | |||
|---|---|---|---|
| Quadrant | BADHDUFLAG | Total packets | Discarded packets |
| A | 0 | 126 | 0 |
| B | 0 | 126 | 0 |
| C | 0 | 126 | 0 |
| D | 0 | 126 | 0 |
| Quadrant | Total seconds | Saturated seconds | Saturation percentage |
|---|---|---|---|
| A | 6186 | 47 | 0.759780% |
| B | 6186 | 66 | 1.066925% |
| C | 6186 | 72 | 1.163919% |
| D | 6187 | 310 | 5.010506% |
Noise dominated data is calculated using 1-second bins in cleaned event files. If a bin has >2000 counts, and if more than 50% of those come from <1% of pixels, then it is considered to be noise-dominated and hence unusable.
| Quadrant | # 1 sec bins | Bins with >0 counts | Bins with >2000 counts | High rate bins dominated by noise | Noise dominated (total time) | Noise dominated (detector-on time) | Marked lightcurve |
|---|---|---|---|---|---|---|---|
| A | 7421 | 6187 | 0 | 0 | 0.00% | 0.00% | 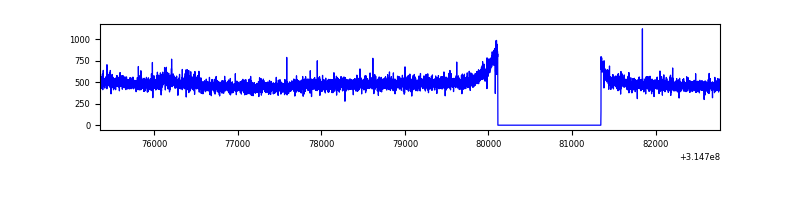 |
| B | 7421 | 6187 | 2 | 2 | 0.03% | 0.03% | 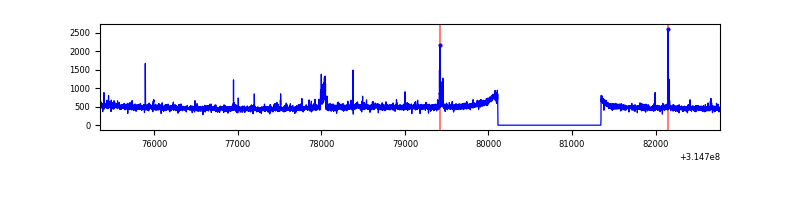 |
| C | 7421 | 6187 | 18 | 18 | 0.24% | 0.29% | 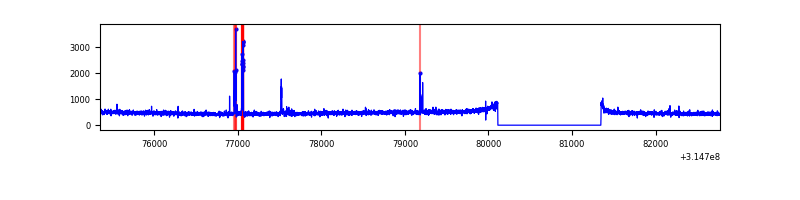 |
| D | 7422 | 6188 | 230 | 230 | 3.10% | 3.72% | 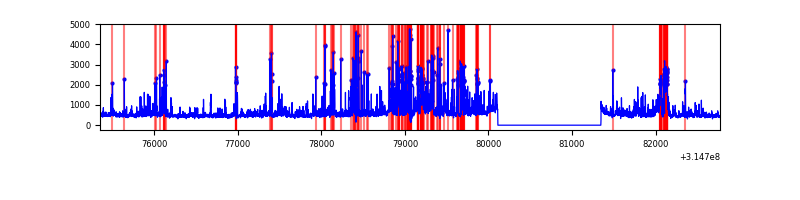 |
Top three noisy pixels from each quadrant. If the there are fewer than three noisy pixels in the level2.evt file, extra rows are filled as -1
| Pixel properties | Quadrant properties | ||||||
|---|---|---|---|---|---|---|---|
| Quadrant | DetID | PixID | Counts | Sigma | Mean | Median | Sigma |
| A | 0 | 23 | 17673 | 110.16 | 770 | 754 | 153.6 |
| A | 13 | 254 | 9913 | 59.64 | 770 | 754 | 153.6 |
| A | 0 | 226 | 7570 | 44.38 | 770 | 754 | 153.6 |
| B | 0 | 190 | 36558 | 255.1 | 759 | 741 | 140.4 |
| B | 0 | 228 | 19979 | 137.02 | 759 | 741 | 140.4 |
| B | 12 | 111 | 16768 | 114.15 | 759 | 741 | 140.4 |
| C | 14 | 238 | 117073 | 713.25 | 717 | 722 | 163.1 |
| C | 9 | 54 | 89885 | 546.58 | 717 | 722 | 163.1 |
| C | 0 | 10 | 6102 | 32.98 | 717 | 722 | 163.1 |
| D | 1 | 52 | 1076495 | 6164.41 | 723 | 700 | 174.5 |
| D | 13 | 153 | 402297 | 2301.19 | 723 | 700 | 174.5 |
| D | 10 | 230 | 49907 | 281.96 | 723 | 700 | 174.5 |
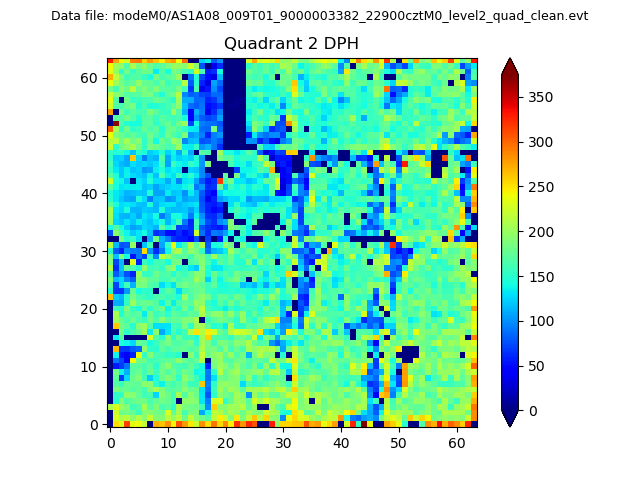
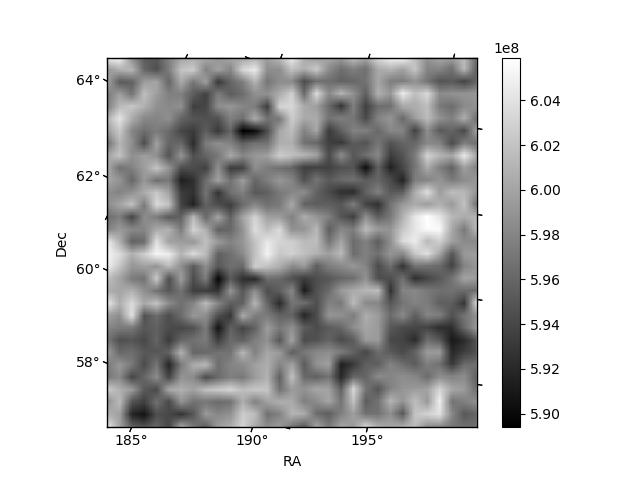
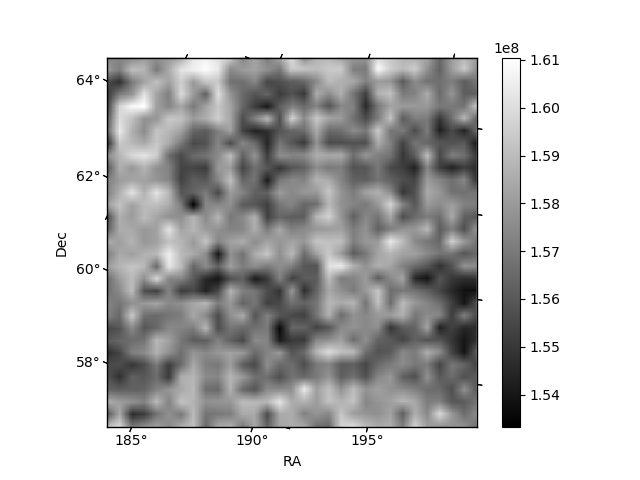
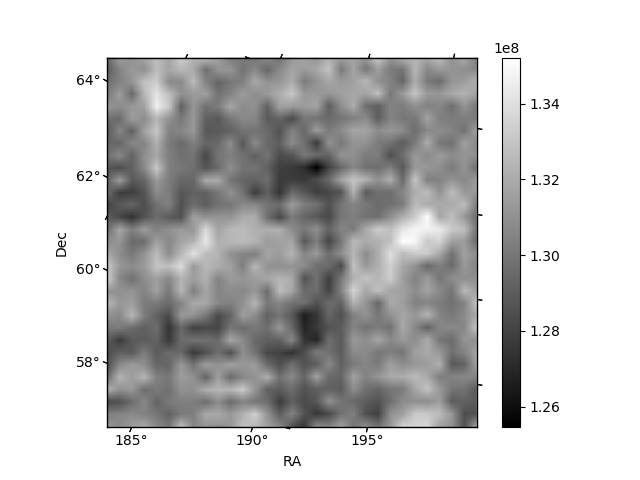
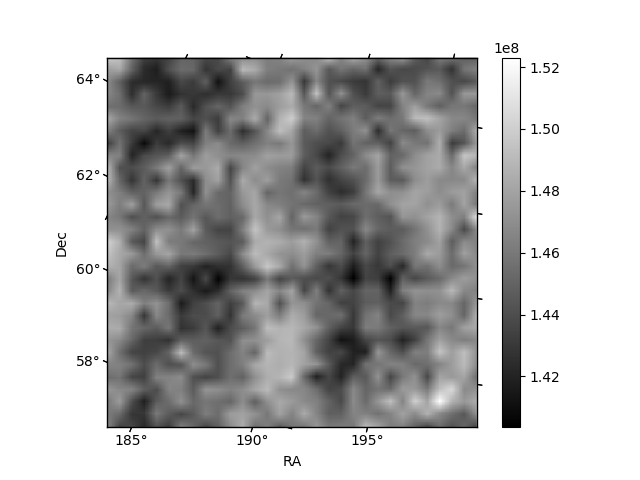
Histogram calculated using DETX and DETY for each event in the final _common_clean file
| Quadrant A | 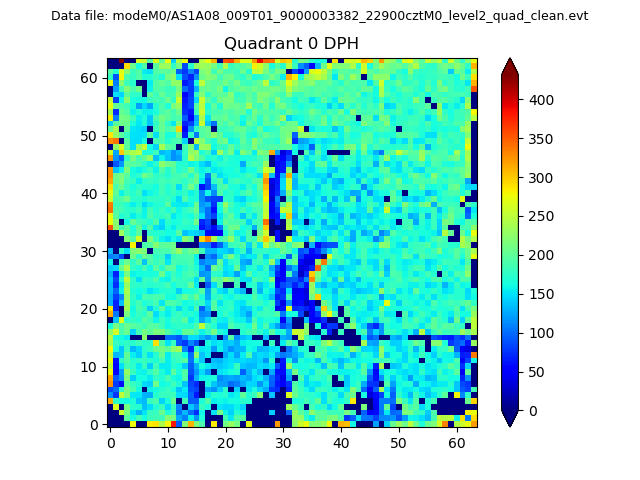 |
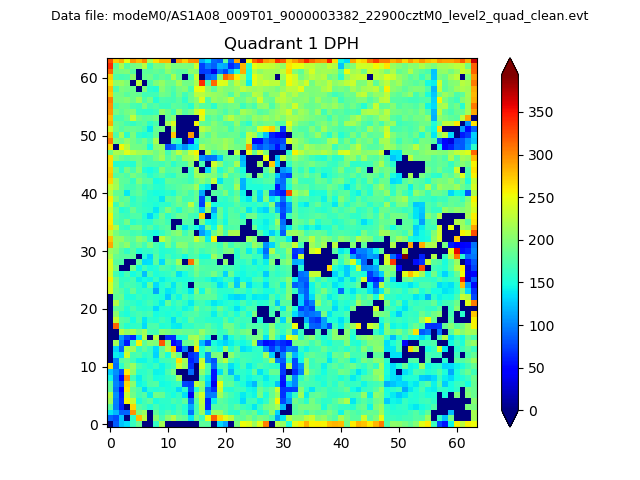 |
Quadrant B |
|---|---|---|---|
| Quadrant D | 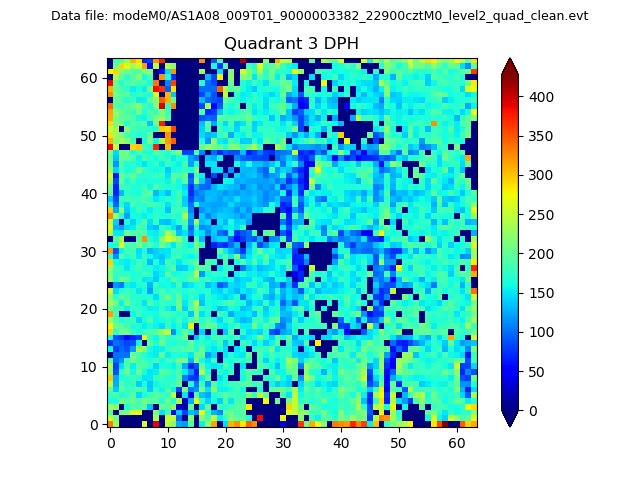 |
 |
Quadrant C |
| Plot type | Count rate plots | Images |
|---|---|---|
| Comparison with Poisson distribution Blue bars denote a histogram of data divided into 1 sec bins. Red curve is a Poisson curve with rate = median count rate of data. |
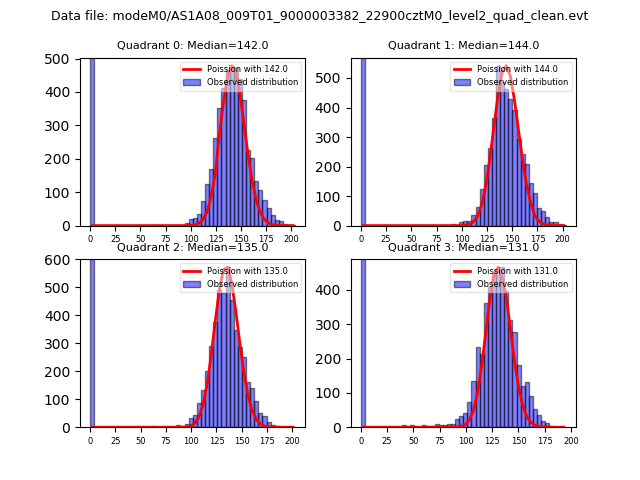 |
 |
| Quadrant-wise count rates Data is divided into 100 sec bins |
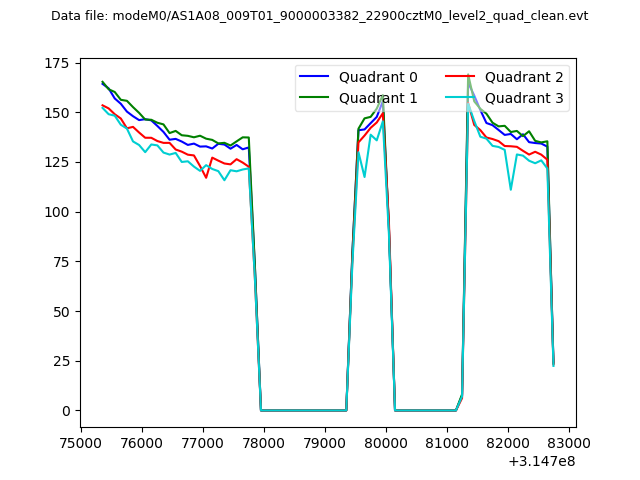 |
|
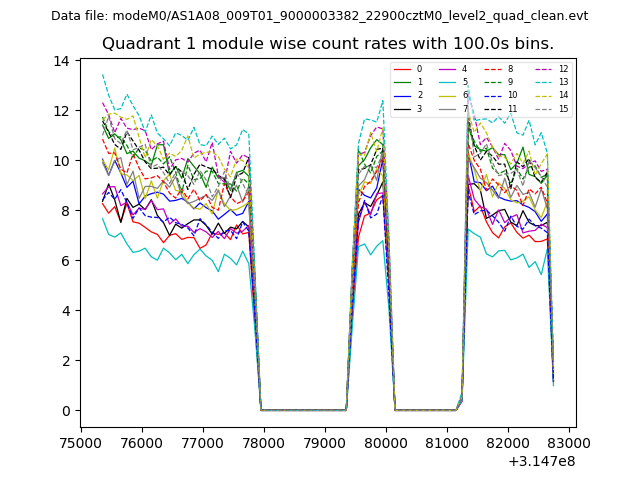
| Module-wise count rates for Quadrant A Data is divided into 100 sec bins |
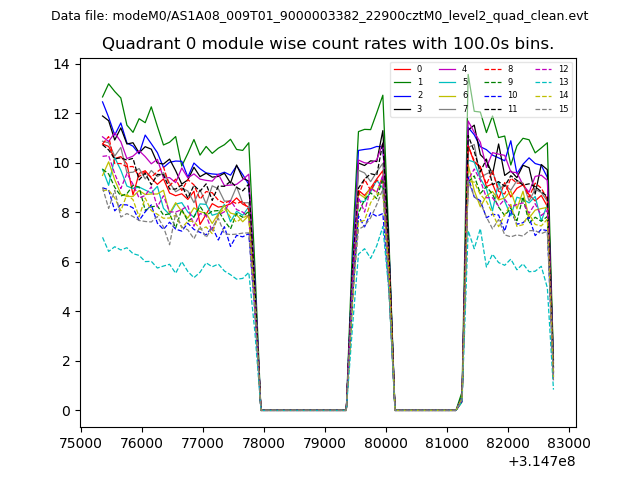 |
 |
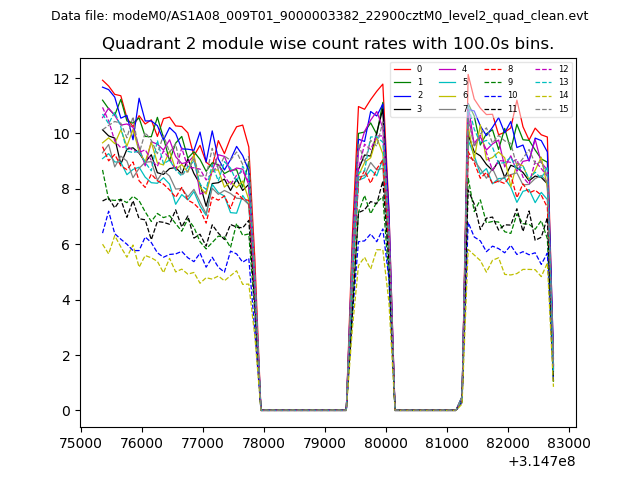
| Module-wise count rates for Quadrant B Data is divided into 100 sec bins |
 |
 |
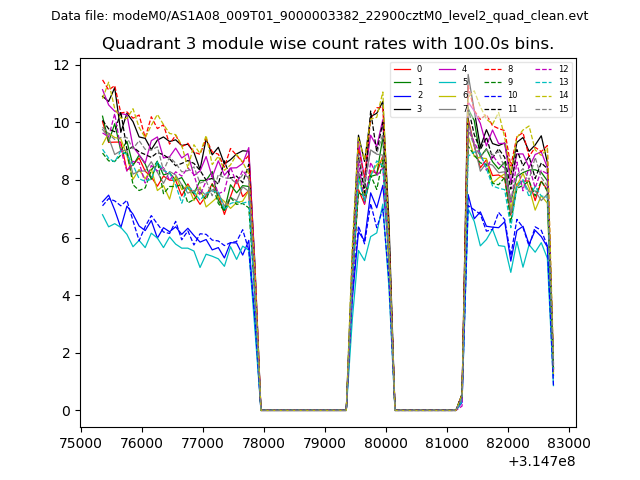
| Module-wise count rates for Quadrant C Data is divided into 100 sec bins |
 |
 |
| Module-wise count rates for Quadrant D Data is divided into 100 sec bins |
 |
 |
| Parameter | Plot |
|---|---|
| CZT HV Monitor | 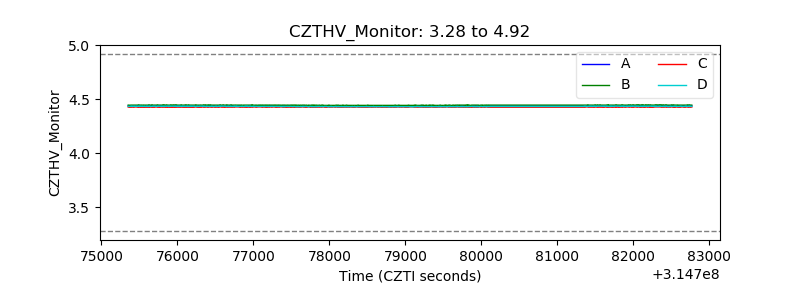 |
| D_VDD | 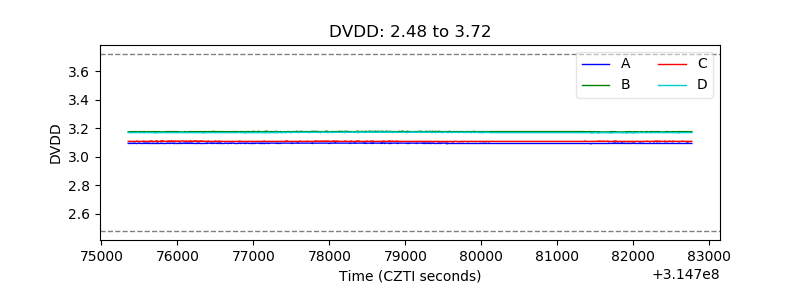 |
| Temperature 1 | 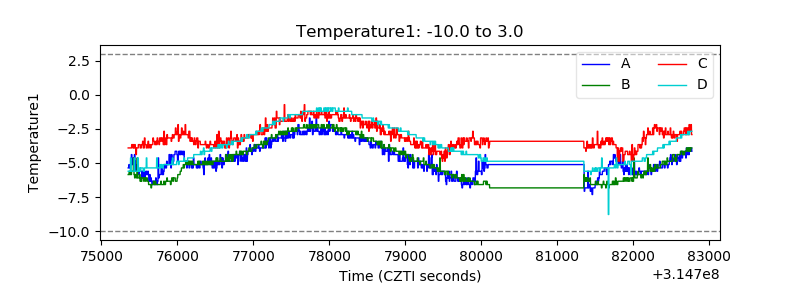 |
| Veto HV Monitor | 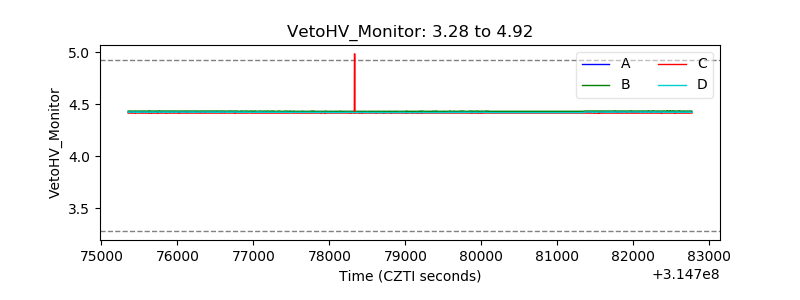 |
| Veto LLD | 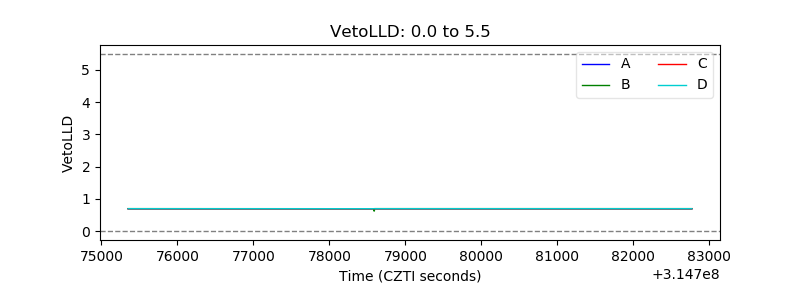 |
| Alpha Counter | 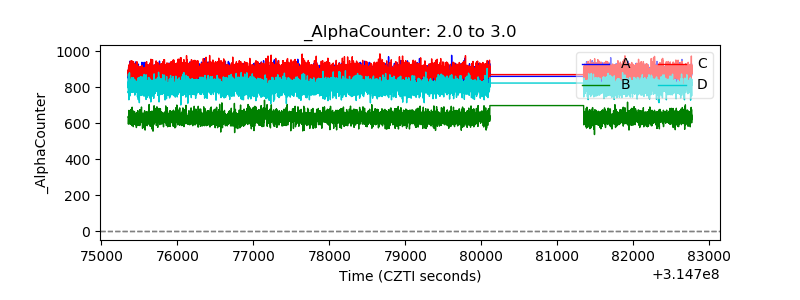 |
| _CPM_Rate | 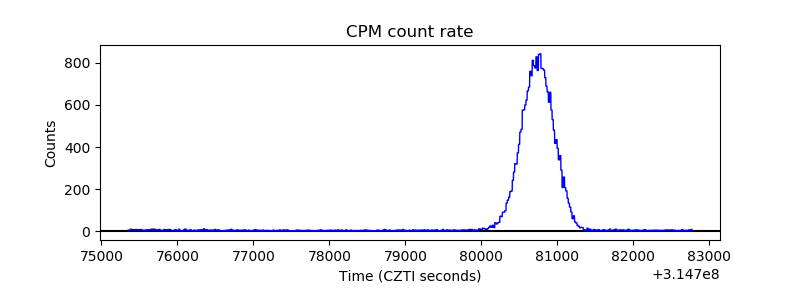 |
| CZT Counter | 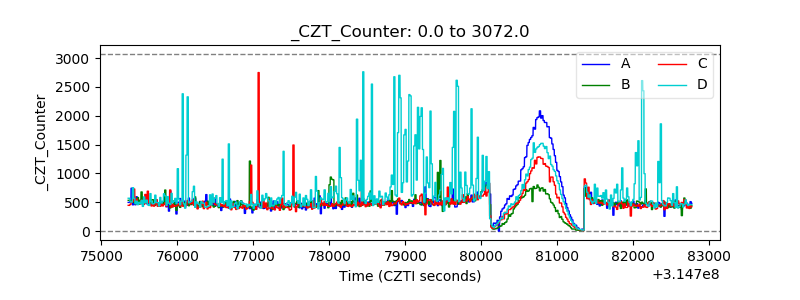 |
| +2.5 Volts monitor |  |
| +5 Volts monitor | 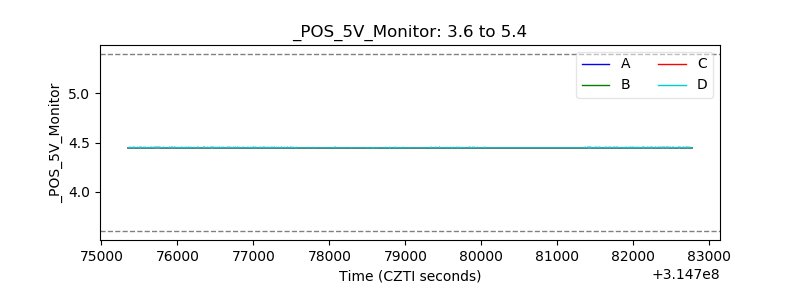 |
| _ROLL_ROT | 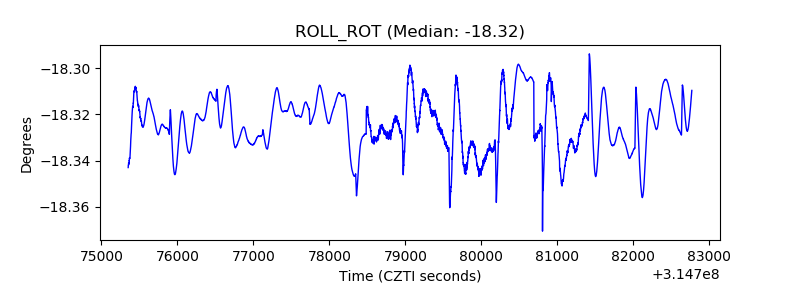 |
| _Roll_DEC |  |
| _Roll_RA | 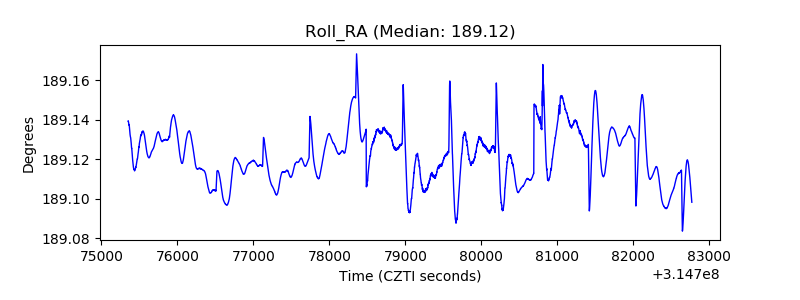 |
| Veto Counter | 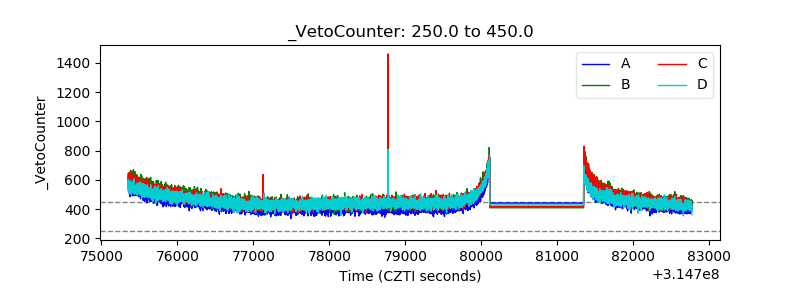 |