| Param | Original file | Final file |
|---|---|---|
| Filename | modeM0/AS1A08_009T01_9000003382_22902cztM0_level2.evt | modeM0/AS1A08_009T01_9000003382_22902cztM0_level2_quad_clean.evt |
| Size (bytes) | 603,239,040 | 105,690,240 |
| Size | 575.3 MB | 100.8 MB |
| Events in quadrant A | 3,282,000 | 709,401 |
| Events in quadrant B | 3,380,109 | 717,586 |
| Events in quadrant C | 3,251,927 | 684,338 |
| Events in quadrant D | 7,874,551 | 595,651 |
| Mode M9 | |||
|---|---|---|---|
| Quadrant | BADHDUFLAG | Total packets | Discarded packets |
| A | 0 | 6 | 0 |
| B | 0 | 7 | 0 |
| C | 0 | 7 | 0 |
| D | 0 | 7 | 0 |
| Mode M0 | |||
|---|---|---|---|
| Quadrant | BADHDUFLAG | Total packets | Discarded packets |
| A | 0 | 14470 | 2 |
| B | 0 | 14649 | 2 |
| C | 0 | 14408 | 2 |
| D | 0 | 28239 | 2 |
| Mode SS | |||
|---|---|---|---|
| Quadrant | BADHDUFLAG | Total packets | Discarded packets |
| A | 0 | 144 | 0 |
| B | 0 | 144 | 0 |
| C | 0 | 144 | 0 |
| D | 0 | 144 | 0 |
| Quadrant | Total seconds | Saturated seconds | Saturation percentage |
|---|---|---|---|
| A | 7082 | 111 | 1.567354% |
| B | 7082 | 116 | 1.637955% |
| C | 7082 | 125 | 1.765038% |
| D | 7082 | 1398 | 19.740186% |
Noise dominated data is calculated using 1-second bins in cleaned event files. If a bin has >2000 counts, and if more than 50% of those come from <1% of pixels, then it is considered to be noise-dominated and hence unusable.
| Quadrant | # 1 sec bins | Bins with >0 counts | Bins with >2000 counts | High rate bins dominated by noise | Noise dominated (total time) | Noise dominated (detector-on time) | Marked lightcurve |
|---|---|---|---|---|---|---|---|
| A | 7672 | 7083 | 0 | 0 | 0.00% | 0.00% | 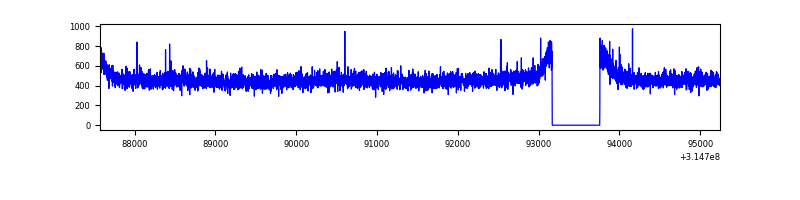 |
| B | 7672 | 7083 | 3 | 3 | 0.04% | 0.04% | 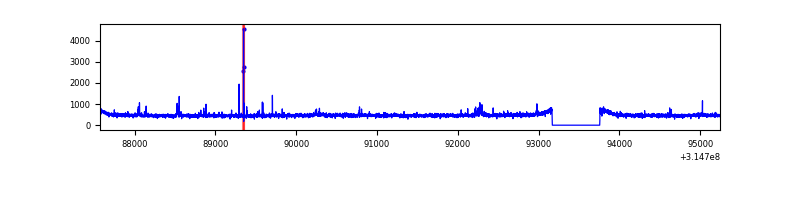 |
| C | 7672 | 7083 | 0 | 0 | 0.00% | 0.00% | 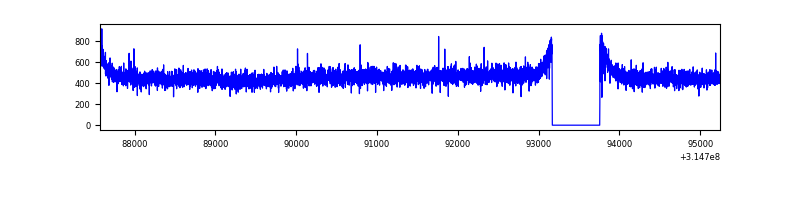 |
| D | 7672 | 7083 | 1133 | 1133 | 14.77% | 16.00% | 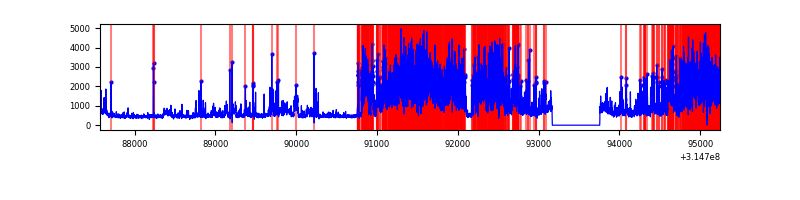 |
Top three noisy pixels from each quadrant. If the there are fewer than three noisy pixels in the level2.evt file, extra rows are filled as -1
| Pixel properties | Quadrant properties | ||||||
|---|---|---|---|---|---|---|---|
| Quadrant | DetID | PixID | Counts | Sigma | Mean | Median | Sigma |
| A | 13 | 254 | 11937 | 65.21 | 848 | 829 | 170.3 |
| A | 0 | 226 | 7532 | 39.35 | 848 | 829 | 170.3 |
| A | 3 | 137 | 7131 | 37.0 | 848 | 829 | 170.3 |
| B | 4 | 216 | 24400 | 149.66 | 837 | 815 | 157.6 |
| B | 12 | 111 | 19506 | 118.6 | 837 | 815 | 157.6 |
| B | 0 | 189 | 17853 | 108.11 | 837 | 815 | 157.6 |
| C | 14 | 238 | 127706 | 683.21 | 801 | 803 | 185.7 |
| C | 13 | 61 | 5575 | 25.69 | 801 | 803 | 185.7 |
| C | 7 | 247 | 4027 | 17.36 | 801 | 803 | 185.7 |
| D | 1 | 239 | 4426598 | 24222.55 | 756 | 733 | 182.7 |
| D | 1 | 52 | 278695 | 1521.27 | 756 | 733 | 182.7 |
| D | 12 | 227 | 140083 | 762.66 | 756 | 733 | 182.7 |
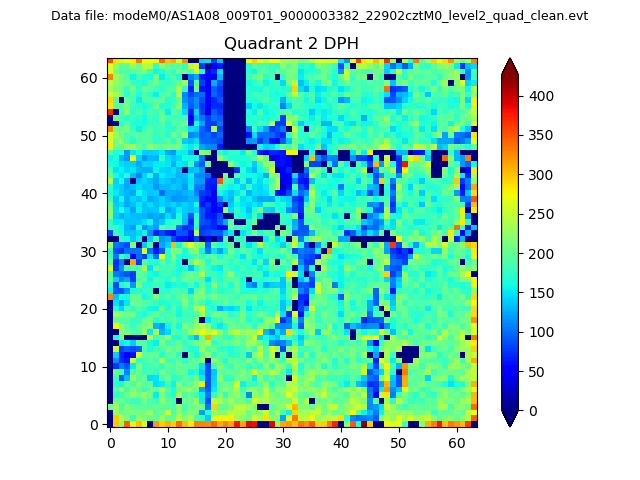
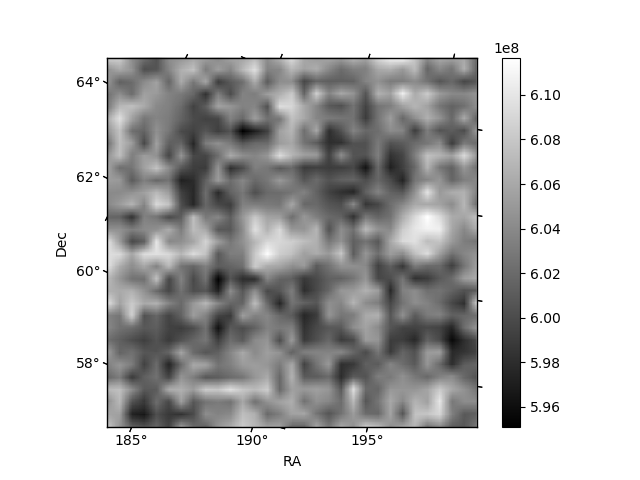
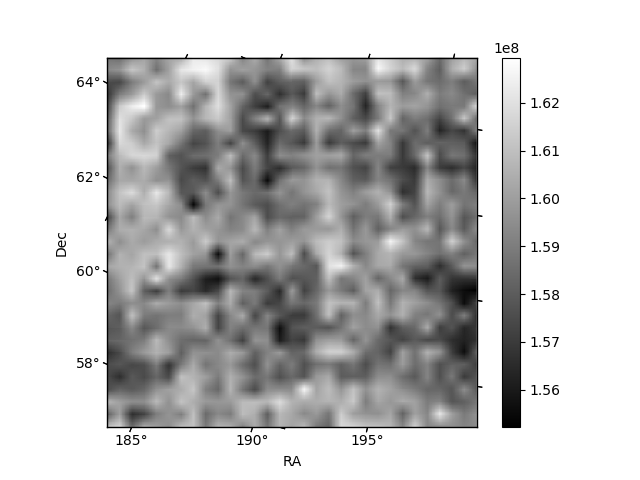
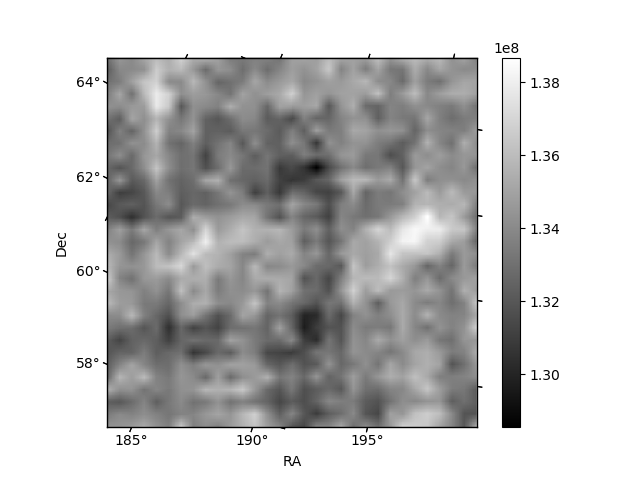
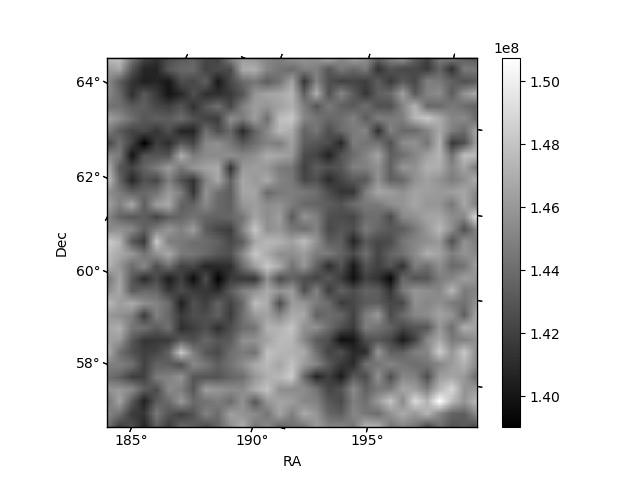
Histogram calculated using DETX and DETY for each event in the final _common_clean file
| Quadrant A | 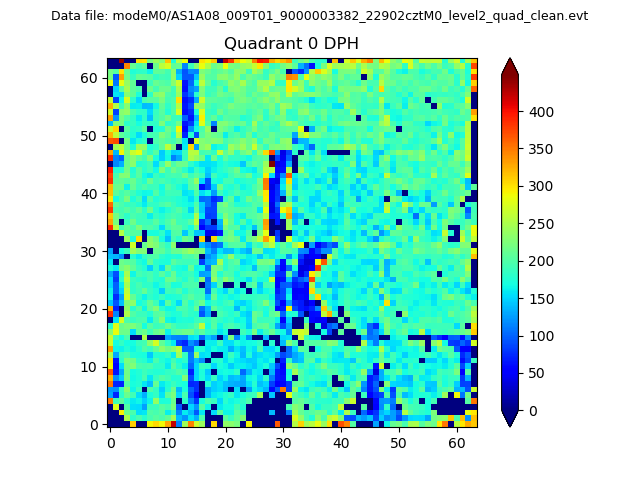 |
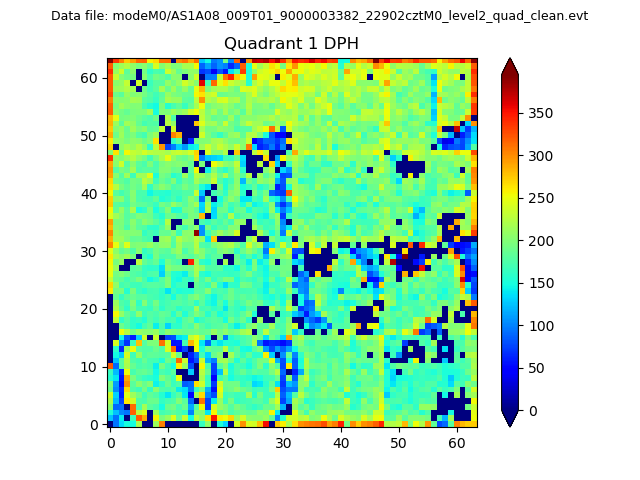 |
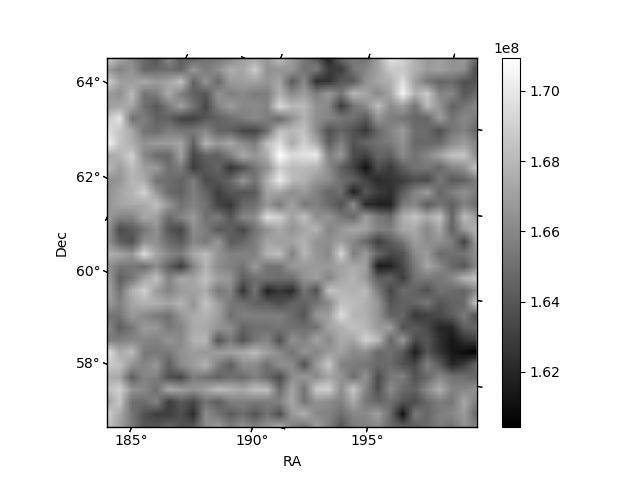
Quadrant B |
|---|---|---|---|
| Quadrant D | 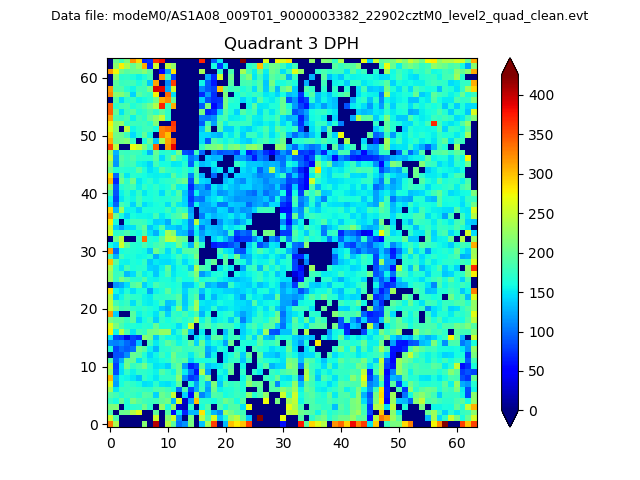 |
 |
Quadrant C |
| Plot type | Count rate plots | Images |
|---|---|---|
| Comparison with Poisson distribution Blue bars denote a histogram of data divided into 1 sec bins. Red curve is a Poisson curve with rate = median count rate of data. |
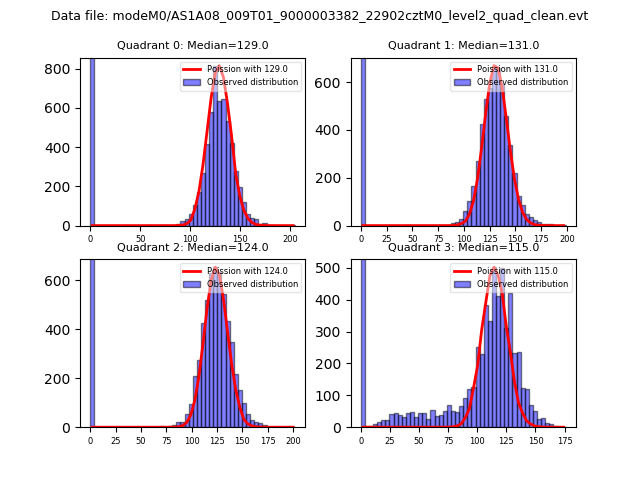 |
 |
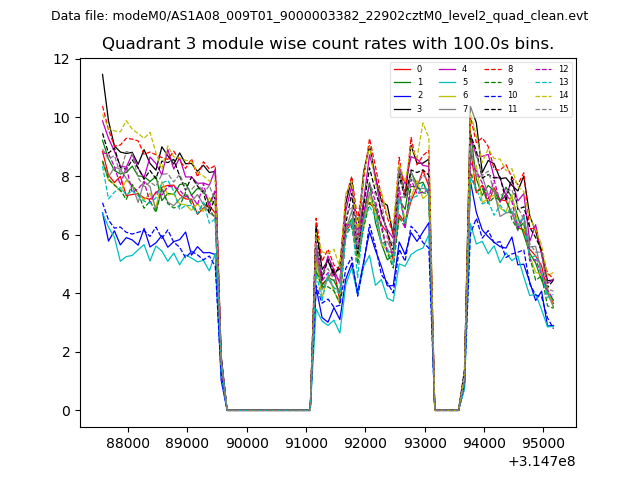
| Quadrant-wise count rates Data is divided into 100 sec bins |
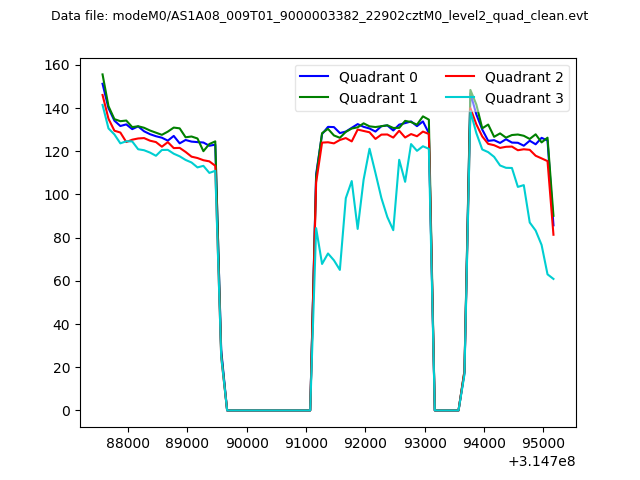 |
|
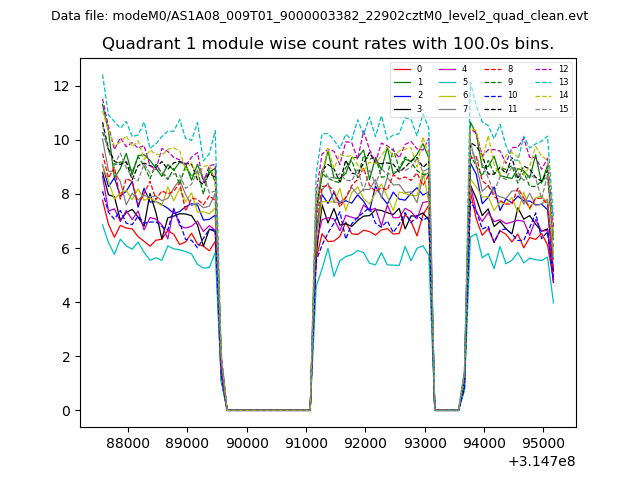
| Module-wise count rates for Quadrant A Data is divided into 100 sec bins |
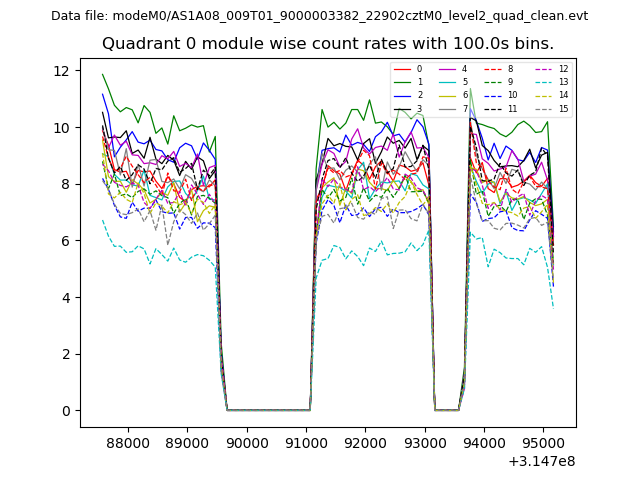 |
 |
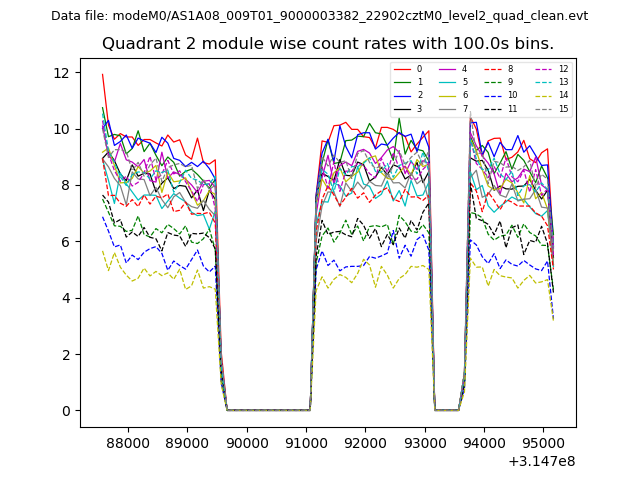
| Module-wise count rates for Quadrant B Data is divided into 100 sec bins |
 |
 |
| Module-wise count rates for Quadrant C Data is divided into 100 sec bins |
 |
 |
| Module-wise count rates for Quadrant D Data is divided into 100 sec bins |
 |
 |
| Parameter | Plot |
|---|---|
| CZT HV Monitor | 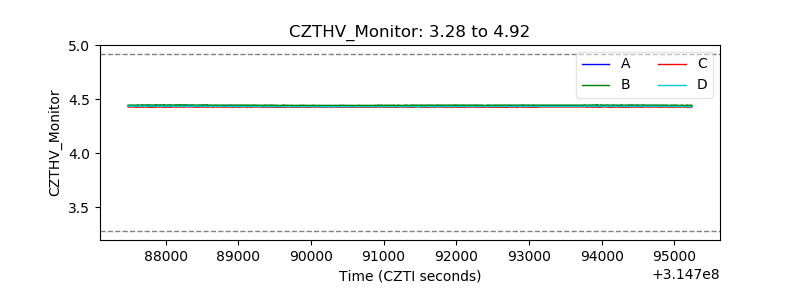 |
| D_VDD | 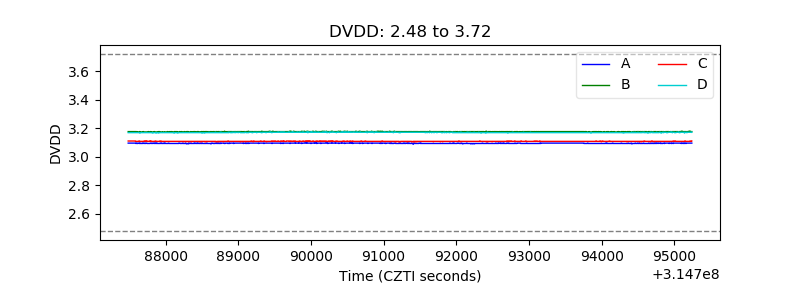 |
| Temperature 1 |  |
| Veto HV Monitor | 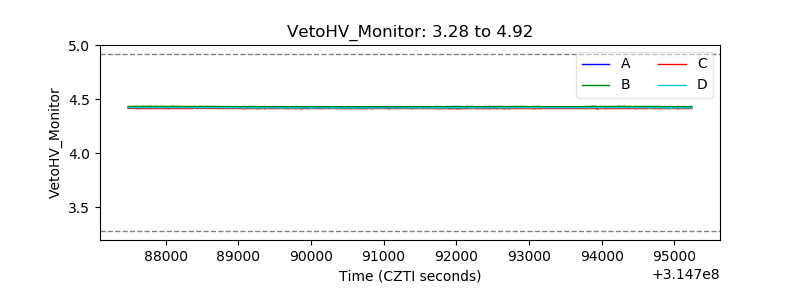 |
| Veto LLD | 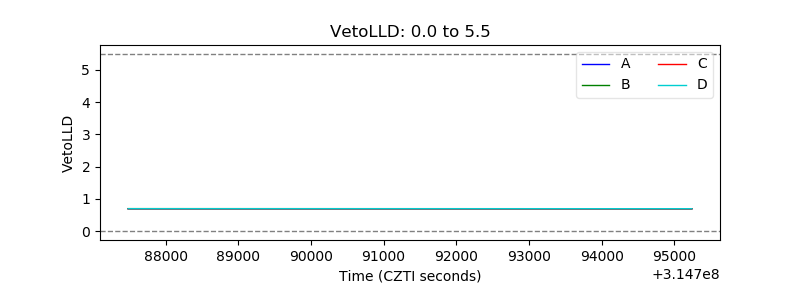 |
| Alpha Counter | 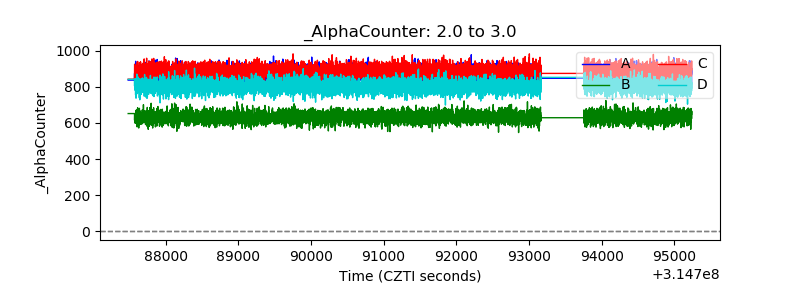 |
| _CPM_Rate | 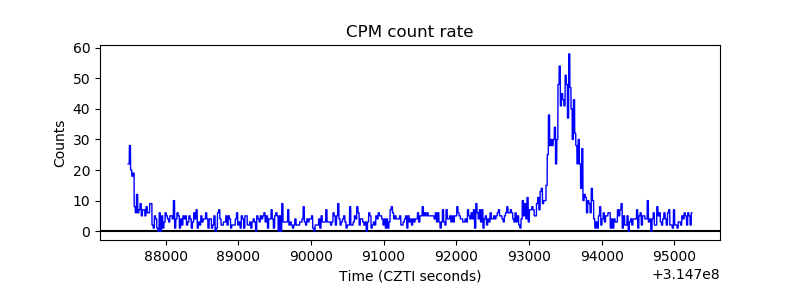 |
| CZT Counter | 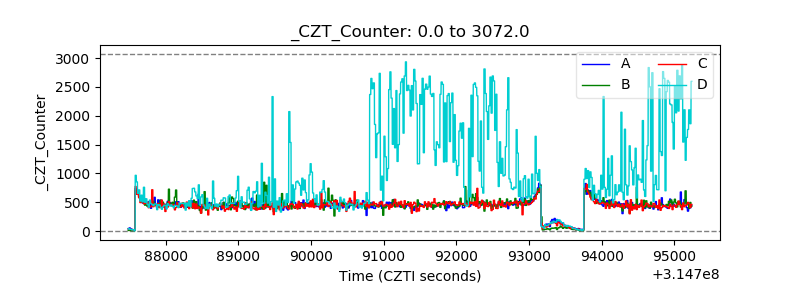 |
| +2.5 Volts monitor |  |
| +5 Volts monitor | 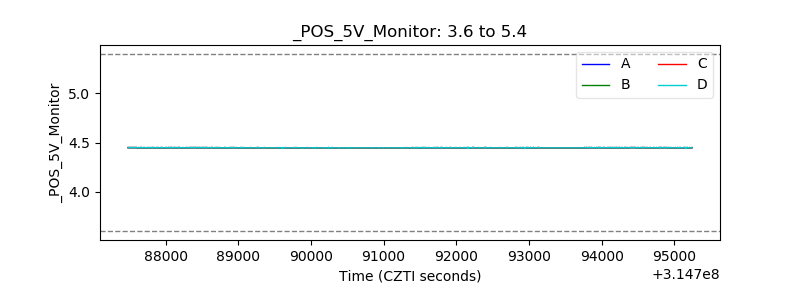 |
| _ROLL_ROT | 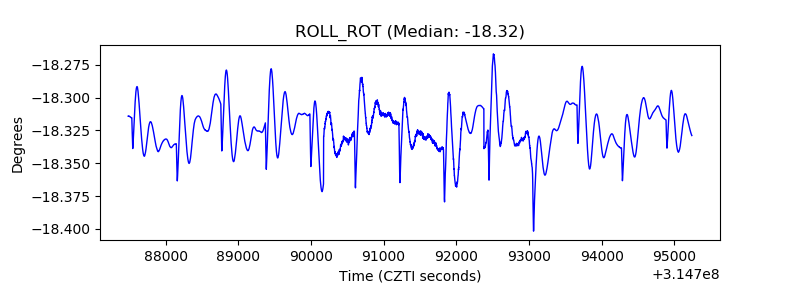 |
| _Roll_DEC | 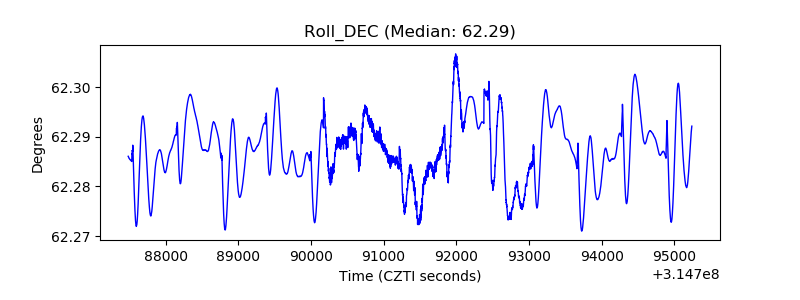 |
| _Roll_RA |  |
| Veto Counter | 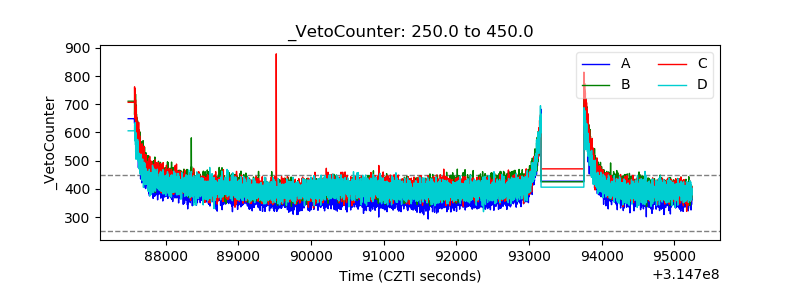 |