| Param | Original file | Final file |
|---|---|---|
| Filename | modeM0/AS1A08_009T01_9000003382_22903cztM0_level2.evt | modeM0/AS1A08_009T01_9000003382_22903cztM0_level2_quad_clean.evt |
| Size (bytes) | 681,465,600 | 97,770,240 |
| Size | 649.9 MB | 93.2 MB |
| Events in quadrant A | 3,233,219 | 653,936 |
| Events in quadrant B | 3,382,282 | 660,750 |
| Events in quadrant C | 3,202,780 | 630,782 |
| Events in quadrant D | 10,345,464 | 526,334 |
| Mode M9 | |||
|---|---|---|---|
| Quadrant | BADHDUFLAG | Total packets | Discarded packets |
| A | 0 | 3 | 0 |
| B | 0 | 3 | 0 |
| C | 0 | 3 | 0 |
| D | 0 | 3 | 0 |
| Mode M0 | |||
|---|---|---|---|
| Quadrant | BADHDUFLAG | Total packets | Discarded packets |
| A | 0 | 14326 | 1 |
| B | 0 | 14649 | 1 |
| C | 0 | 14277 | 1 |
| D | 0 | 35670 | 1 |
| Mode SS | |||
|---|---|---|---|
| Quadrant | BADHDUFLAG | Total packets | Discarded packets |
| A | 0 | 142 | 0 |
| B | 0 | 142 | 0 |
| C | 0 | 142 | 0 |
| D | 0 | 142 | 0 |
| Quadrant | Total seconds | Saturated seconds | Saturation percentage |
|---|---|---|---|
| A | 7008 | 137 | 1.954909% |
| B | 7009 | 176 | 2.511057% |
| C | 7009 | 162 | 2.311314% |
| D | 7008 | 1997 | 28.496005% |
Noise dominated data is calculated using 1-second bins in cleaned event files. If a bin has >2000 counts, and if more than 50% of those come from <1% of pixels, then it is considered to be noise-dominated and hence unusable.
| Quadrant | # 1 sec bins | Bins with >0 counts | Bins with >2000 counts | High rate bins dominated by noise | Noise dominated (total time) | Noise dominated (detector-on time) | Marked lightcurve |
|---|---|---|---|---|---|---|---|
| A | 7258 | 7009 | 0 | 0 | 0.00% | 0.00% | 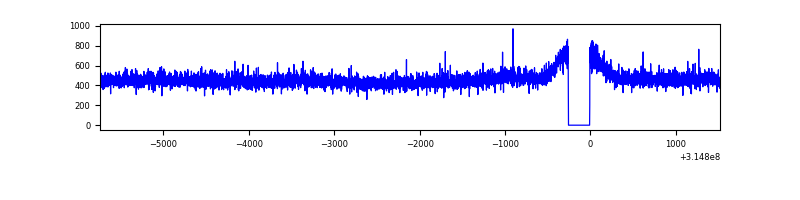 |
| B | 7259 | 7010 | 10 | 10 | 0.14% | 0.14% | 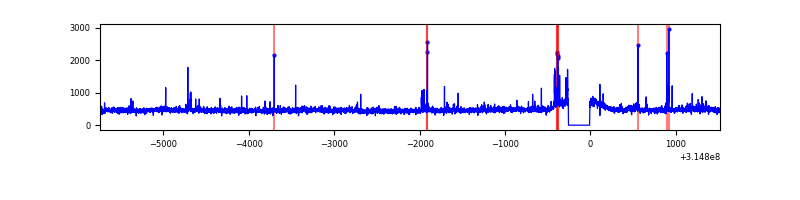 |
| C | 7259 | 7010 | 0 | 0 | 0.00% | 0.00% | 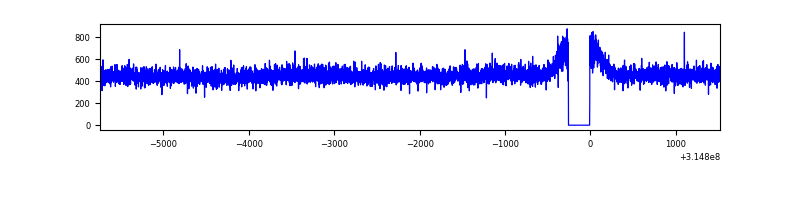 |
| D | 7258 | 7009 | 1660 | 1660 | 22.87% | 23.68% | 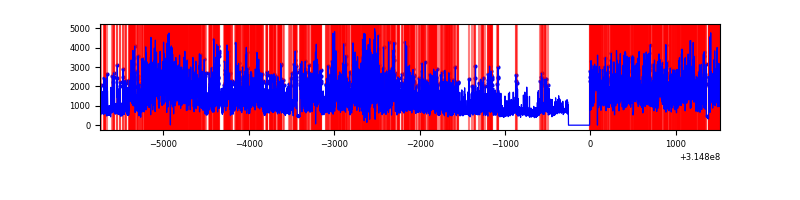 |
Top three noisy pixels from each quadrant. If the there are fewer than three noisy pixels in the level2.evt file, extra rows are filled as -1
| Pixel properties | Quadrant properties | ||||||
|---|---|---|---|---|---|---|---|
| Quadrant | DetID | PixID | Counts | Sigma | Mean | Median | Sigma |
| A | 13 | 254 | 11330 | 62.05 | 834 | 814 | 169.5 |
| A | 0 | 226 | 7431 | 39.04 | 834 | 814 | 169.5 |
| A | 3 | 137 | 7358 | 38.61 | 834 | 814 | 169.5 |
| B | 3 | 64 | 66990 | 426.73 | 823 | 801 | 155.1 |
| B | 12 | 111 | 19289 | 119.2 | 823 | 801 | 155.1 |
| B | 0 | 189 | 17952 | 110.58 | 823 | 801 | 155.1 |
| C | 14 | 238 | 126285 | 683.37 | 789 | 791 | 183.6 |
| C | 13 | 61 | 5524 | 25.77 | 789 | 791 | 183.6 |
| C | 7 | 247 | 2486 | 9.23 | 789 | 791 | 183.6 |
| D | 1 | 239 | 7213237 | 41682.44 | 717 | 693 | 173.0 |
| D | 12 | 233 | 169238 | 974.05 | 717 | 693 | 173.0 |
| D | 8 | 195 | 60651 | 346.51 | 717 | 693 | 173.0 |
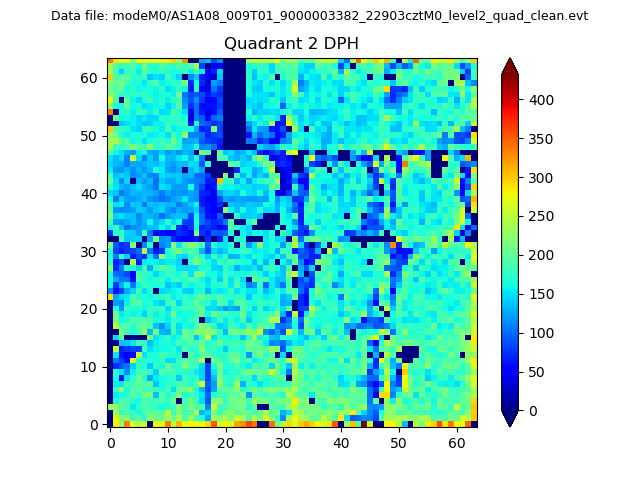
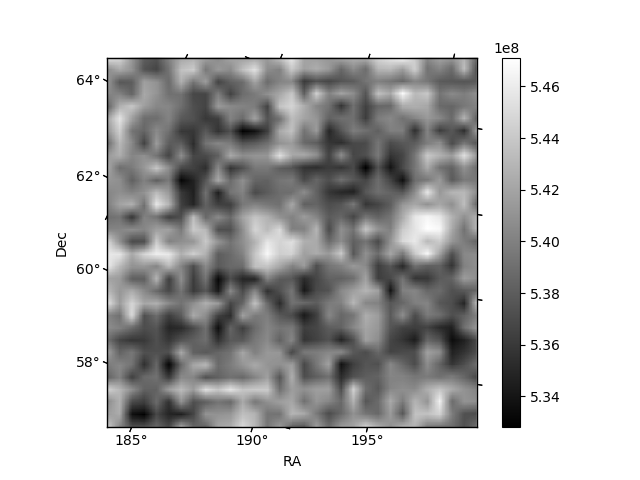
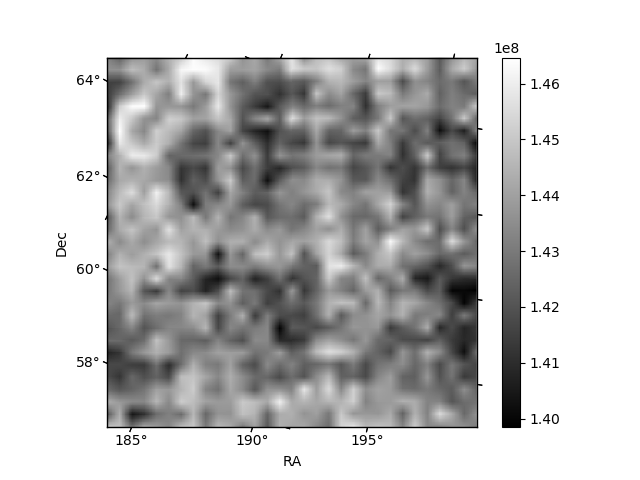
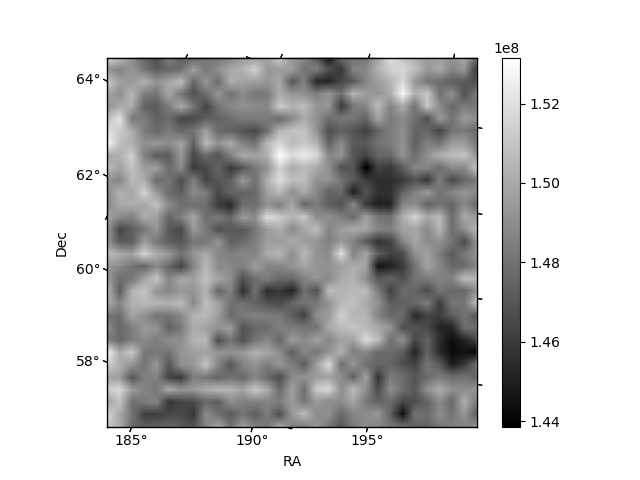
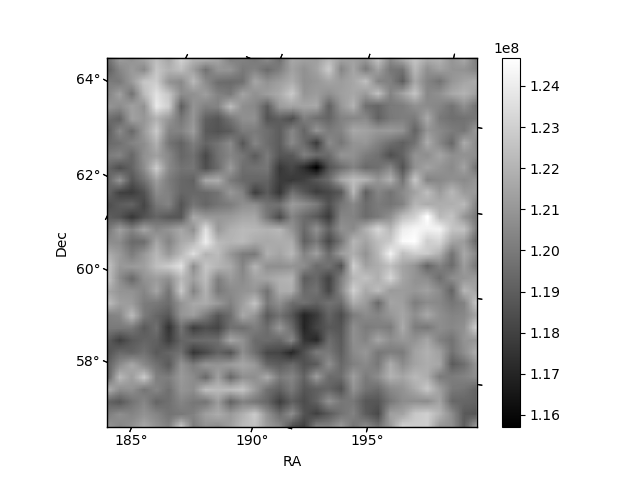
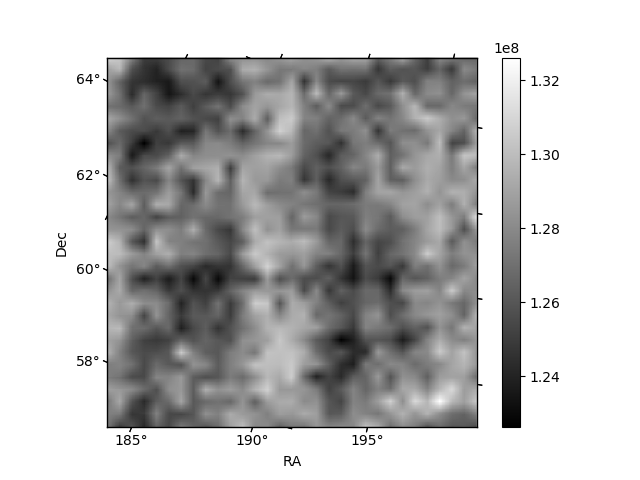
Histogram calculated using DETX and DETY for each event in the final _common_clean file
| Quadrant A | 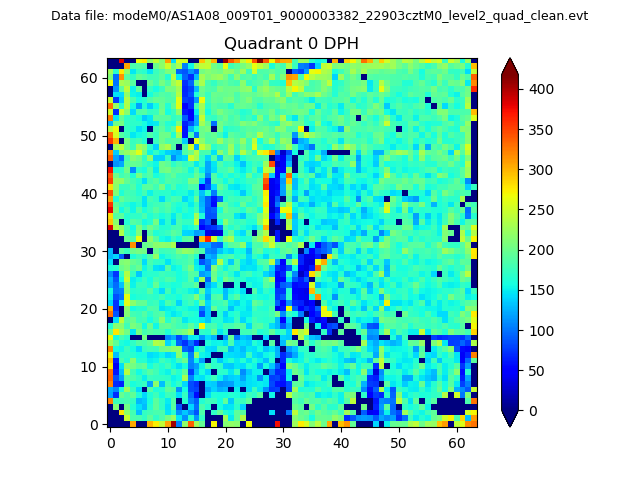 |
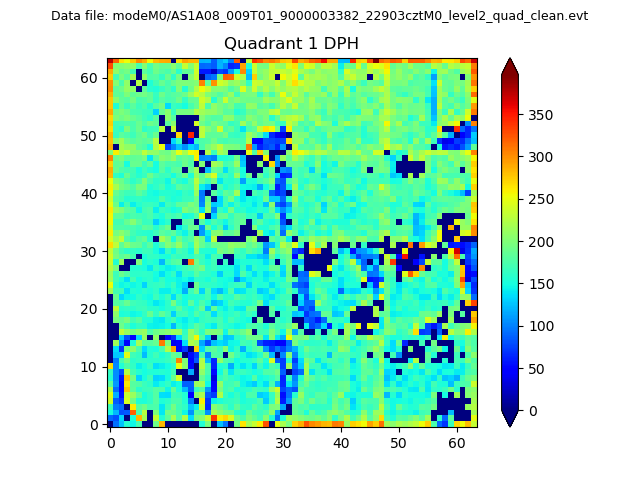 |
Quadrant B |
|---|---|---|---|
| Quadrant D | 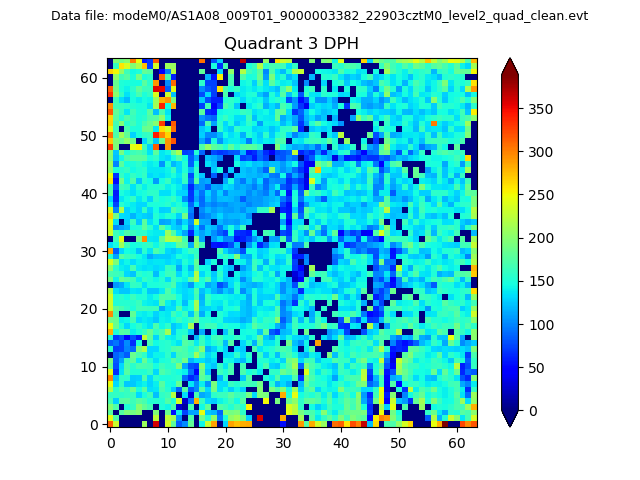 |
 |
Quadrant C |
| Plot type | Count rate plots | Images |
|---|---|---|
| Comparison with Poisson distribution Blue bars denote a histogram of data divided into 1 sec bins. Red curve is a Poisson curve with rate = median count rate of data. |
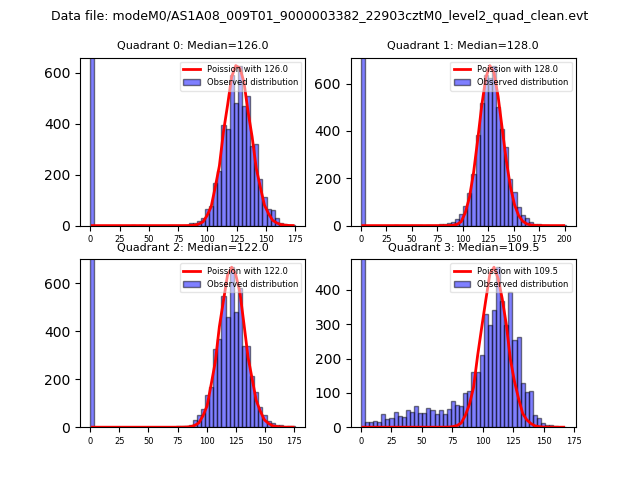 |
 |
| Quadrant-wise count rates Data is divided into 100 sec bins |
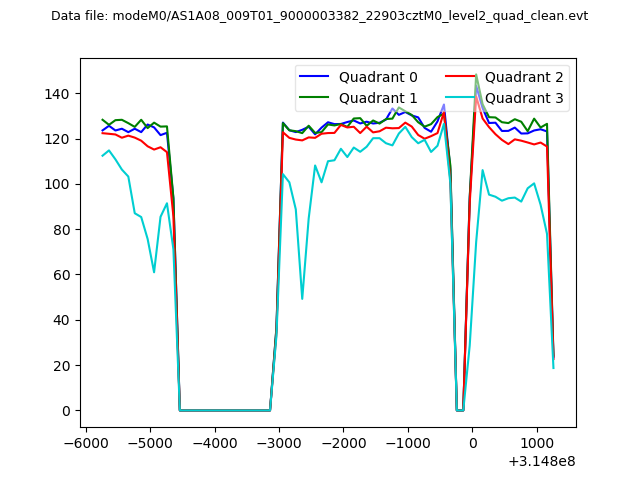 |
|
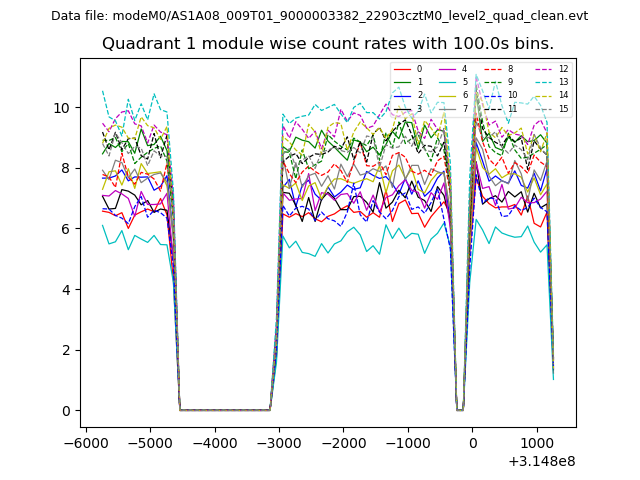
| Module-wise count rates for Quadrant A Data is divided into 100 sec bins |
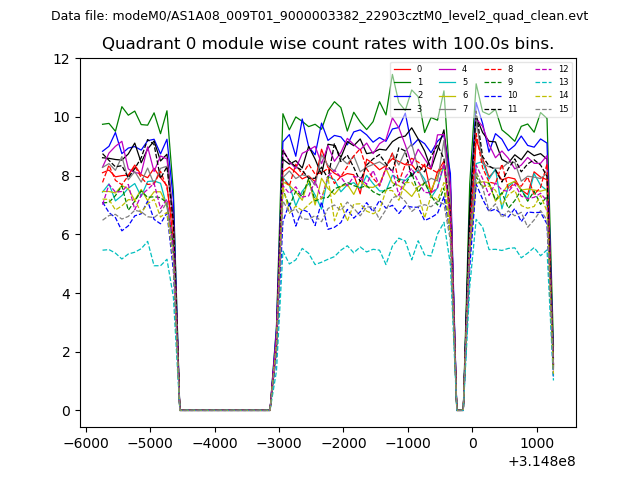 |
 |
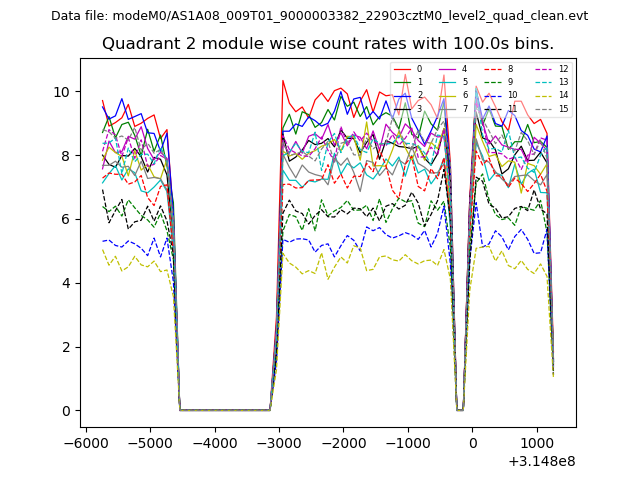
| Module-wise count rates for Quadrant B Data is divided into 100 sec bins |
 |
 |
| Module-wise count rates for Quadrant C Data is divided into 100 sec bins |
 |
 |
| Module-wise count rates for Quadrant D Data is divided into 100 sec bins |
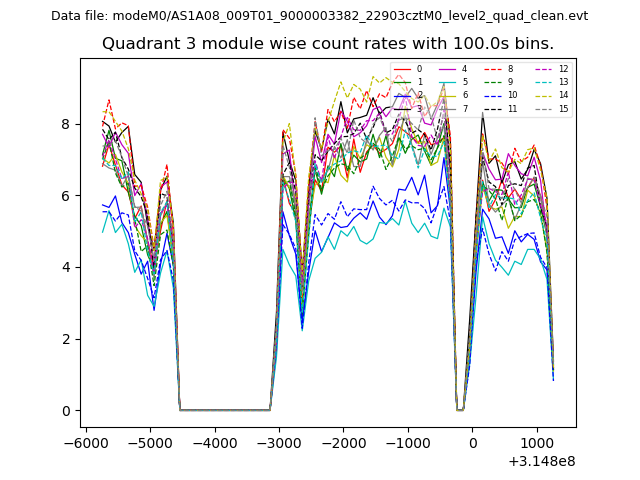 |
 |
| Parameter | Plot |
|---|---|
| CZT HV Monitor | 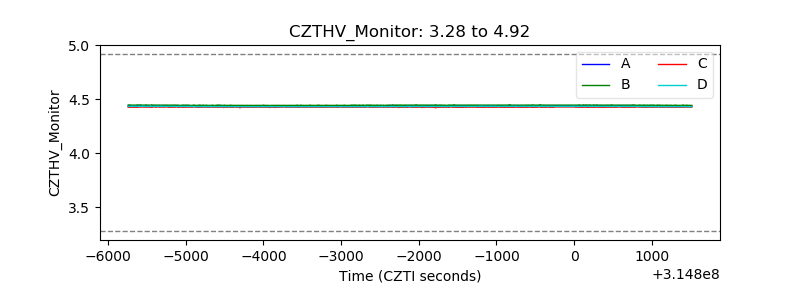 |
| D_VDD | 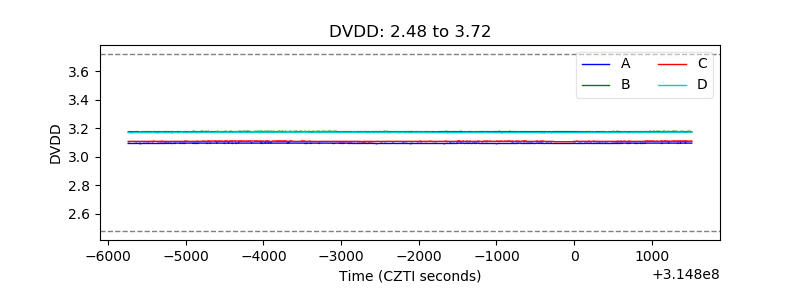 |
| Temperature 1 | 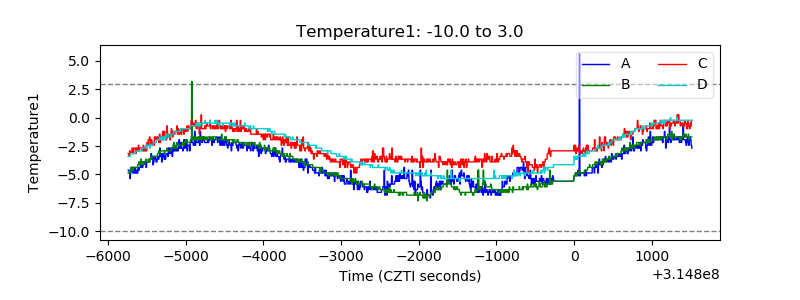 |
| Veto HV Monitor | 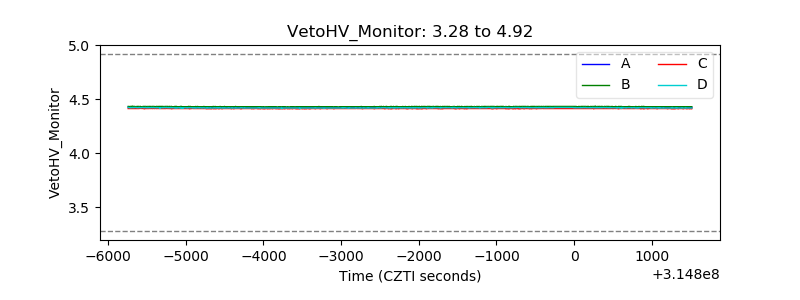 |
| Veto LLD | 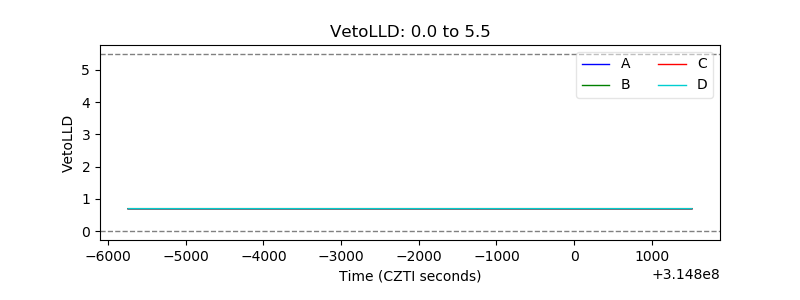 |
| Alpha Counter | 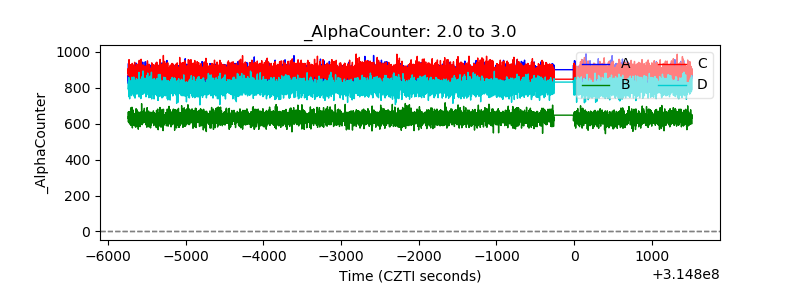 |
| _CPM_Rate | 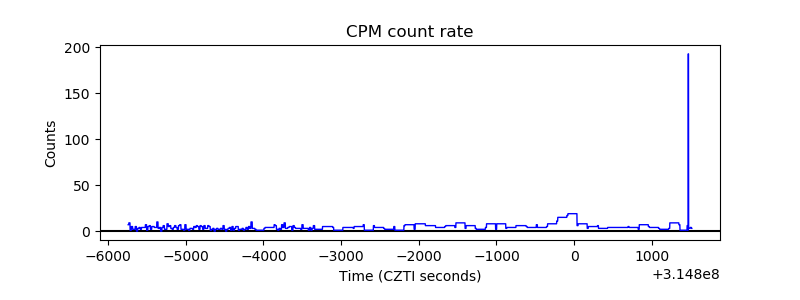 |
| CZT Counter | 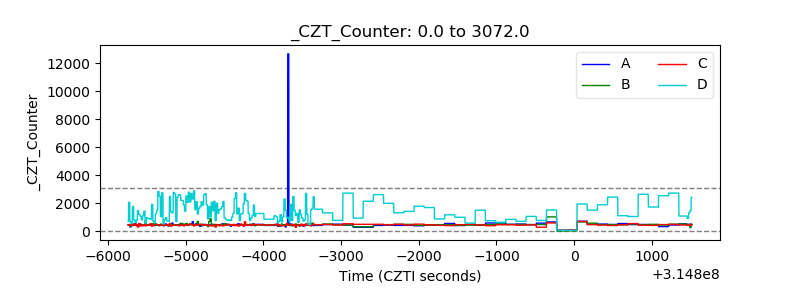 |
| +2.5 Volts monitor |  |
| +5 Volts monitor |  |
| _ROLL_ROT |  |
| _Roll_DEC |  |
| _Roll_RA | 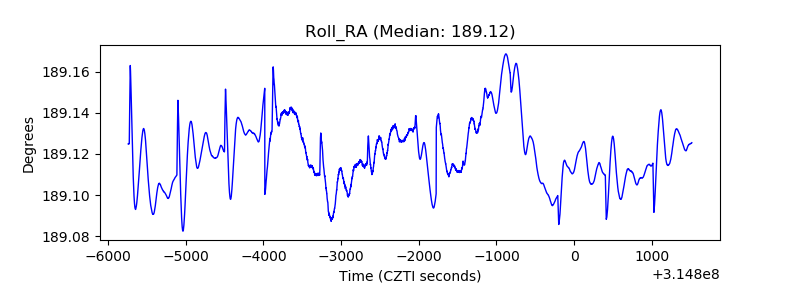 |
| Veto Counter | 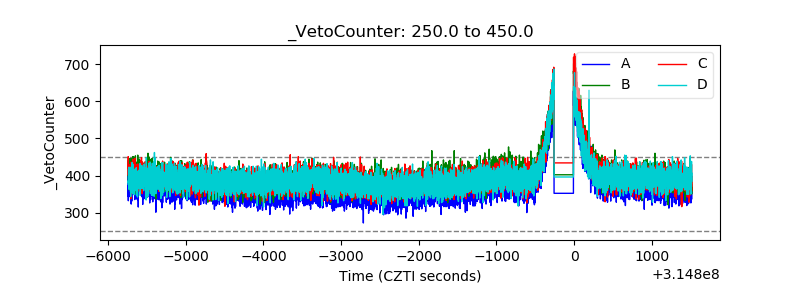 |