| Param | Original file | Final file |
|---|---|---|
| Filename | modeM0/AS1A08_009T01_9000003382_22904cztM0_level2.evt | modeM0/AS1A08_009T01_9000003382_22904cztM0_level2_quad_clean.evt |
| Size (bytes) | 564,194,880 | 87,284,160 |
| Size | 538.1 MB | 83.2 MB |
| Events in quadrant A | 3,250,311 | 555,475 |
| Events in quadrant B | 3,324,915 | 563,552 |
| Events in quadrant C | 3,192,291 | 539,400 |
| Events in quadrant D | 6,846,009 | 498,909 |
| Mode M9 | |||
|---|---|---|---|
| Quadrant | BADHDUFLAG | Total packets | Discarded packets |
| A | 0 | 3 | 0 |
| B | 0 | 3 | 0 |
| C | 0 | 3 | 0 |
| D | 0 | 3 | 0 |
| Mode M0 | |||
|---|---|---|---|
| Quadrant | BADHDUFLAG | Total packets | Discarded packets |
| A | 0 | 14338 | 1 |
| B | 0 | 14414 | 1 |
| C | 0 | 14182 | 1 |
| D | 0 | 25172 | 1 |
| Mode SS | |||
|---|---|---|---|
| Quadrant | BADHDUFLAG | Total packets | Discarded packets |
| A | 0 | 142 | 0 |
| B | 0 | 142 | 0 |
| C | 0 | 142 | 0 |
| D | 0 | 142 | 0 |
| Quadrant | Total seconds | Saturated seconds | Saturation percentage |
|---|---|---|---|
| A | 6969 | 97 | 1.391878% |
| B | 6970 | 115 | 1.649928% |
| C | 6970 | 130 | 1.865136% |
| D | 6970 | 1169 | 16.771879% |
Noise dominated data is calculated using 1-second bins in cleaned event files. If a bin has >2000 counts, and if more than 50% of those come from <1% of pixels, then it is considered to be noise-dominated and hence unusable.
| Quadrant | # 1 sec bins | Bins with >0 counts | Bins with >2000 counts | High rate bins dominated by noise | Noise dominated (total time) | Noise dominated (detector-on time) | Marked lightcurve |
|---|---|---|---|---|---|---|---|
| A | 7274 | 6970 | 0 | 0 | 0.00% | 0.00% | 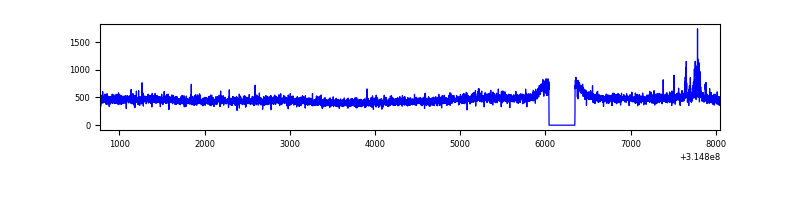 |
| B | 7275 | 6971 | 4 | 4 | 0.05% | 0.06% | 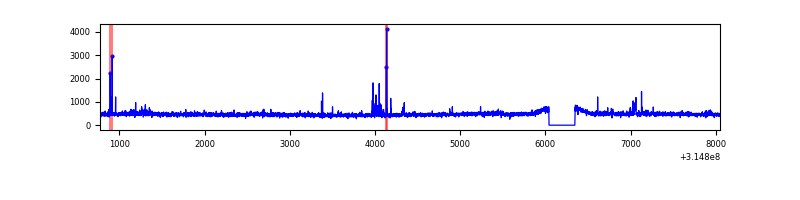 |
| C | 7275 | 6971 | 0 | 0 | 0.00% | 0.00% | 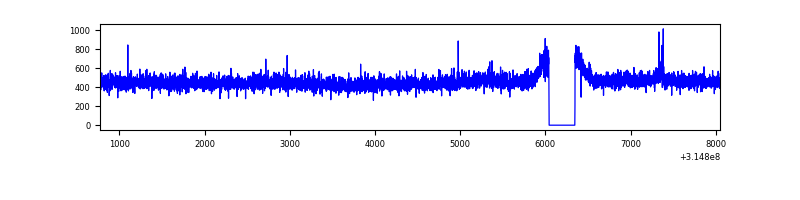 |
| D | 7275 | 6971 | 931 | 931 | 12.80% | 13.36% | 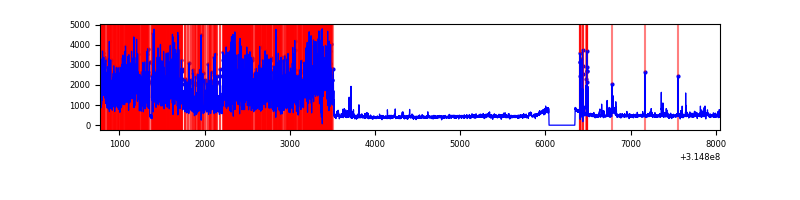 |
Top three noisy pixels from each quadrant. If the there are fewer than three noisy pixels in the level2.evt file, extra rows are filled as -1
| Pixel properties | Quadrant properties | ||||||
|---|---|---|---|---|---|---|---|
| Quadrant | DetID | PixID | Counts | Sigma | Mean | Median | Sigma |
| A | 13 | 170 | 48784 | 285.82 | 826 | 808 | 167.9 |
| A | 13 | 252 | 13014 | 72.72 | 826 | 808 | 167.9 |
| A | 13 | 254 | 12027 | 66.84 | 826 | 808 | 167.9 |
| B | 3 | 64 | 49333 | 313.15 | 816 | 794 | 155.0 |
| B | 0 | 189 | 20262 | 125.59 | 816 | 794 | 155.0 |
| B | 0 | 190 | 19505 | 120.71 | 816 | 794 | 155.0 |
| C | 14 | 238 | 124564 | 673.81 | 784 | 787 | 183.7 |
| C | 7 | 247 | 10620 | 53.53 | 784 | 787 | 183.7 |
| C | 13 | 61 | 5471 | 25.5 | 784 | 787 | 183.7 |
| D | 1 | 239 | 3755846 | 20390.34 | 753 | 729 | 184.2 |
| D | 13 | 153 | 120160 | 648.51 | 753 | 729 | 184.2 |
| D | 1 | 52 | 55734 | 298.68 | 753 | 729 | 184.2 |
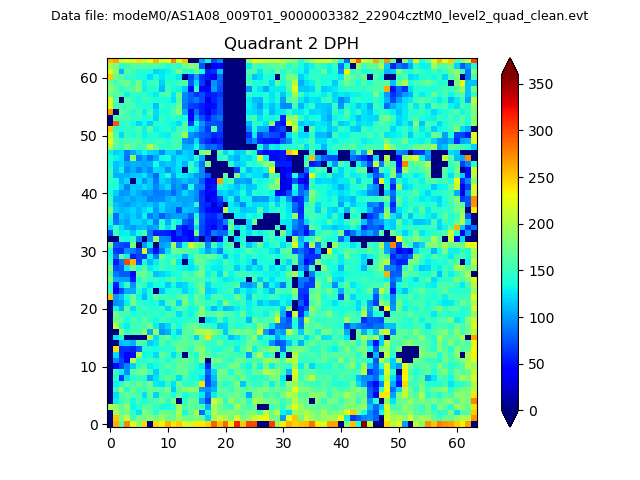
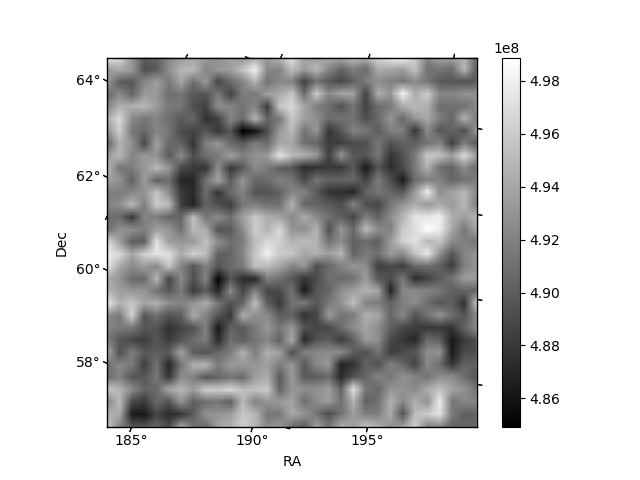
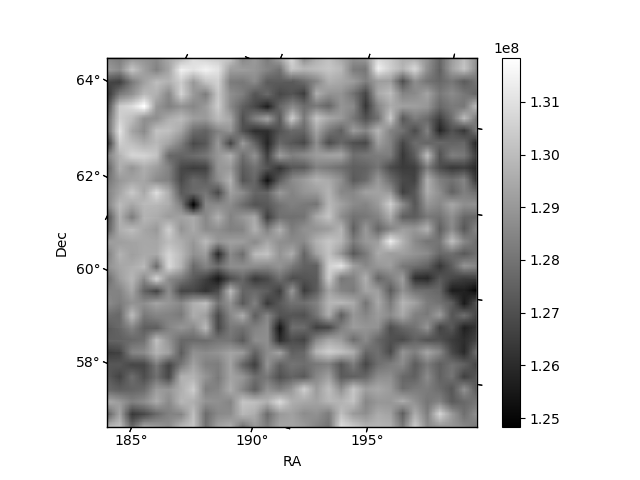
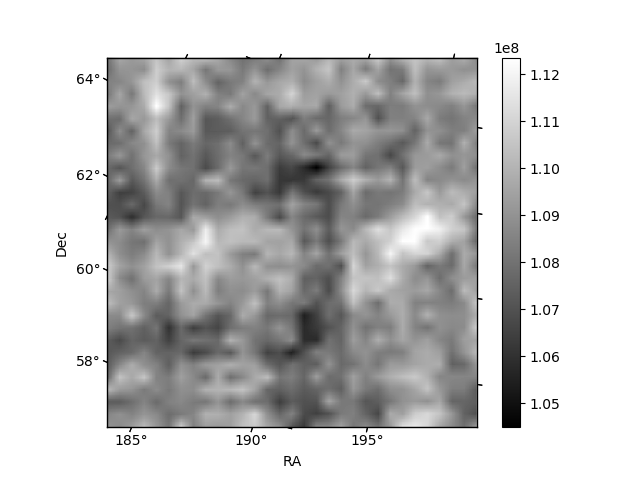
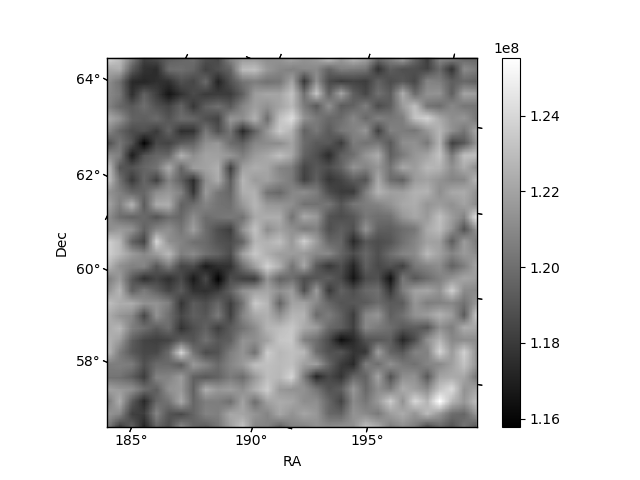
Histogram calculated using DETX and DETY for each event in the final _common_clean file
| Quadrant A | 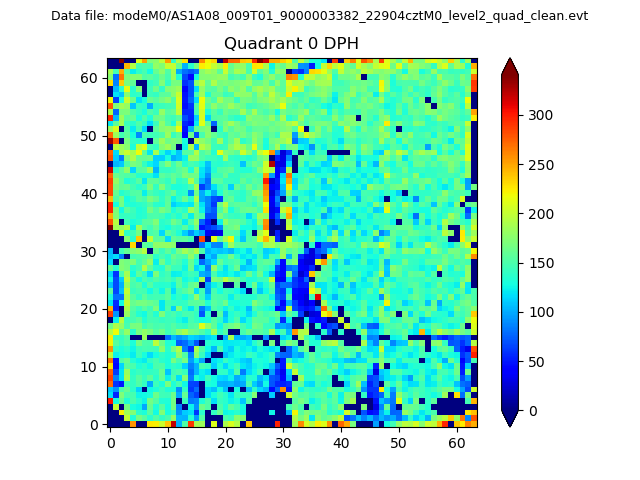 |
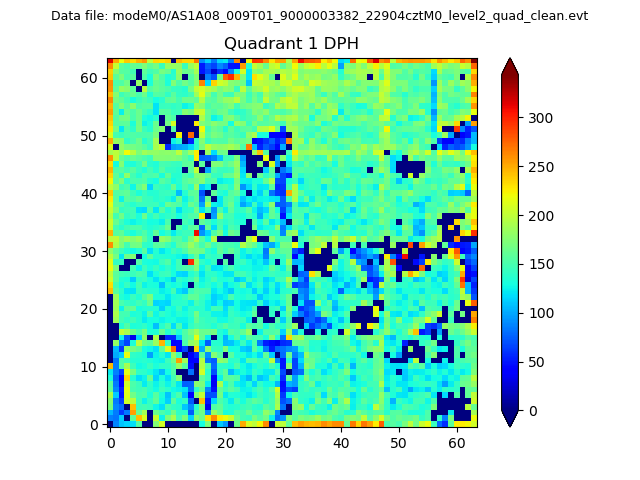 |
Quadrant B |
|---|---|---|---|
| Quadrant D | 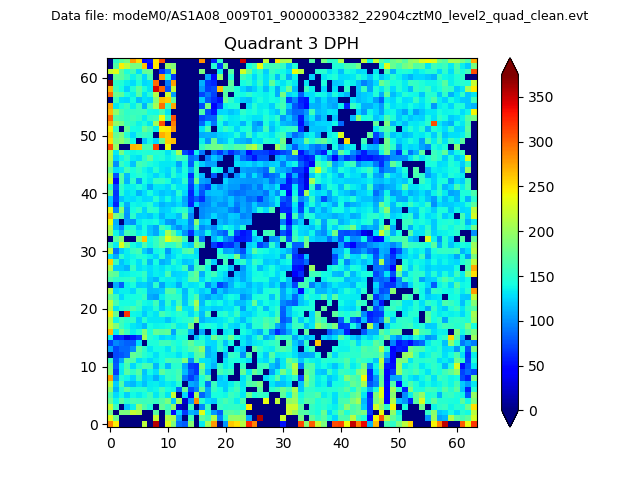 |
 |
Quadrant C |
| Plot type | Count rate plots | Images |
|---|---|---|
| Comparison with Poisson distribution Blue bars denote a histogram of data divided into 1 sec bins. Red curve is a Poisson curve with rate = median count rate of data. |
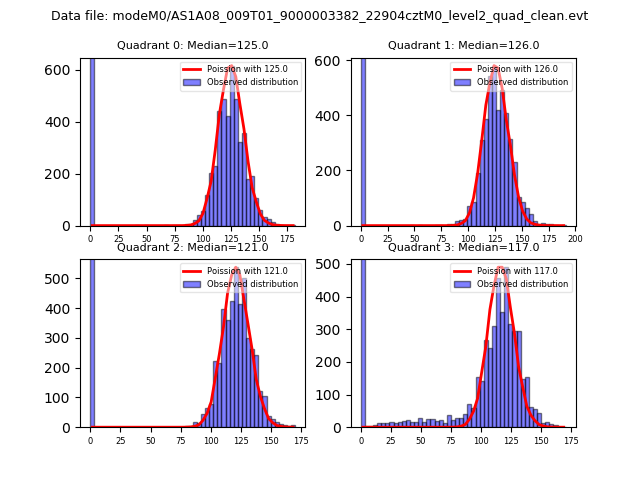 |
 |
| Quadrant-wise count rates Data is divided into 100 sec bins |
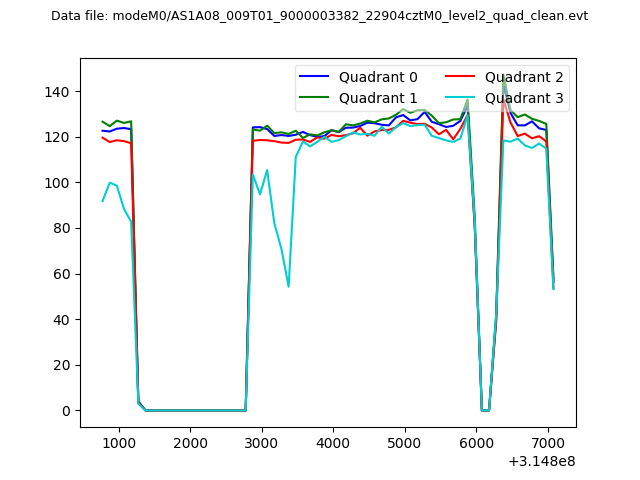 |
|
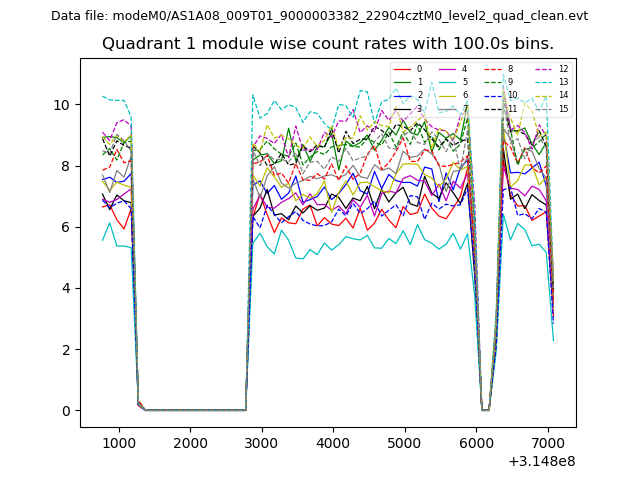
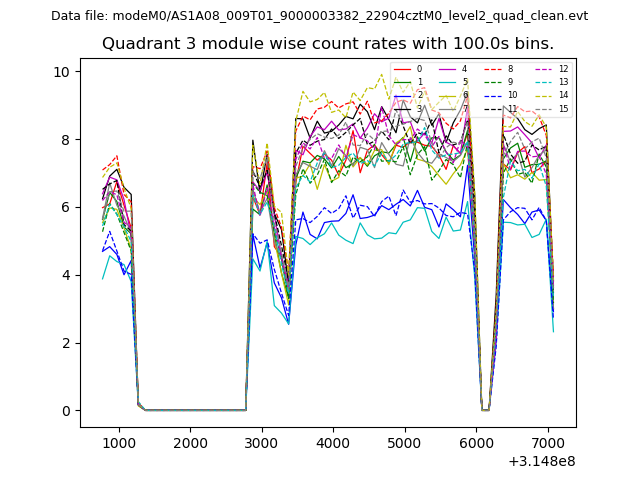
| Module-wise count rates for Quadrant A Data is divided into 100 sec bins |
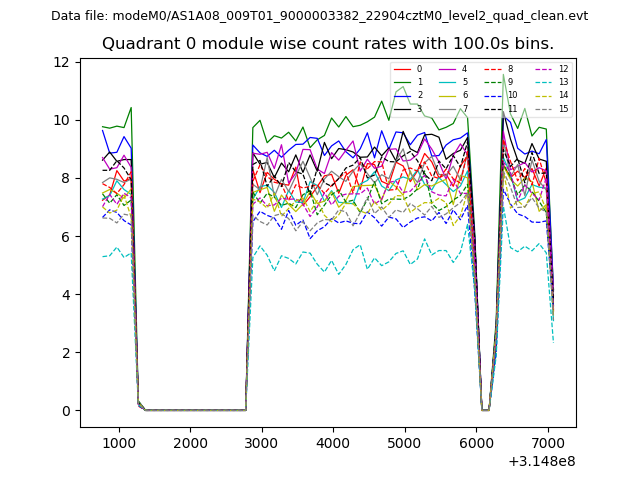 |
 |
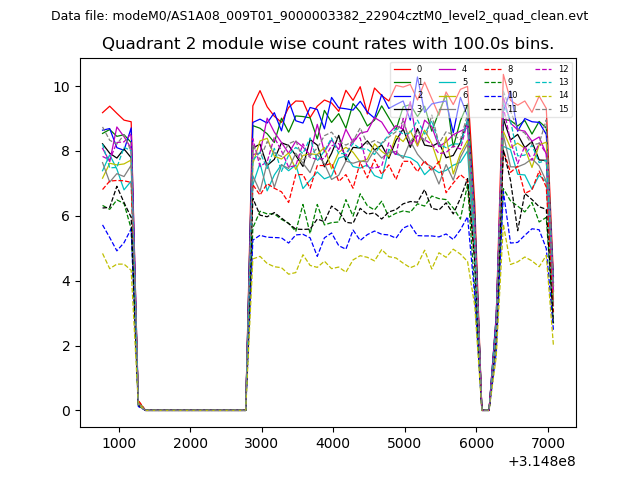
| Module-wise count rates for Quadrant B Data is divided into 100 sec bins |
 |
 |
| Module-wise count rates for Quadrant C Data is divided into 100 sec bins |
 |
 |
| Module-wise count rates for Quadrant D Data is divided into 100 sec bins |
 |
 |
| Parameter | Plot |
|---|---|
| CZT HV Monitor | 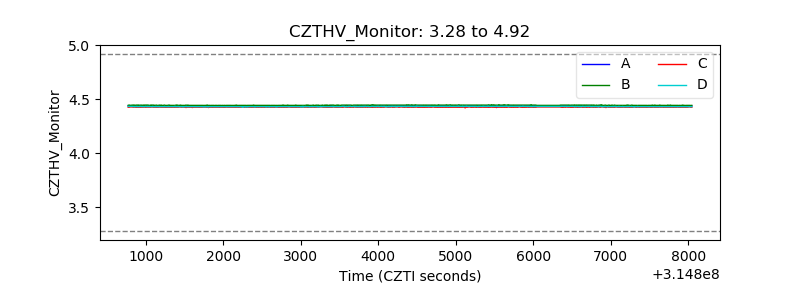 |
| D_VDD | 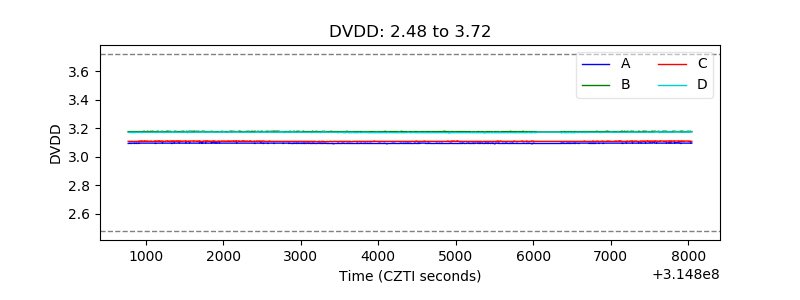 |
| Temperature 1 | 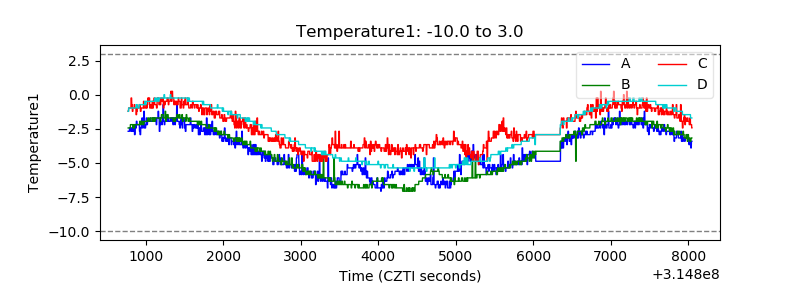 |
| Veto HV Monitor | 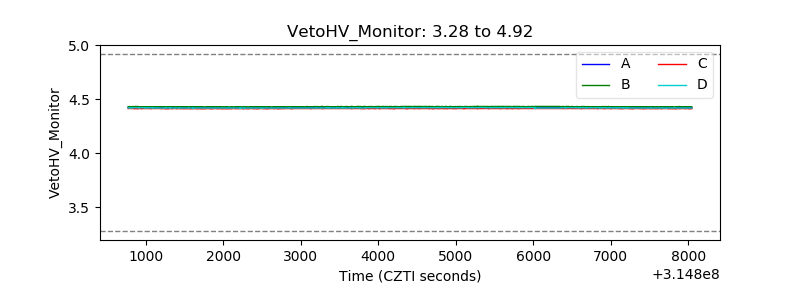 |
| Veto LLD | 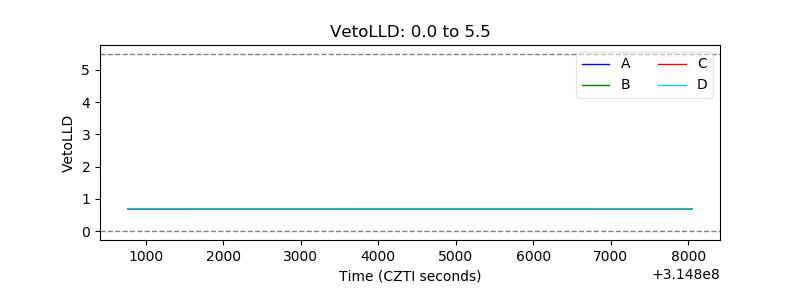 |
| Alpha Counter | 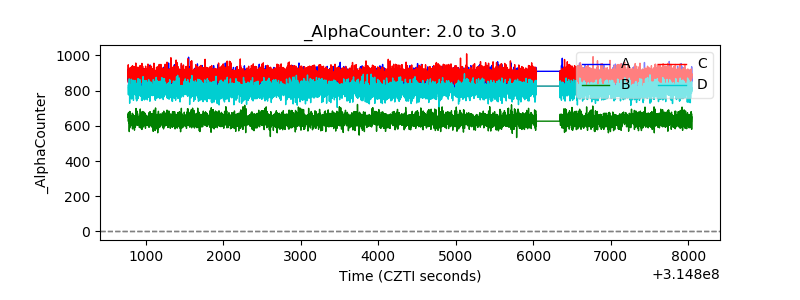 |
| _CPM_Rate | 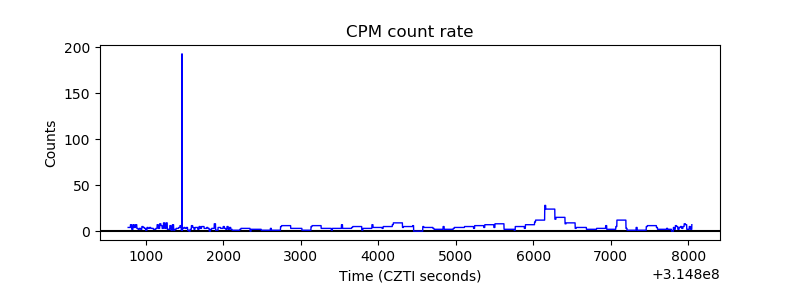 |
| CZT Counter | 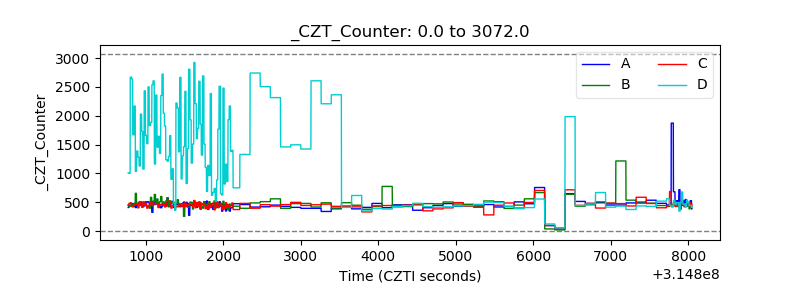 |
| +2.5 Volts monitor |  |
| +5 Volts monitor | 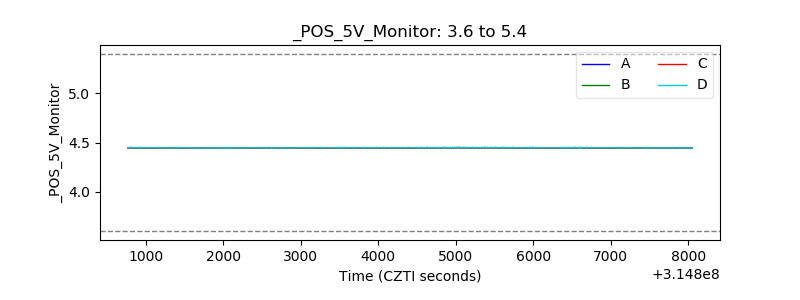 |
| _ROLL_ROT |  |
| _Roll_DEC | 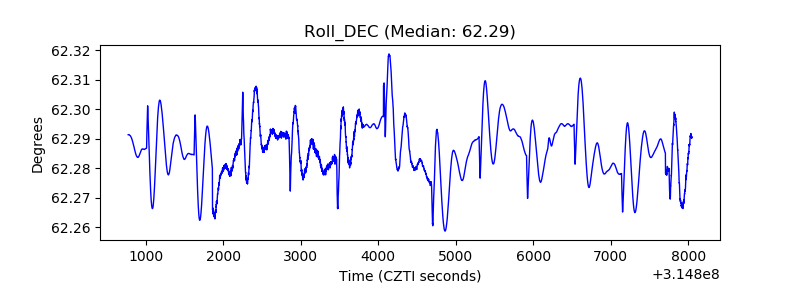 |
| _Roll_RA | 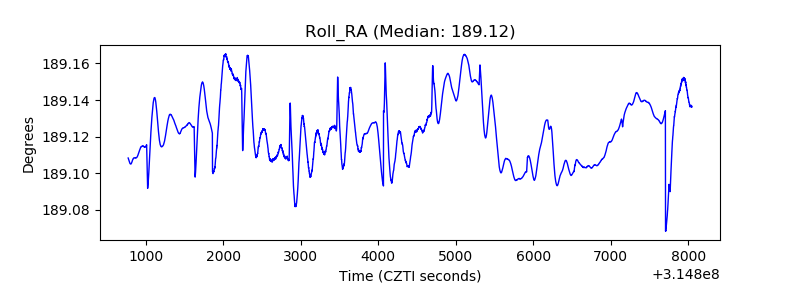 |
| Veto Counter | 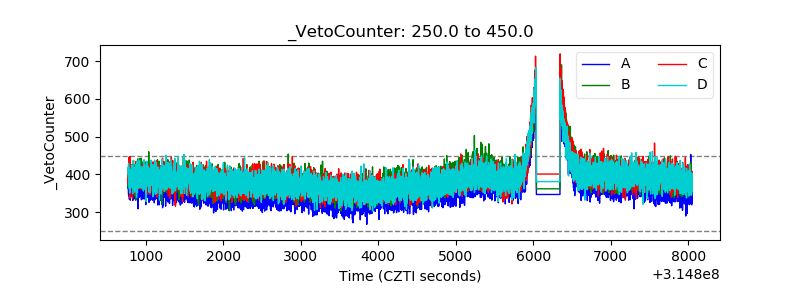 |