| Param | Original file | Final file |
|---|---|---|
| Filename | modeM0/AS1A08_009T01_9000003382_22908cztM0_level2.evt | modeM0/AS1A08_009T01_9000003382_22908cztM0_level2_quad_clean.evt |
| Size (bytes) | 465,609,600 | 97,804,800 |
| Size | 444.0 MB | 93.3 MB |
| Events in quadrant A | 3,129,997 | 630,653 |
| Events in quadrant B | 3,227,477 | 639,875 |
| Events in quadrant C | 3,190,540 | 618,055 |
| Events in quadrant D | 4,095,361 | 604,166 |
| Mode M9 | |||
|---|---|---|---|
| Quadrant | BADHDUFLAG | Total packets | Discarded packets |
| A | 0 | 9 | 0 |
| B | 0 | 10 | 0 |
| C | 0 | 10 | 0 |
| D | 0 | 10 | 0 |
| Mode M0 | |||
|---|---|---|---|
| Quadrant | BADHDUFLAG | Total packets | Discarded packets |
| A | 0 | 13783 | 3 |
| B | 0 | 14044 | 2 |
| C | 0 | 13968 | 2 |
| D | 0 | 17135 | 2 |
| Mode SS | |||
|---|---|---|---|
| Quadrant | BADHDUFLAG | Total packets | Discarded packets |
| A | 0 | 138 | 0 |
| B | 0 | 138 | 0 |
| C | 0 | 138 | 0 |
| D | 0 | 138 | 0 |
| Quadrant | Total seconds | Saturated seconds | Saturation percentage |
|---|---|---|---|
| A | 6728 | 38 | 0.564804% |
| B | 6728 | 44 | 0.653983% |
| C | 6728 | 92 | 1.367420% |
| D | 6728 | 215 | 3.195600% |
Noise dominated data is calculated using 1-second bins in cleaned event files. If a bin has >2000 counts, and if more than 50% of those come from <1% of pixels, then it is considered to be noise-dominated and hence unusable.
| Quadrant | # 1 sec bins | Bins with >0 counts | Bins with >2000 counts | High rate bins dominated by noise | Noise dominated (total time) | Noise dominated (detector-on time) | Marked lightcurve |
|---|---|---|---|---|---|---|---|
| A | 7663 | 6728 | 0 | 0 | 0.00% | 0.00% | 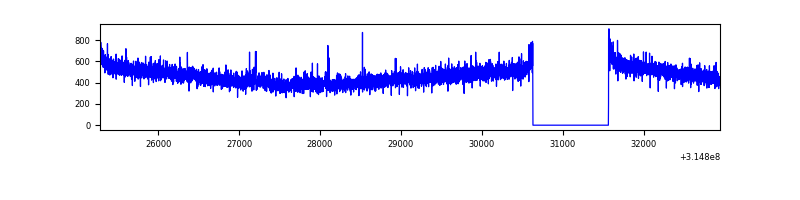 |
| B | 7663 | 6728 | 1 | 1 | 0.01% | 0.01% | 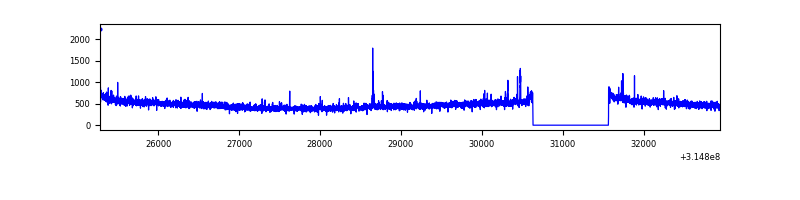 |
| C | 7663 | 6729 | 2 | 2 | 0.03% | 0.03% | 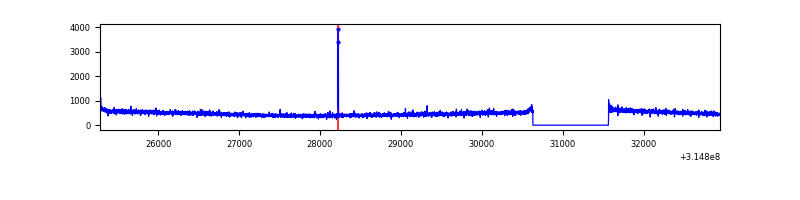 |
| D | 7663 | 6729 | 123 | 123 | 1.61% | 1.83% | 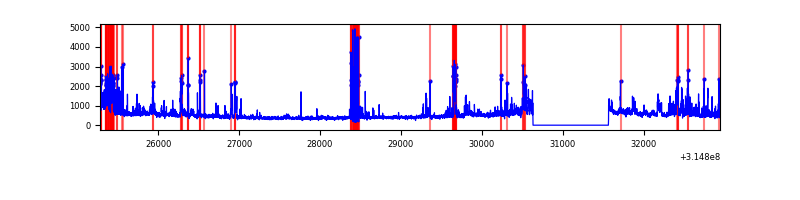 |
Top three noisy pixels from each quadrant. If the there are fewer than three noisy pixels in the level2.evt file, extra rows are filled as -1
| Pixel properties | Quadrant properties | ||||||
|---|---|---|---|---|---|---|---|
| Quadrant | DetID | PixID | Counts | Sigma | Mean | Median | Sigma |
| A | 13 | 170 | 19260 | 113.93 | 806 | 788 | 162.1 |
| A | 13 | 254 | 11223 | 64.36 | 806 | 788 | 162.1 |
| A | 3 | 137 | 7234 | 39.76 | 806 | 788 | 162.1 |
| B | 12 | 111 | 19016 | 117.9 | 808 | 787 | 154.6 |
| B | 11 | 111 | 16646 | 102.57 | 808 | 787 | 154.6 |
| B | 0 | 190 | 14866 | 91.06 | 808 | 787 | 154.6 |
| C | 14 | 238 | 124012 | 668.63 | 783 | 787 | 184.3 |
| C | 7 | 247 | 12529 | 63.71 | 783 | 787 | 184.3 |
| C | 13 | 61 | 5325 | 24.62 | 783 | 787 | 184.3 |
| D | 1 | 52 | 570337 | 3010.24 | 781 | 758 | 189.2 |
| D | 12 | 233 | 257592 | 1357.38 | 781 | 758 | 189.2 |
| D | 13 | 174 | 172002 | 905.03 | 781 | 758 | 189.2 |
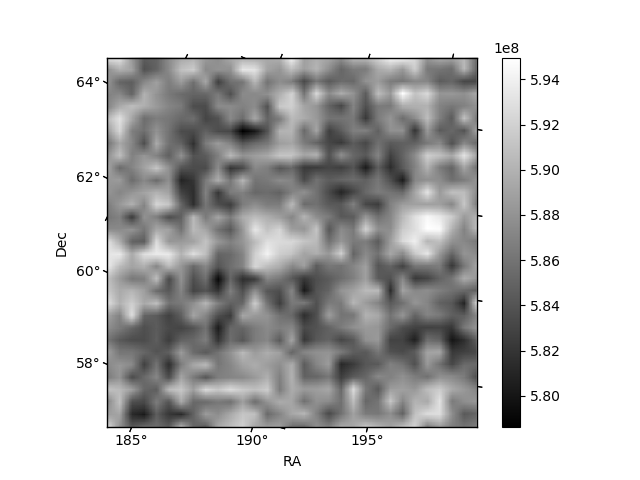
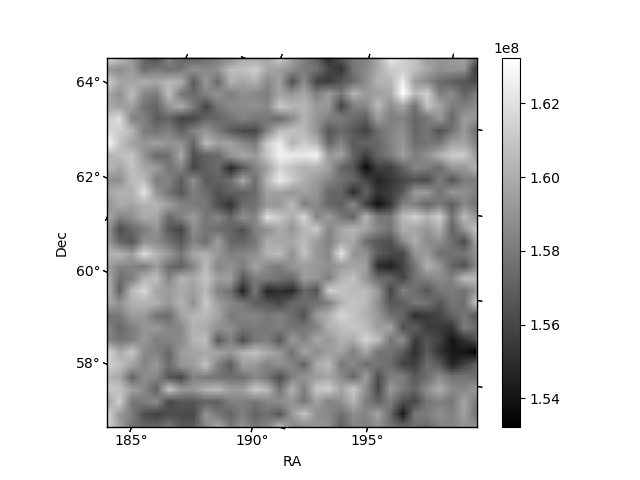
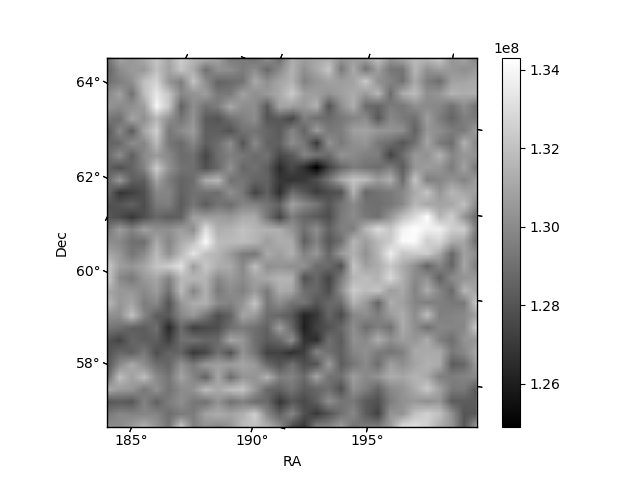
Histogram calculated using DETX and DETY for each event in the final _common_clean file
| Quadrant A | 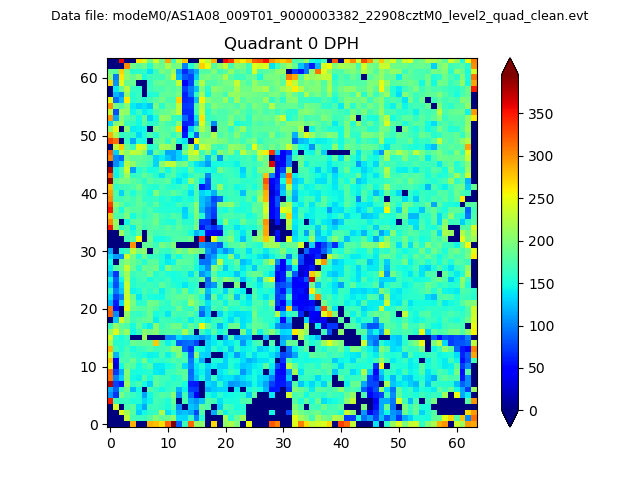 |
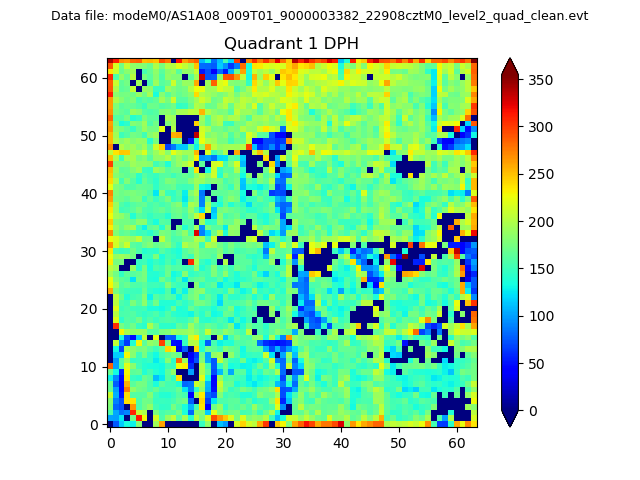 |
Quadrant B |
|---|---|---|---|
| Quadrant D | 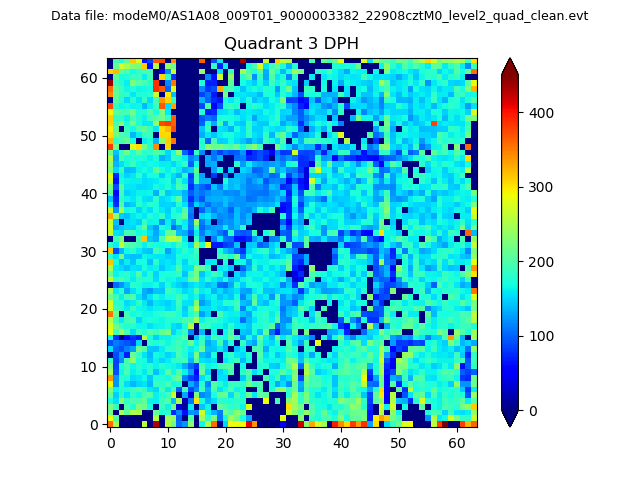 |
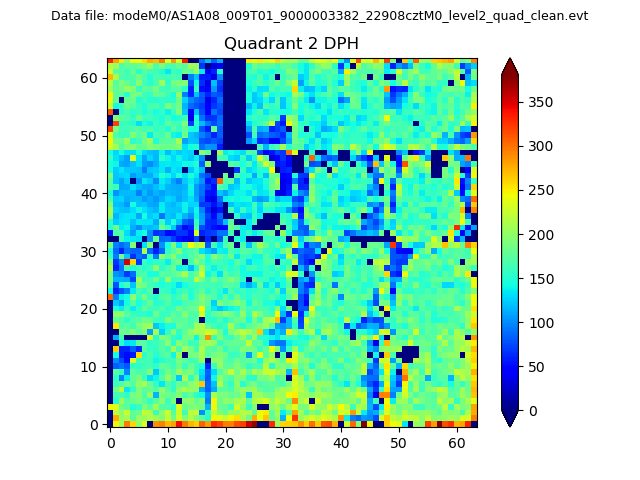 |
Quadrant C |
| Plot type | Count rate plots | Images |
|---|---|---|
| Comparison with Poisson distribution Blue bars denote a histogram of data divided into 1 sec bins. Red curve is a Poisson curve with rate = median count rate of data. |
 |
 |
| Quadrant-wise count rates Data is divided into 100 sec bins |
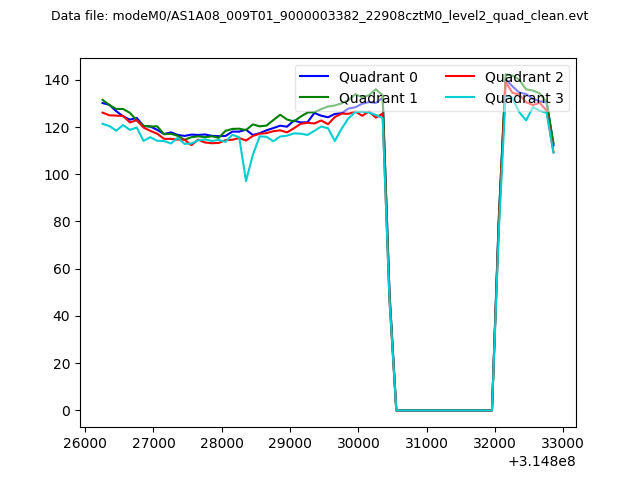 |
|
| Module-wise count rates for Quadrant A Data is divided into 100 sec bins |
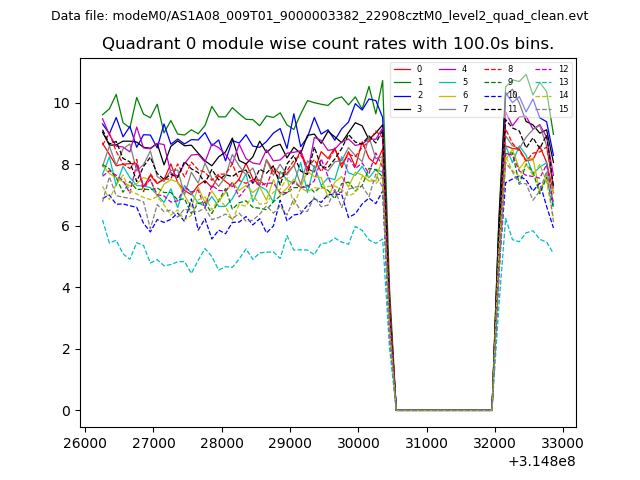 |
 |
| Module-wise count rates for Quadrant B Data is divided into 100 sec bins |
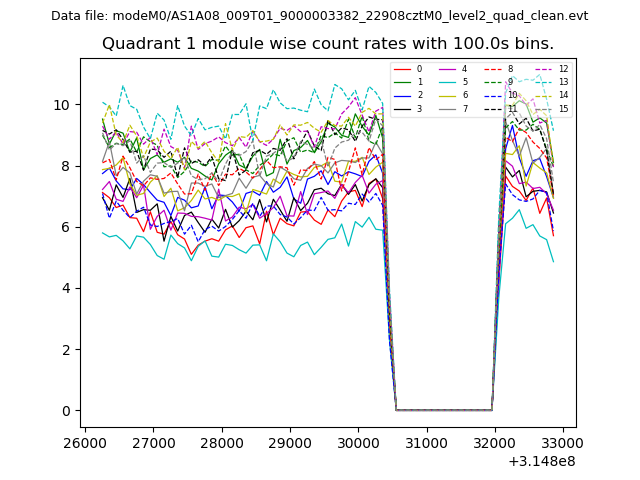 |
 |
| Module-wise count rates for Quadrant C Data is divided into 100 sec bins |
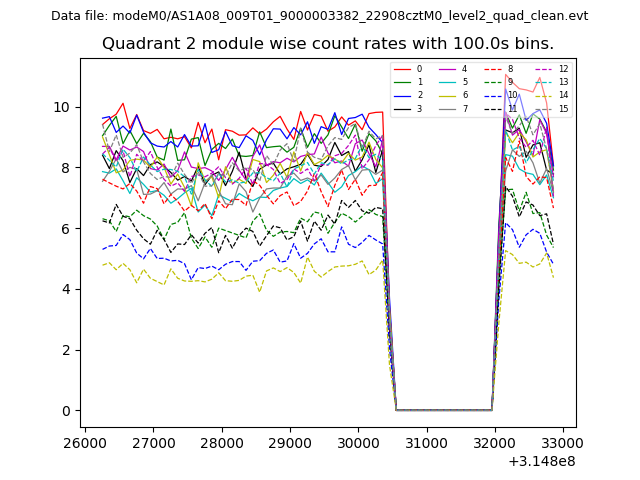 |
 |
| Module-wise count rates for Quadrant D Data is divided into 100 sec bins |
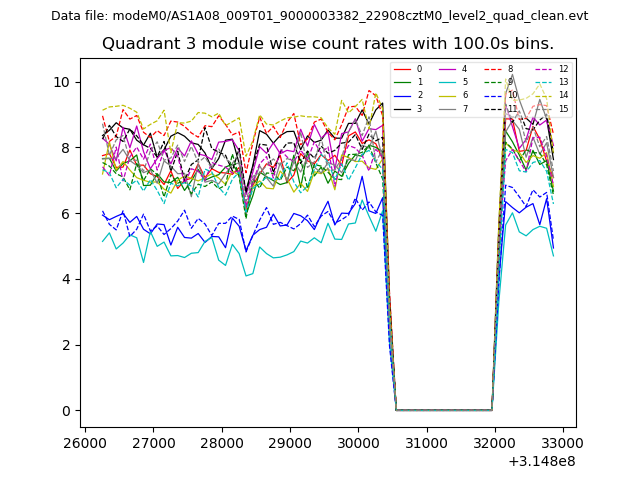 |
 |
| Parameter | Plot |
|---|---|
| CZT HV Monitor | 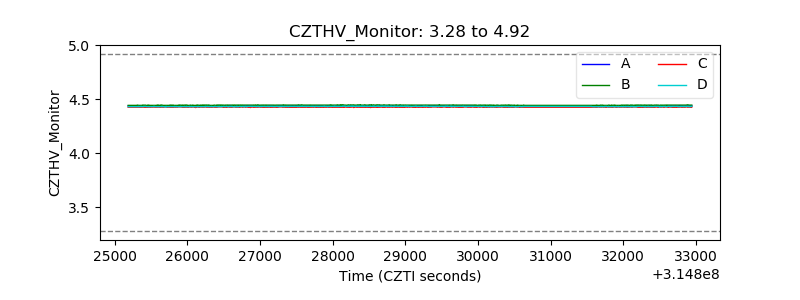 |
| D_VDD | 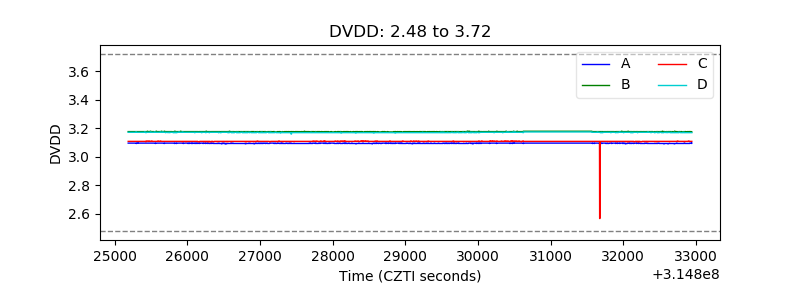 |
| Temperature 1 | 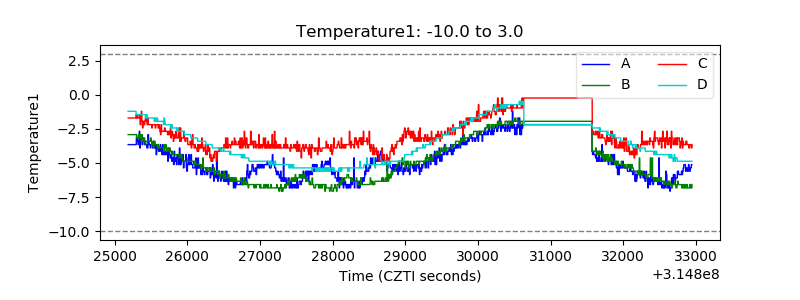 |
| Veto HV Monitor |  |
| Veto LLD | 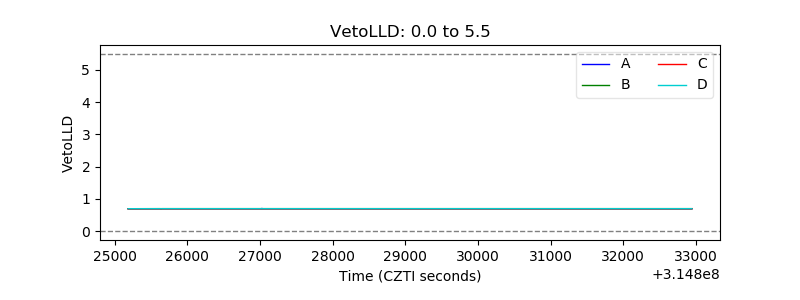 |
| Alpha Counter | 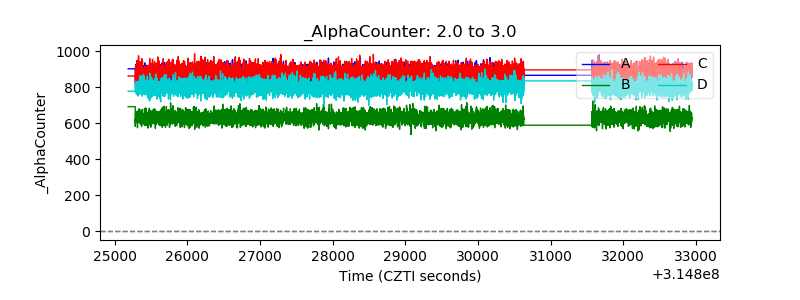 |
| _CPM_Rate | 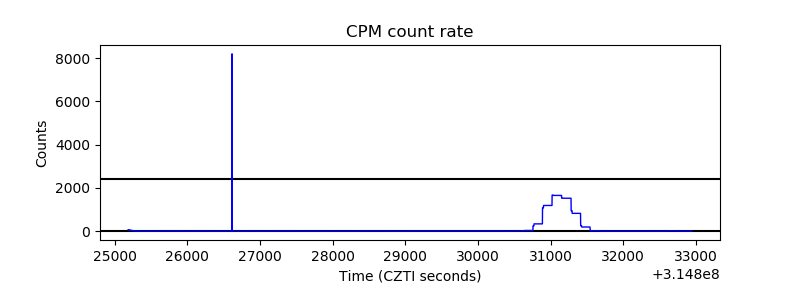 |
| CZT Counter | 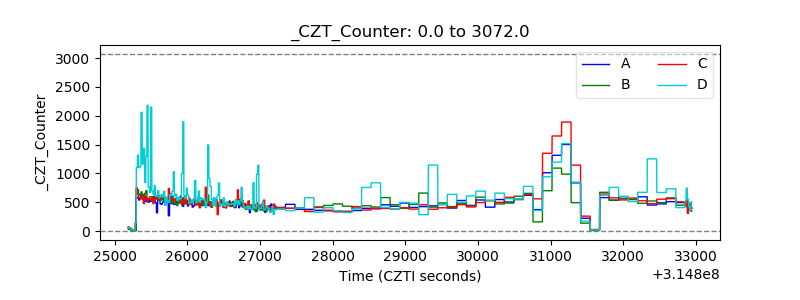 |
| +2.5 Volts monitor |  |
| +5 Volts monitor |  |
| _ROLL_ROT | 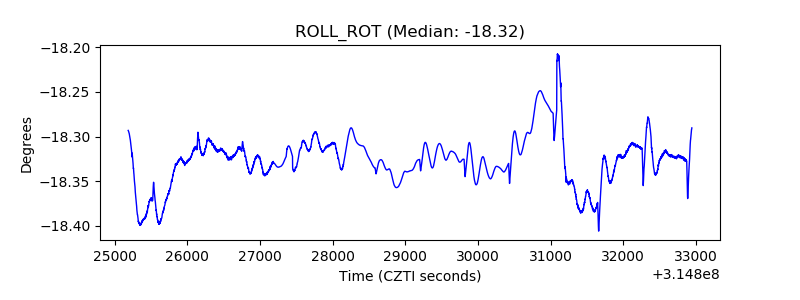 |
| _Roll_DEC | 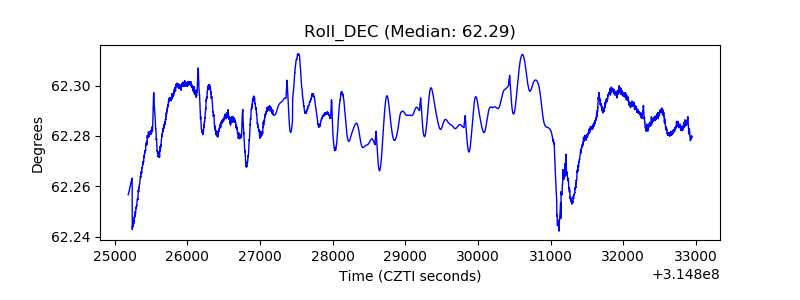 |
| _Roll_RA | 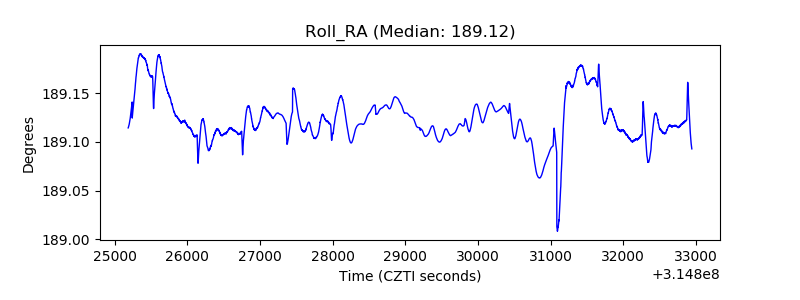 |
| Veto Counter | 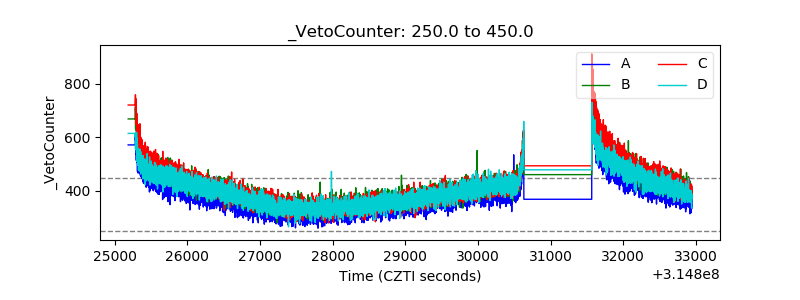 |