| Param | Original file | Final file |
|---|---|---|
| Filename | modeM0/AS1A08_009T01_9000003382_22910cztM0_level2.evt | modeM0/AS1A08_009T01_9000003382_22910cztM0_level2_quad_clean.evt |
| Size (bytes) | 458,573,760 | 108,095,040 |
| Size | 437.3 MB | 103.1 MB |
| Events in quadrant A | 3,119,767 | 712,414 |
| Events in quadrant B | 3,191,066 | 729,846 |
| Events in quadrant C | 3,125,885 | 700,951 |
| Events in quadrant D | 4,007,024 | 674,765 |
| Mode M9 | |||
|---|---|---|---|
| Quadrant | BADHDUFLAG | Total packets | Discarded packets |
| A | 0 | 12 | 0 |
| B | 0 | 13 | 0 |
| C | 0 | 13 | 0 |
| D | 0 | 13 | 0 |
| Mode M0 | |||
|---|---|---|---|
| Quadrant | BADHDUFLAG | Total packets | Discarded packets |
| A | 0 | 13519 | 2 |
| B | 0 | 13902 | 2 |
| C | 0 | 13726 | 3 |
| D | 0 | 16579 | 2 |
| Mode SS | |||
|---|---|---|---|
| Quadrant | BADHDUFLAG | Total packets | Discarded packets |
| A | 0 | 134 | 0 |
| B | 0 | 134 | 0 |
| C | 0 | 134 | 0 |
| D | 0 | 134 | 0 |
| Quadrant | Total seconds | Saturated seconds | Saturation percentage |
|---|---|---|---|
| A | 6533 | 33 | 0.505128% |
| B | 6533 | 34 | 0.520435% |
| C | 6532 | 83 | 1.270667% |
| D | 6532 | 138 | 2.112676% |
Noise dominated data is calculated using 1-second bins in cleaned event files. If a bin has >2000 counts, and if more than 50% of those come from <1% of pixels, then it is considered to be noise-dominated and hence unusable.
| Quadrant | # 1 sec bins | Bins with >0 counts | Bins with >2000 counts | High rate bins dominated by noise | Noise dominated (total time) | Noise dominated (detector-on time) | Marked lightcurve |
|---|---|---|---|---|---|---|---|
| A | 7623 | 6534 | 0 | 0 | 0.00% | 0.00% | 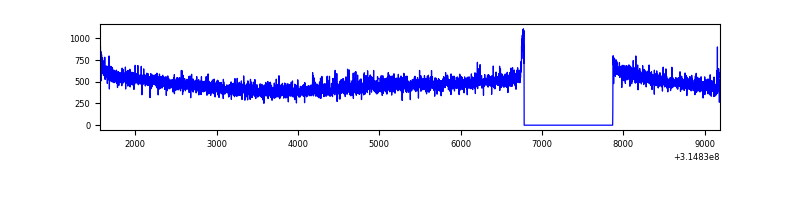 |
| B | 7623 | 6534 | 0 | 0 | 0.00% | 0.00% | 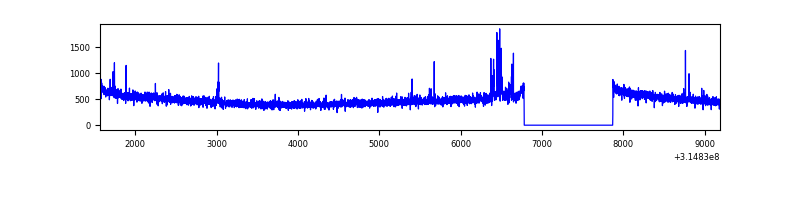 |
| C | 7622 | 6533 | 0 | 0 | 0.00% | 0.00% | 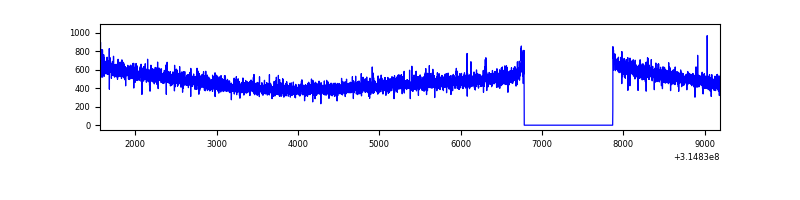 |
| D | 7622 | 6533 | 103 | 103 | 1.35% | 1.58% | 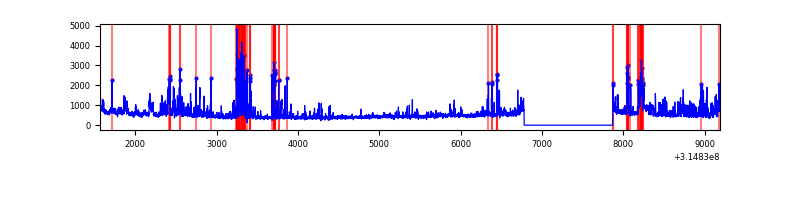 |
Top three noisy pixels from each quadrant. If the there are fewer than three noisy pixels in the level2.evt file, extra rows are filled as -1
| Pixel properties | Quadrant properties | ||||||
|---|---|---|---|---|---|---|---|
| Quadrant | DetID | PixID | Counts | Sigma | Mean | Median | Sigma |
| A | 13 | 252 | 59681 | 371.37 | 791 | 774 | 158.6 |
| A | 13 | 254 | 10765 | 62.99 | 791 | 774 | 158.6 |
| A | 0 | 23 | 9694 | 56.24 | 791 | 774 | 158.6 |
| B | 3 | 64 | 34126 | 221.8 | 794 | 774 | 150.4 |
| B | 12 | 111 | 18210 | 115.95 | 794 | 774 | 150.4 |
| B | 11 | 111 | 16044 | 101.55 | 794 | 774 | 150.4 |
| C | 14 | 238 | 122527 | 683.67 | 767 | 770 | 178.1 |
| C | 7 | 247 | 5721 | 27.8 | 767 | 770 | 178.1 |
| C | 13 | 61 | 5312 | 25.5 | 767 | 770 | 178.1 |
| D | 1 | 52 | 735173 | 3950.21 | 765 | 742 | 185.9 |
| D | 12 | 233 | 263635 | 1414.0 | 765 | 742 | 185.9 |
| D | 13 | 153 | 39535 | 208.65 | 765 | 742 | 185.9 |
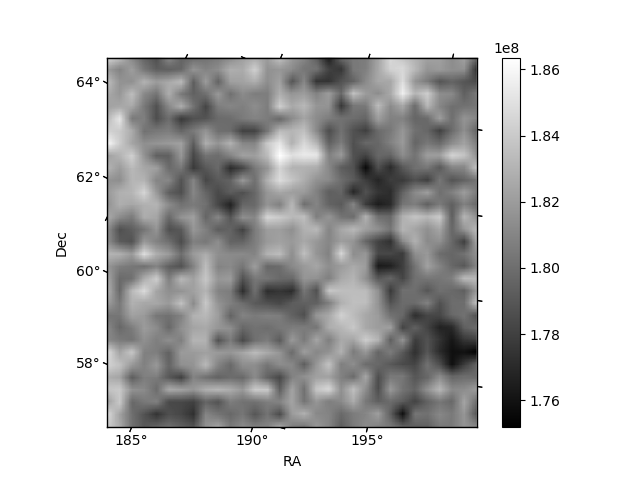
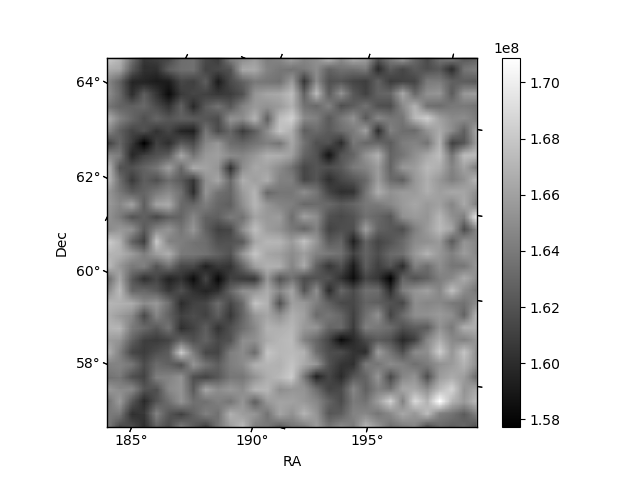
Histogram calculated using DETX and DETY for each event in the final _common_clean file
| Quadrant A | 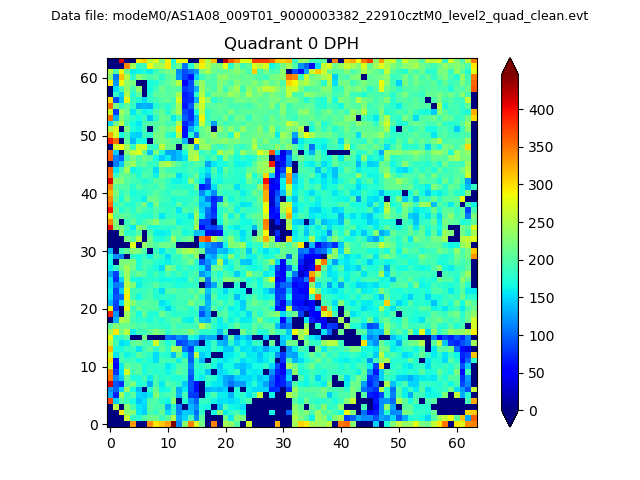 |
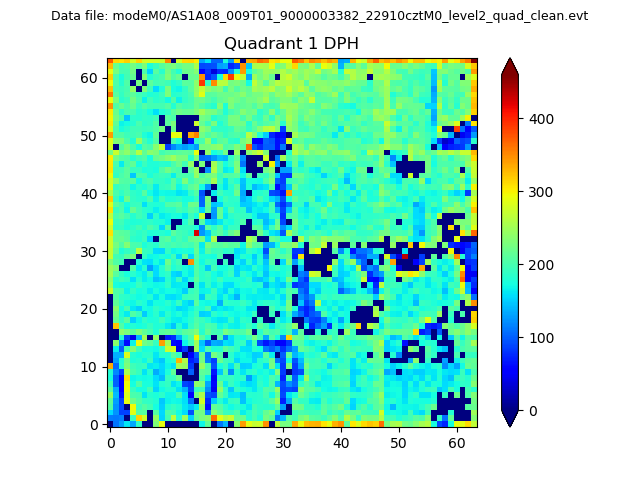 |
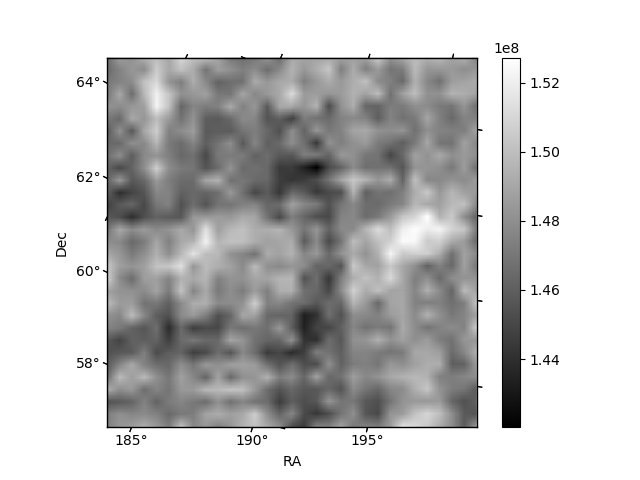
Quadrant B |
|---|---|---|---|
| Quadrant D | 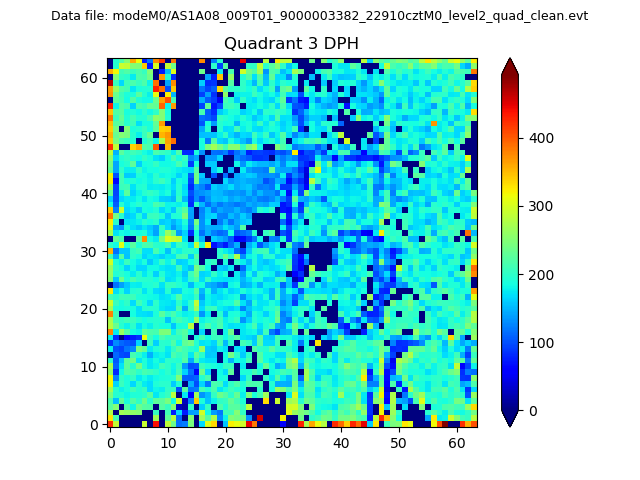 |
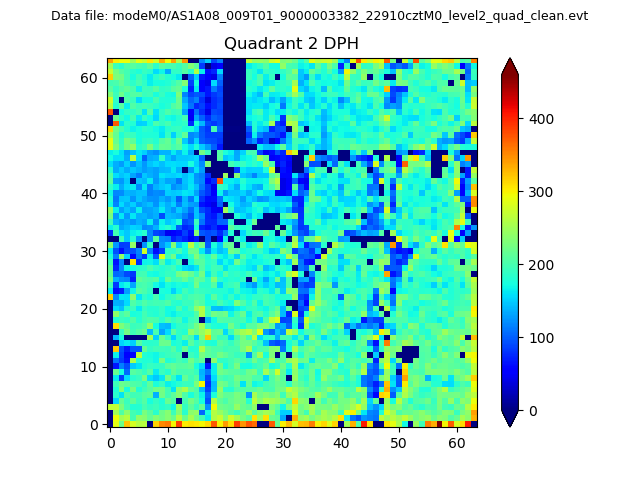 |
Quadrant C |
| Plot type | Count rate plots | Images |
|---|---|---|
| Comparison with Poisson distribution Blue bars denote a histogram of data divided into 1 sec bins. Red curve is a Poisson curve with rate = median count rate of data. |
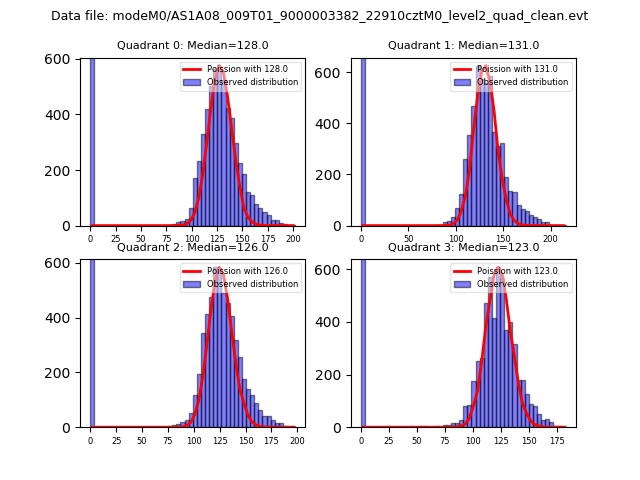 |
 |
| Quadrant-wise count rates Data is divided into 100 sec bins |
 |
|
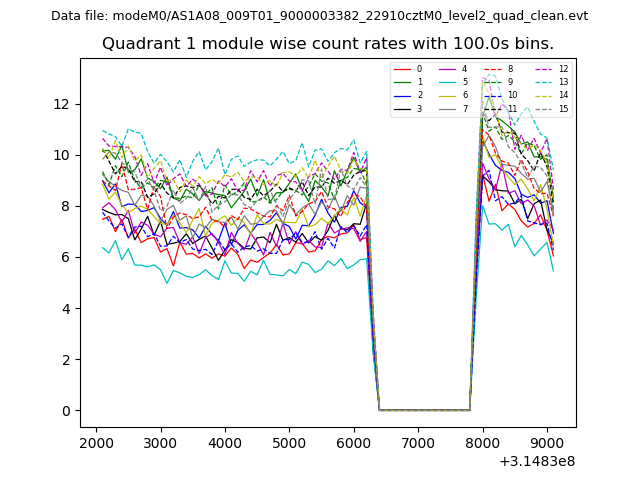
| Module-wise count rates for Quadrant A Data is divided into 100 sec bins |
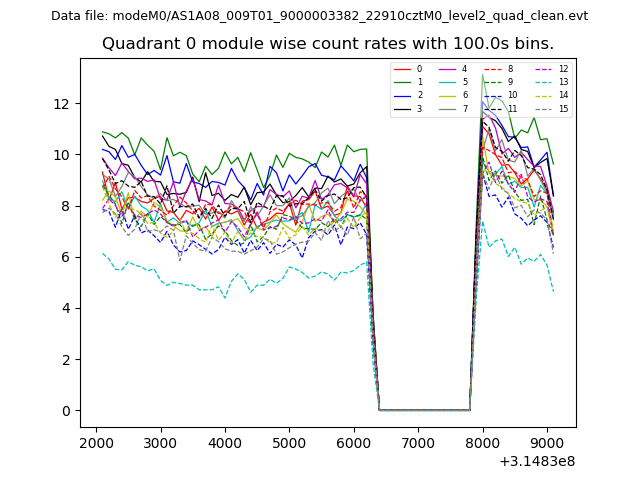 |
 |
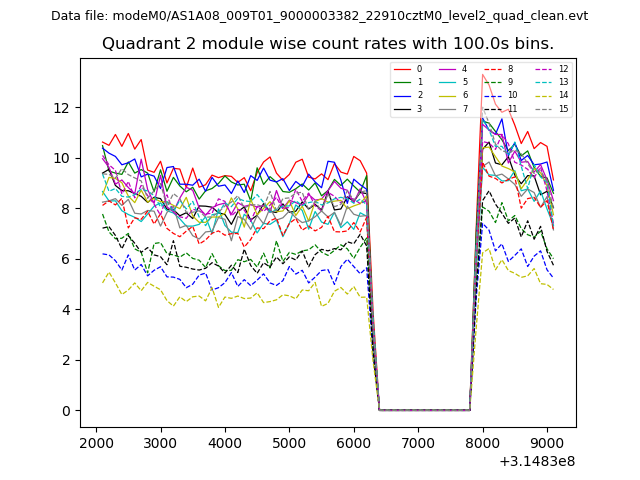
| Module-wise count rates for Quadrant B Data is divided into 100 sec bins |
 |
 |
| Module-wise count rates for Quadrant C Data is divided into 100 sec bins |
 |
 |
| Module-wise count rates for Quadrant D Data is divided into 100 sec bins |
 |
 |
| Parameter | Plot |
|---|---|
| CZT HV Monitor | 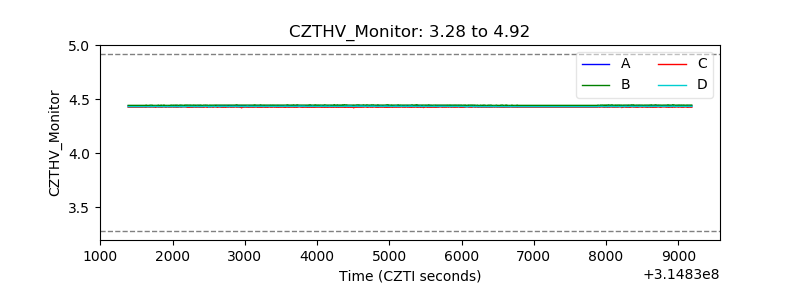 |
| D_VDD | 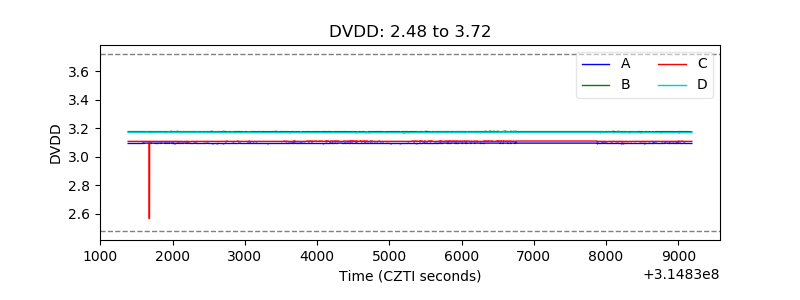 |
| Temperature 1 | 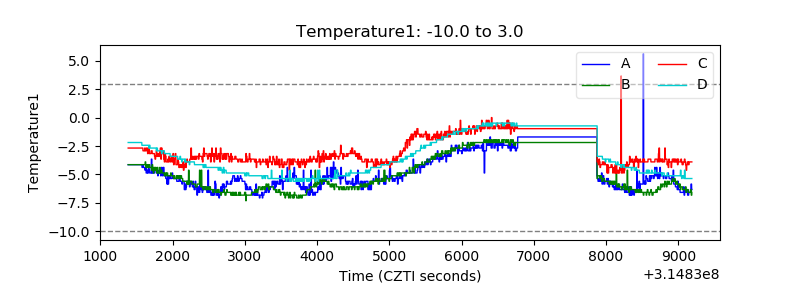 |
| Veto HV Monitor | 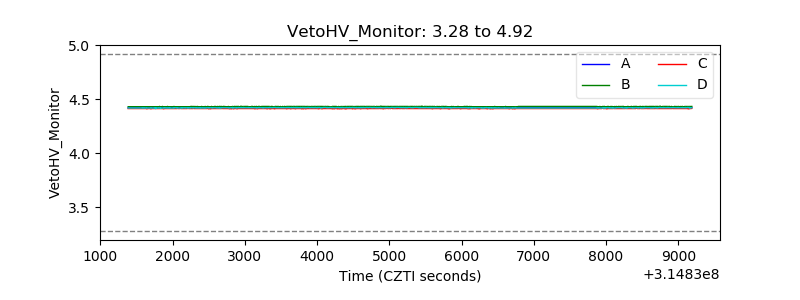 |
| Veto LLD | 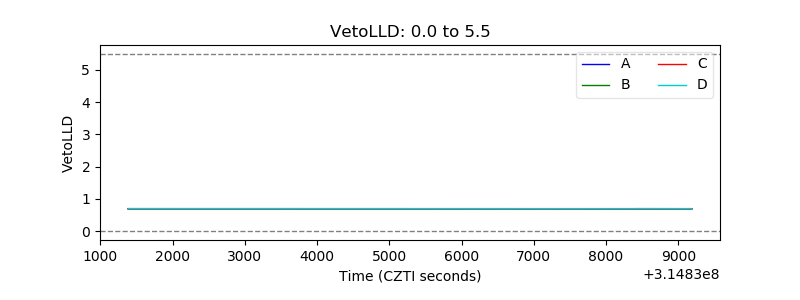 |
| Alpha Counter | 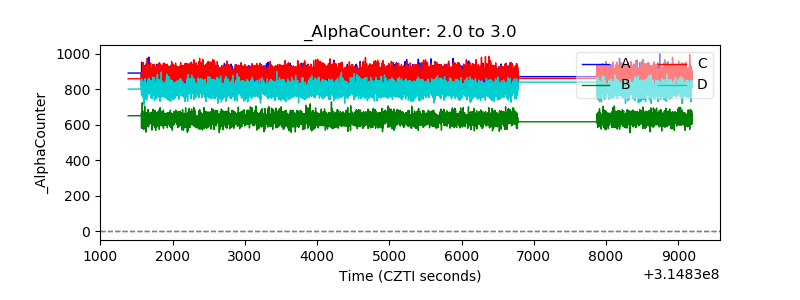 |
| _CPM_Rate | 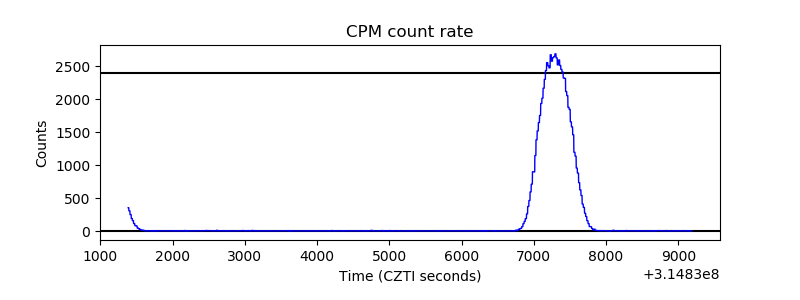 |
| CZT Counter | 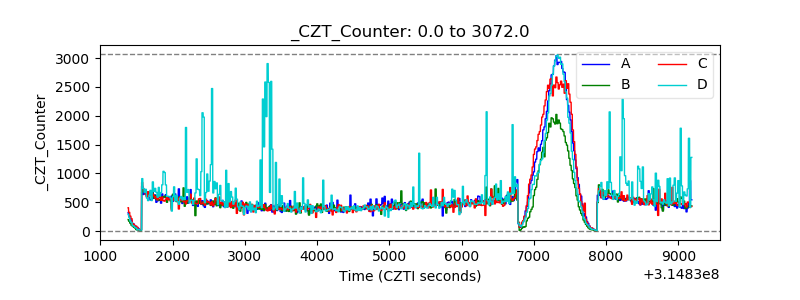 |
| +2.5 Volts monitor |  |
| +5 Volts monitor |  |
| _ROLL_ROT |  |
| _Roll_DEC | 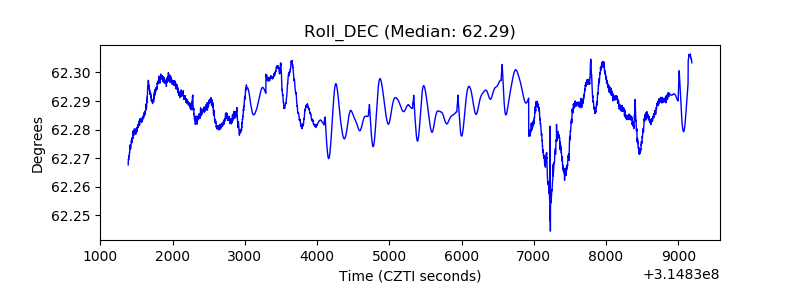 |
| _Roll_RA | 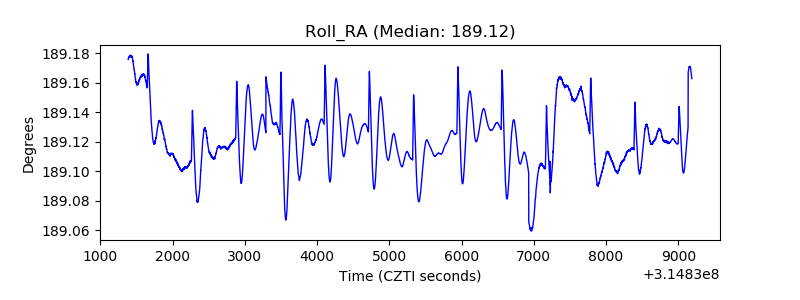 |
| Veto Counter |  |