| Param | Original file | Final file |
|---|---|---|
| Filename | modeM0/AS1A08_009T01_9000003382_22911cztM0_level2.evt | modeM0/AS1A08_009T01_9000003382_22911cztM0_level2_quad_clean.evt |
| Size (bytes) | 488,851,200 | 117,912,960 |
| Size | 466.2 MB | 112.5 MB |
| Events in quadrant A | 3,369,381 | 787,983 |
| Events in quadrant B | 3,211,448 | 815,579 |
| Events in quadrant C | 3,174,731 | 777,148 |
| Events in quadrant D | 4,604,189 | 733,283 |
| Mode M9 | |||
|---|---|---|---|
| Quadrant | BADHDUFLAG | Total packets | Discarded packets |
| A | 0 | 14 | 0 |
| B | 0 | 15 | 0 |
| C | 0 | 15 | 0 |
| D | 0 | 15 | 0 |
| Mode M0 | |||
|---|---|---|---|
| Quadrant | BADHDUFLAG | Total packets | Discarded packets |
| A | 0 | 14301 | 2 |
| B | 0 | 13882 | 2 |
| C | 0 | 13830 | 2 |
| D | 0 | 18351 | 2 |
| Mode SS | |||
|---|---|---|---|
| Quadrant | BADHDUFLAG | Total packets | Discarded packets |
| A | 0 | 134 | 0 |
| B | 0 | 134 | 0 |
| C | 0 | 134 | 0 |
| D | 0 | 134 | 0 |
| Quadrant | Total seconds | Saturated seconds | Saturation percentage |
|---|---|---|---|
| A | 6554 | 104 | 1.586817% |
| B | 6554 | 27 | 0.411962% |
| C | 6554 | 59 | 0.900214% |
| D | 6554 | 264 | 4.028074% |
Noise dominated data is calculated using 1-second bins in cleaned event files. If a bin has >2000 counts, and if more than 50% of those come from <1% of pixels, then it is considered to be noise-dominated and hence unusable.
| Quadrant | # 1 sec bins | Bins with >0 counts | Bins with >2000 counts | High rate bins dominated by noise | Noise dominated (total time) | Noise dominated (detector-on time) | Marked lightcurve |
|---|---|---|---|---|---|---|---|
| A | 7759 | 6555 | 71 | 71 | 0.92% | 1.08% | 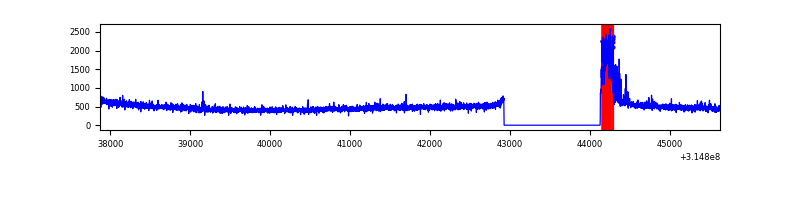 |
| B | 7759 | 6555 | 0 | 0 | 0.00% | 0.00% | 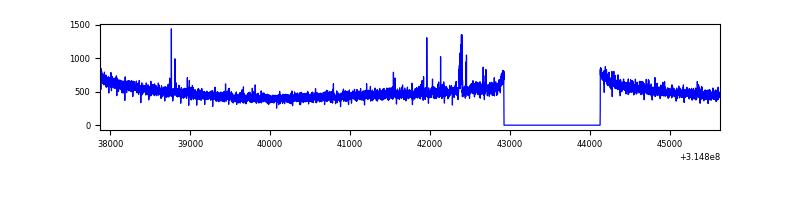 |
| C | 7759 | 6555 | 0 | 0 | 0.00% | 0.00% | 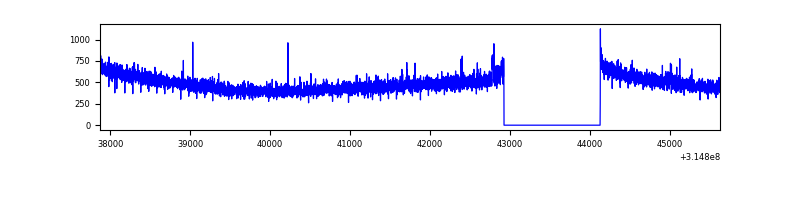 |
| D | 7759 | 6555 | 244 | 244 | 3.14% | 3.72% | 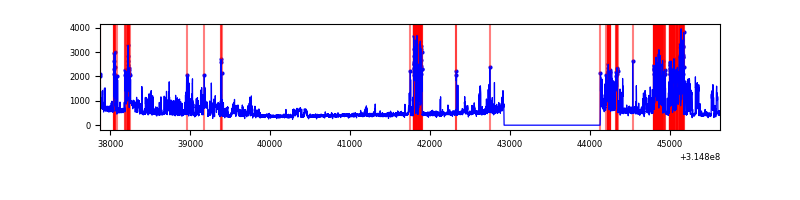 |
Top three noisy pixels from each quadrant. If the there are fewer than three noisy pixels in the level2.evt file, extra rows are filled as -1
| Pixel properties | Quadrant properties | ||||||
|---|---|---|---|---|---|---|---|
| Quadrant | DetID | PixID | Counts | Sigma | Mean | Median | Sigma |
| A | 13 | 252 | 279449 | 1732.84 | 801 | 786 | 160.8 |
| A | 13 | 254 | 10261 | 58.92 | 801 | 786 | 160.8 |
| A | 0 | 226 | 6924 | 38.17 | 801 | 786 | 160.8 |
| B | 0 | 190 | 25043 | 162.52 | 807 | 790 | 149.2 |
| B | 12 | 111 | 17819 | 114.11 | 807 | 790 | 149.2 |
| B | 11 | 111 | 15977 | 101.77 | 807 | 790 | 149.2 |
| C | 14 | 238 | 125384 | 697.02 | 776 | 781 | 178.8 |
| C | 7 | 247 | 16022 | 85.26 | 776 | 781 | 178.8 |
| C | 8 | 208 | 6235 | 30.51 | 776 | 781 | 178.8 |
| D | 1 | 52 | 1310700 | 7063.06 | 763 | 739 | 185.5 |
| D | 13 | 153 | 229376 | 1232.77 | 763 | 739 | 185.5 |
| D | 12 | 233 | 106134 | 568.27 | 763 | 739 | 185.5 |
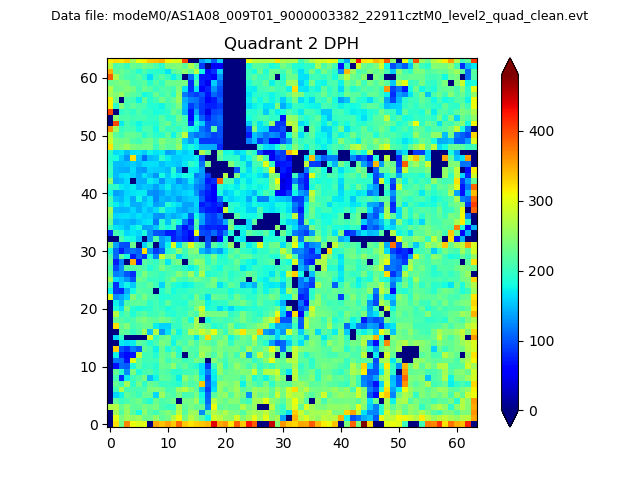
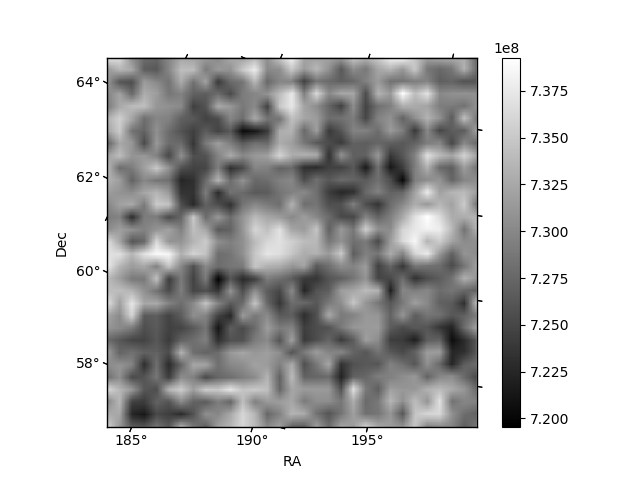
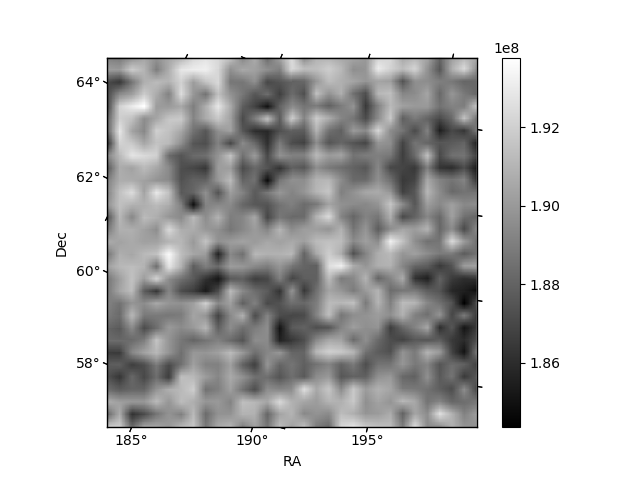
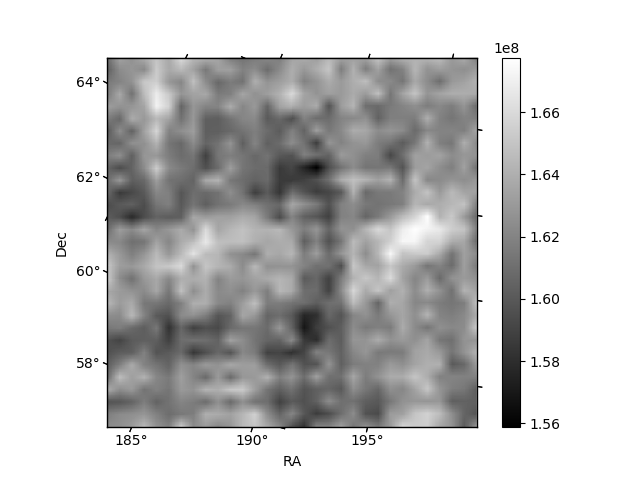
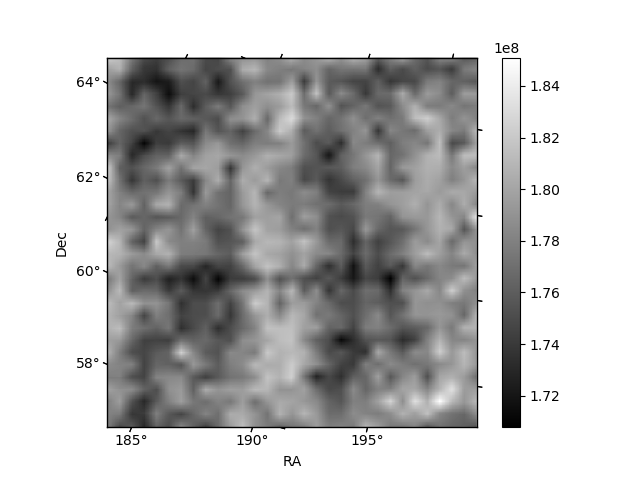
Histogram calculated using DETX and DETY for each event in the final _common_clean file
| Quadrant A | 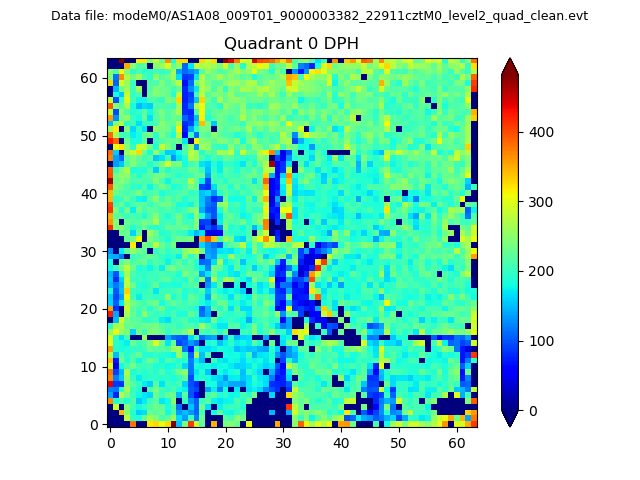 |
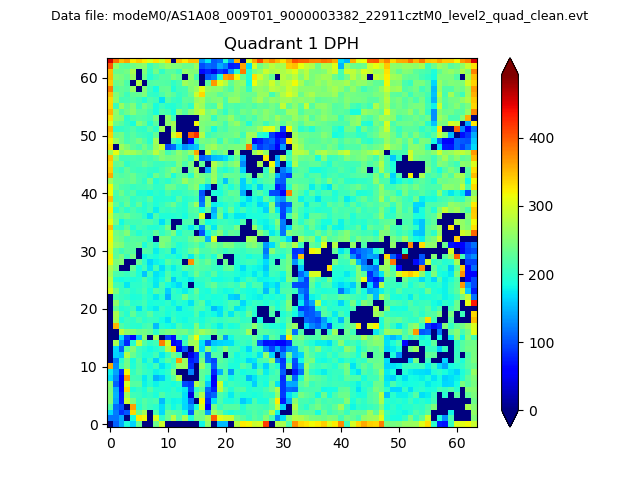 |
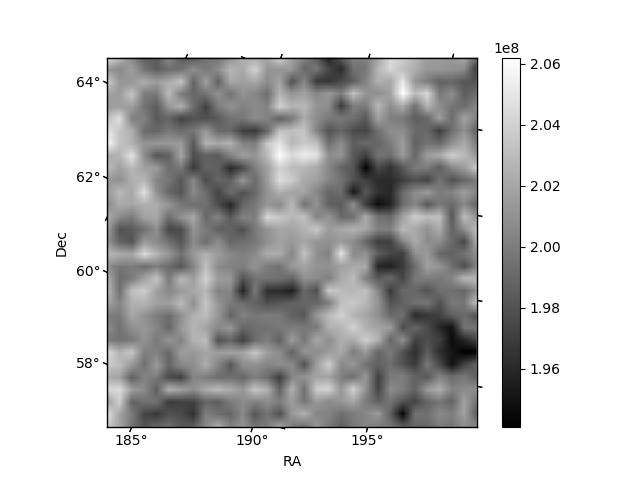
Quadrant B |
|---|---|---|---|
| Quadrant D | 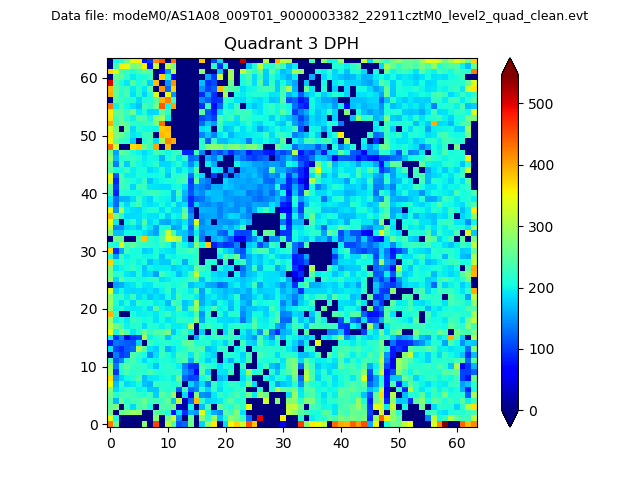 |
 |
Quadrant C |
| Plot type | Count rate plots | Images |
|---|---|---|
| Comparison with Poisson distribution Blue bars denote a histogram of data divided into 1 sec bins. Red curve is a Poisson curve with rate = median count rate of data. |
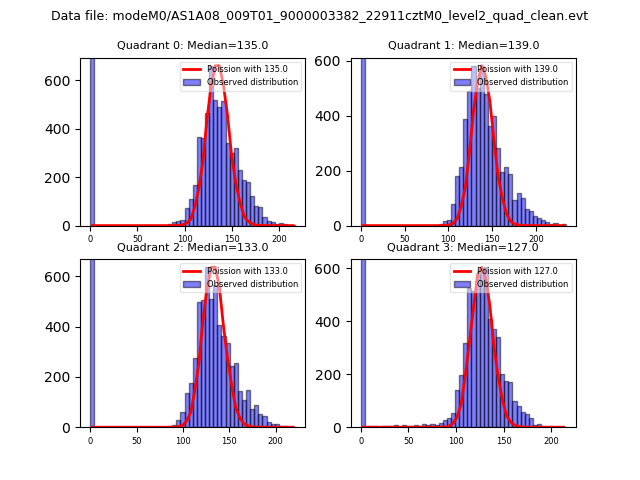 |
 |
| Quadrant-wise count rates Data is divided into 100 sec bins |
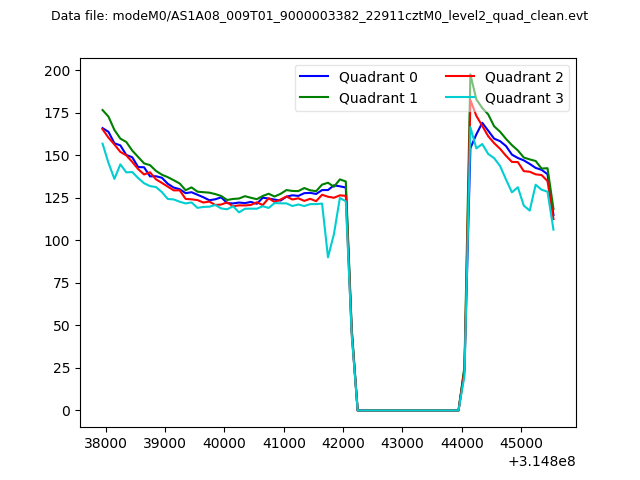 |
|
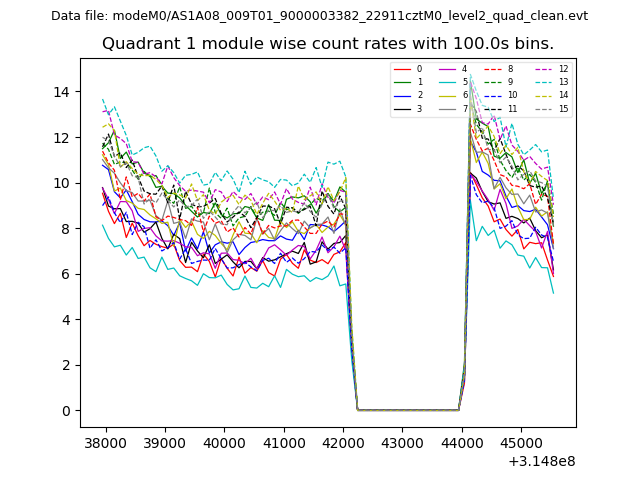
| Module-wise count rates for Quadrant A Data is divided into 100 sec bins |
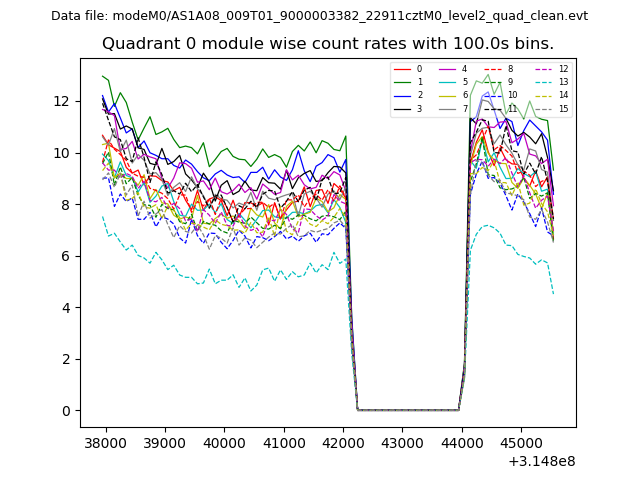 |
 |
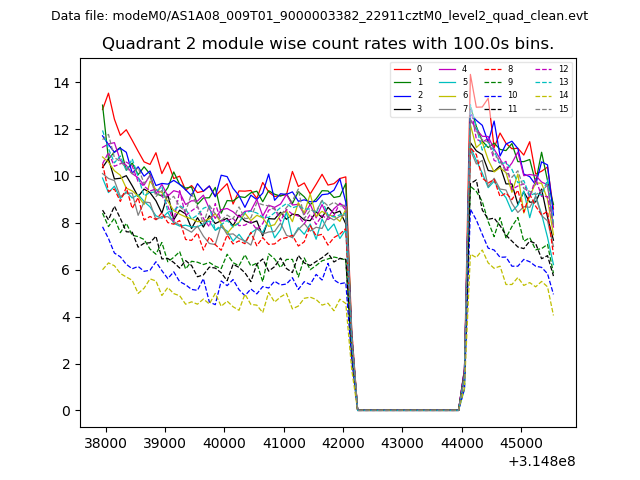
| Module-wise count rates for Quadrant B Data is divided into 100 sec bins |
 |
 |
| Module-wise count rates for Quadrant C Data is divided into 100 sec bins |
 |
 |
| Module-wise count rates for Quadrant D Data is divided into 100 sec bins |
 |
 |
| Parameter | Plot |
|---|---|
| CZT HV Monitor | 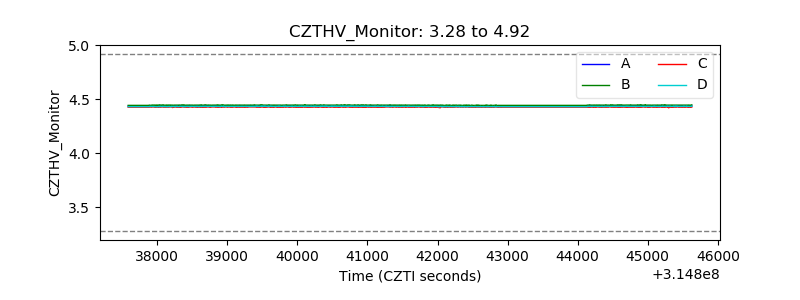 |
| D_VDD | 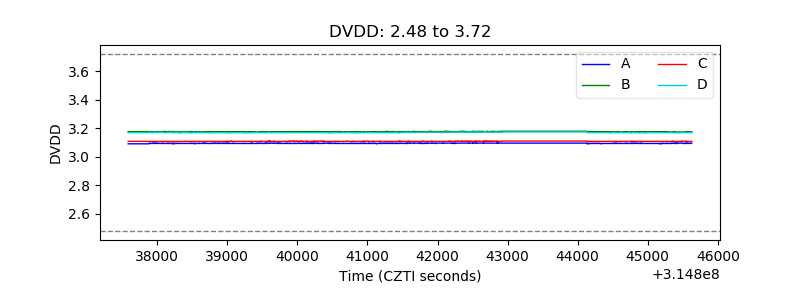 |
| Temperature 1 |  |
| Veto HV Monitor | 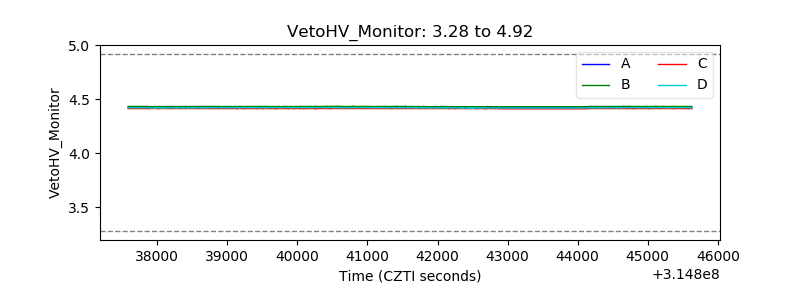 |
| Veto LLD | 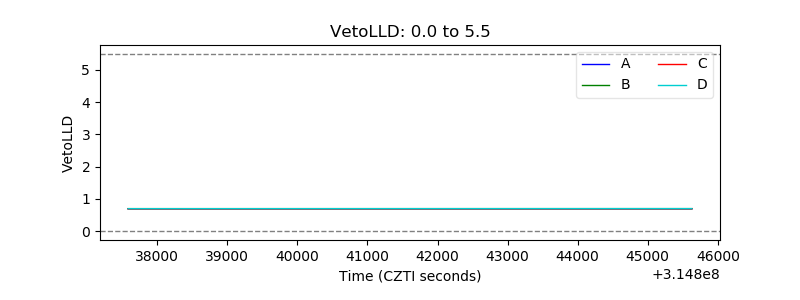 |
| Alpha Counter | 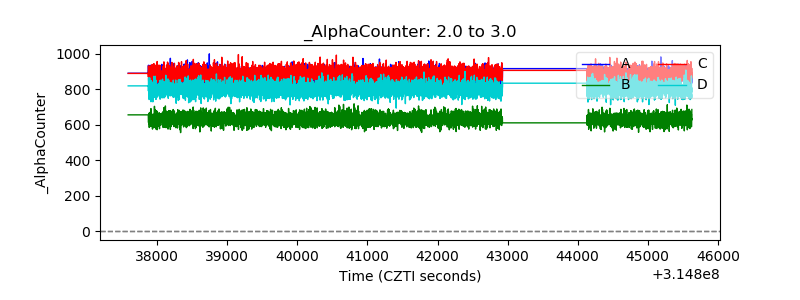 |
| _CPM_Rate | 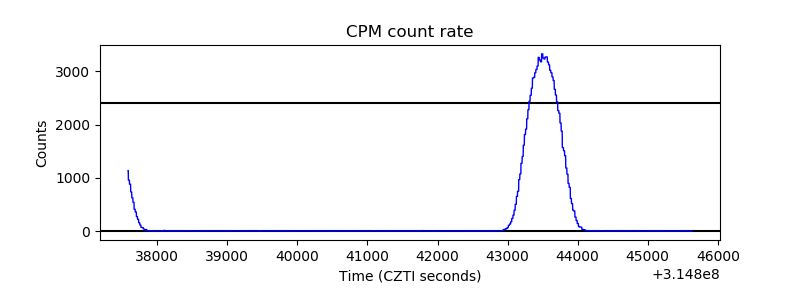 |
| CZT Counter | 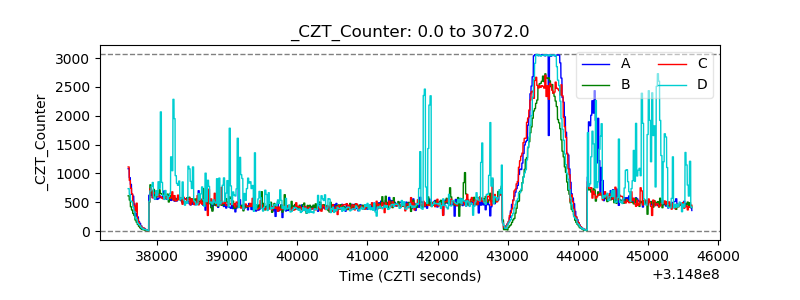 |
| +2.5 Volts monitor |  |
| +5 Volts monitor |  |
| _ROLL_ROT | 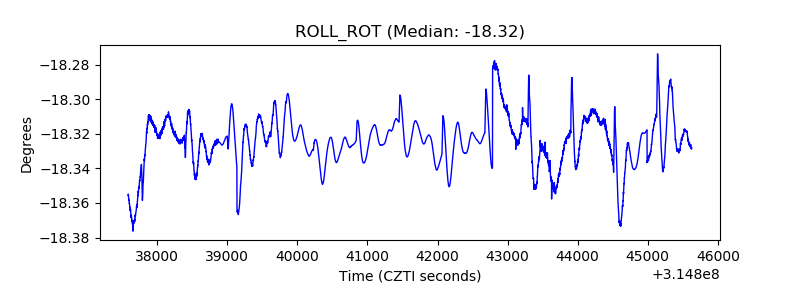 |
| _Roll_DEC |  |
| _Roll_RA | 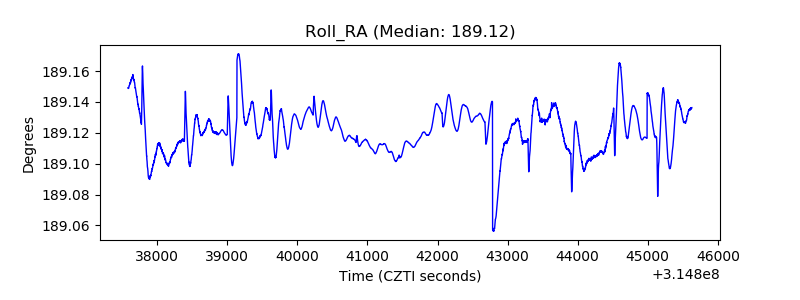 |
| Veto Counter |  |