| Param | Original file | Final file |
|---|---|---|
| Filename | modeM0/AS1A08_009T01_9000003382_22913cztM0_level2.evt | modeM0/AS1A08_009T01_9000003382_22913cztM0_level2_quad_clean.evt |
| Size (bytes) | 479,134,080 | 107,147,520 |
| Size | 456.9 MB | 102.2 MB |
| Events in quadrant A | 3,165,154 | 718,528 |
| Events in quadrant B | 3,265,303 | 736,587 |
| Events in quadrant C | 3,064,360 | 690,175 |
| Events in quadrant D | 4,591,570 | 663,586 |
| Mode M9 | |||
|---|---|---|---|
| Quadrant | BADHDUFLAG | Total packets | Discarded packets |
| A | 0 | 21 | 0 |
| B | 0 | 22 | 0 |
| C | 0 | 22 | 0 |
| D | 0 | 22 | 0 |
| Mode M0 | |||
|---|---|---|---|
| Quadrant | BADHDUFLAG | Total packets | Discarded packets |
| A | 0 | 13199 | 2 |
| B | 0 | 13589 | 3 |
| C | 0 | 13083 | 2 |
| D | 0 | 17964 | 2 |
| Mode SS | |||
|---|---|---|---|
| Quadrant | BADHDUFLAG | Total packets | Discarded packets |
| A | 0 | 126 | 0 |
| B | 0 | 126 | 0 |
| C | 0 | 126 | 0 |
| D | 0 | 126 | 0 |
| Quadrant | Total seconds | Saturated seconds | Saturation percentage |
|---|---|---|---|
| A | 6254 | 6 | 0.095939% |
| B | 6253 | 80 | 1.279386% |
| C | 6253 | 41 | 0.655685% |
| D | 6253 | 356 | 5.693267% |
Noise dominated data is calculated using 1-second bins in cleaned event files. If a bin has >2000 counts, and if more than 50% of those come from <1% of pixels, then it is considered to be noise-dominated and hence unusable.
| Quadrant | # 1 sec bins | Bins with >0 counts | Bins with >2000 counts | High rate bins dominated by noise | Noise dominated (total time) | Noise dominated (detector-on time) | Marked lightcurve |
|---|---|---|---|---|---|---|---|
| A | 7604 | 6255 | 0 | 0 | 0.00% | 0.00% | 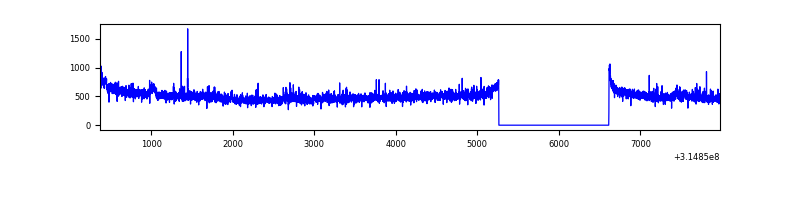 |
| B | 7603 | 6254 | 47 | 47 | 0.62% | 0.75% | 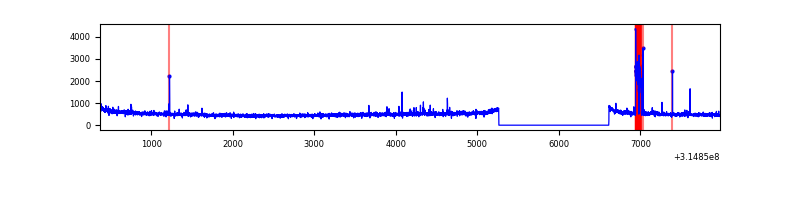 |
| C | 7603 | 6254 | 0 | 0 | 0.00% | 0.00% | 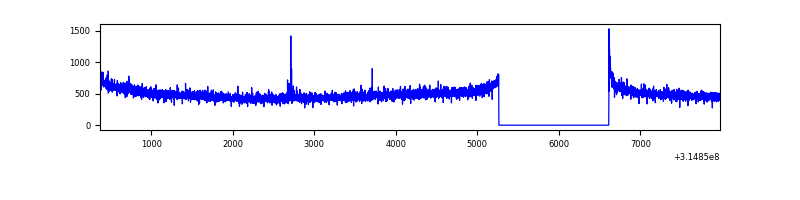 |
| D | 7603 | 6254 | 248 | 248 | 3.26% | 3.97% | 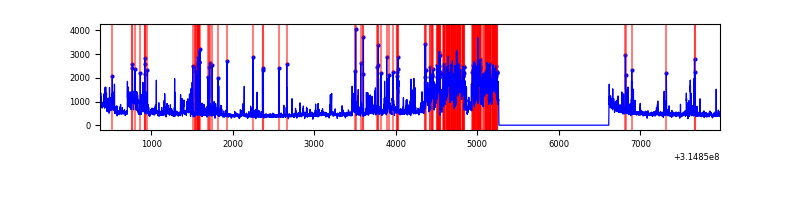 |
Top three noisy pixels from each quadrant. If the there are fewer than three noisy pixels in the level2.evt file, extra rows are filled as -1
| Pixel properties | Quadrant properties | ||||||
|---|---|---|---|---|---|---|---|
| Quadrant | DetID | PixID | Counts | Sigma | Mean | Median | Sigma |
| A | 0 | 23 | 72382 | 456.02 | 791 | 777 | 157.0 |
| A | 13 | 252 | 39264 | 245.11 | 791 | 777 | 157.0 |
| A | 0 | 226 | 10871 | 64.28 | 791 | 777 | 157.0 |
| B | 6 | 36 | 133933 | 908.32 | 788 | 770 | 146.6 |
| B | 12 | 111 | 17053 | 111.07 | 788 | 770 | 146.6 |
| B | 11 | 111 | 14947 | 96.7 | 788 | 770 | 146.6 |
| C | 14 | 238 | 123570 | 718.83 | 746 | 753 | 170.9 |
| C | 7 | 247 | 11550 | 63.19 | 746 | 753 | 170.9 |
| C | 0 | 10 | 9722 | 52.49 | 746 | 753 | 170.9 |
| D | 1 | 52 | 739700 | 4194.0 | 738 | 717 | 176.2 |
| D | 13 | 172 | 662834 | 3757.76 | 738 | 717 | 176.2 |
| D | 13 | 174 | 181055 | 1023.49 | 738 | 717 | 176.2 |
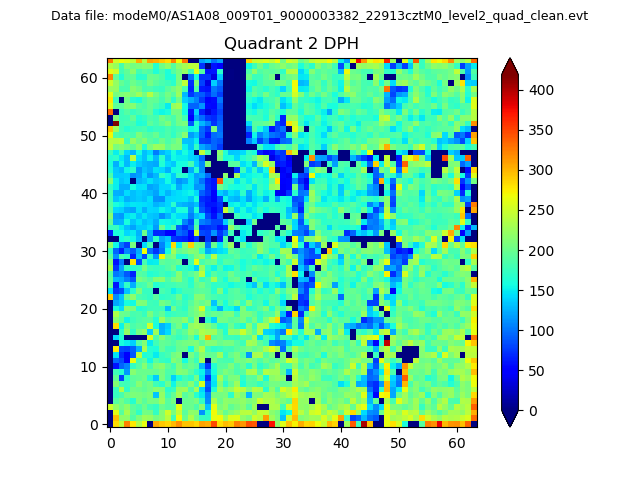
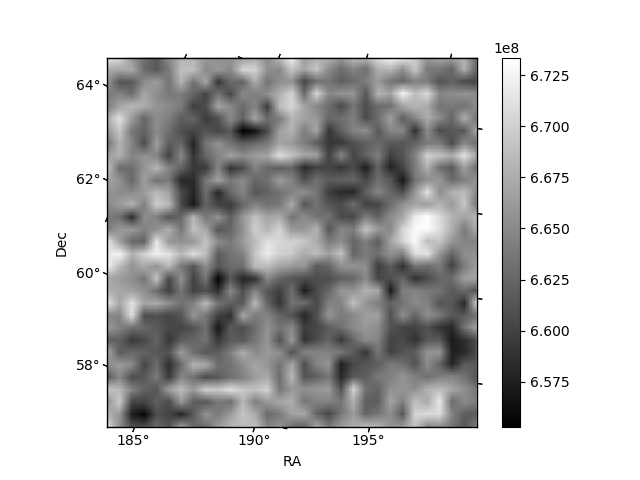
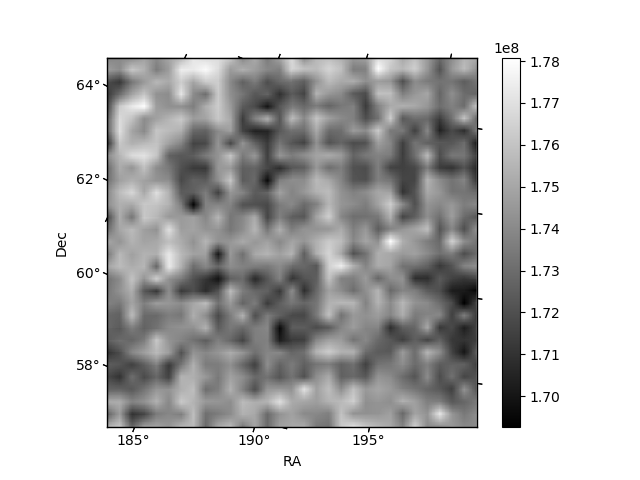
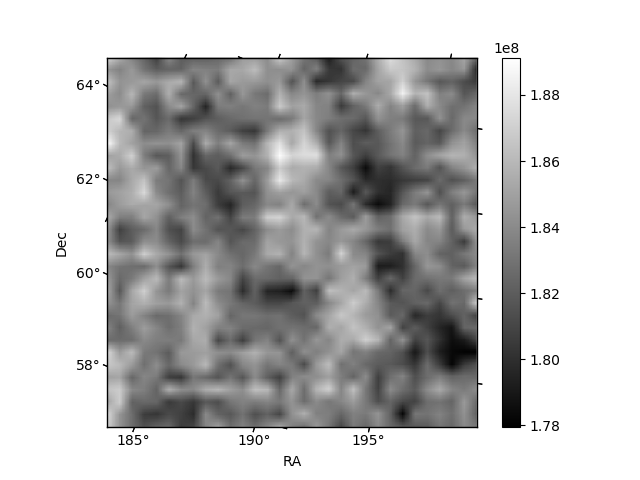
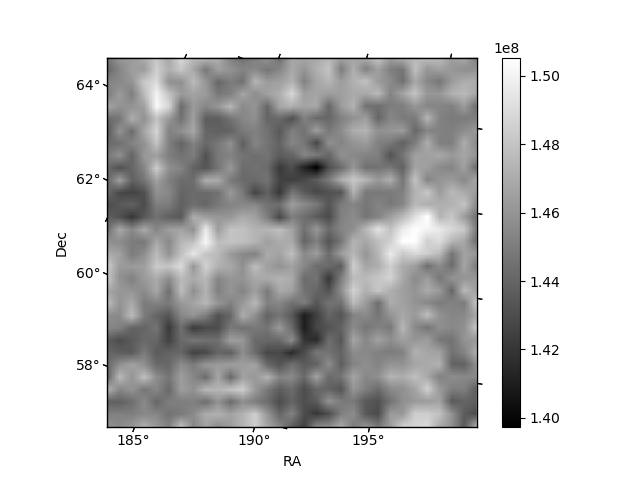
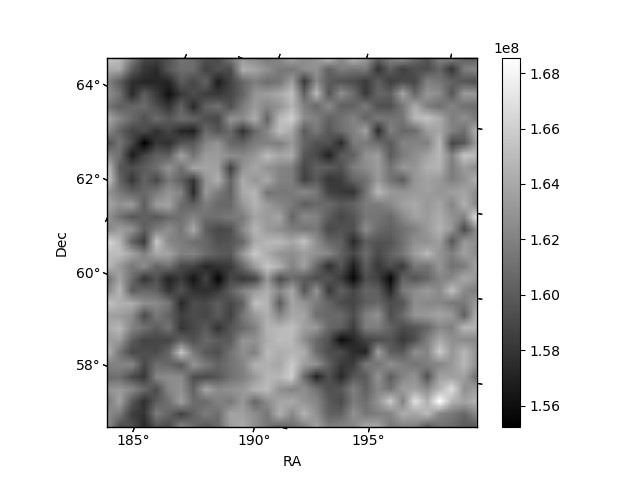
Histogram calculated using DETX and DETY for each event in the final _common_clean file
| Quadrant A | 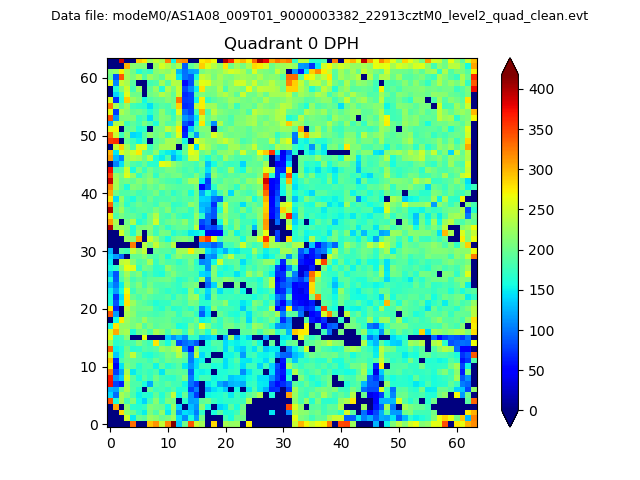 |
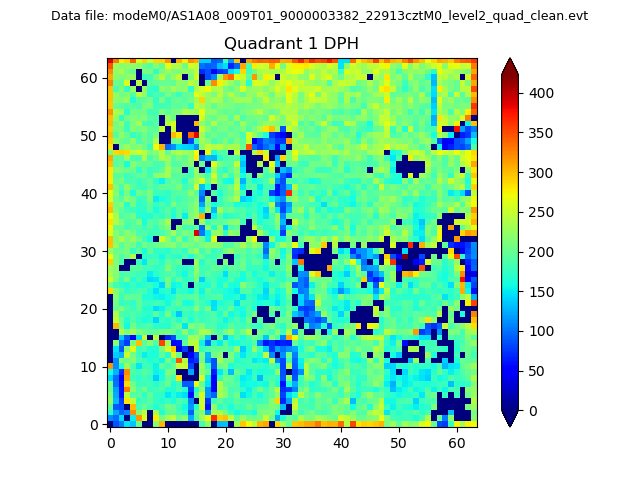 |
Quadrant B |
|---|---|---|---|
| Quadrant D | 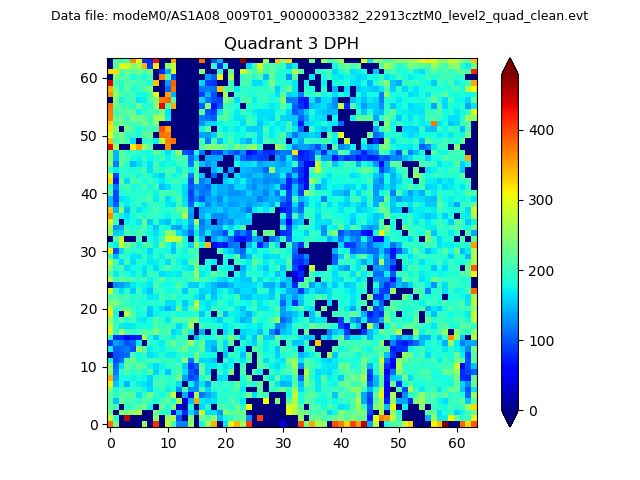 |
 |
Quadrant C |
| Plot type | Count rate plots | Images |
|---|---|---|
| Comparison with Poisson distribution Blue bars denote a histogram of data divided into 1 sec bins. Red curve is a Poisson curve with rate = median count rate of data. |
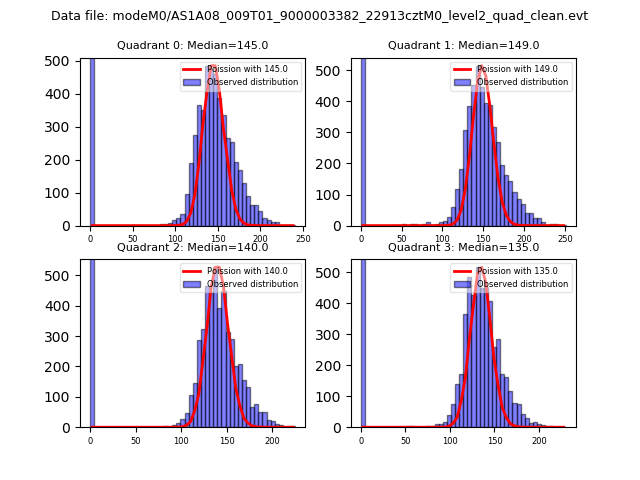 |
 |
| Quadrant-wise count rates Data is divided into 100 sec bins |
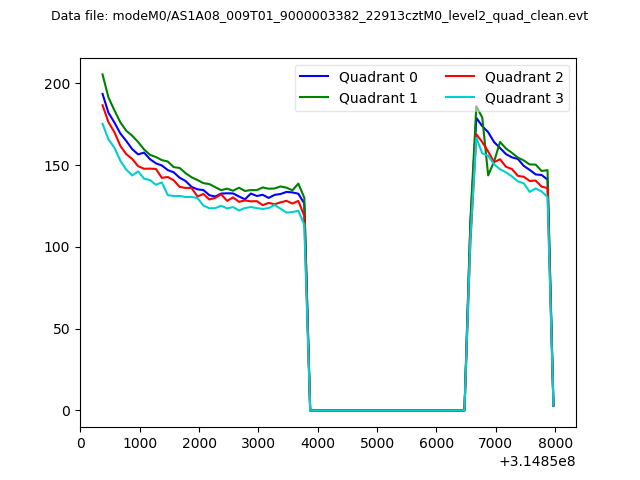 |
|
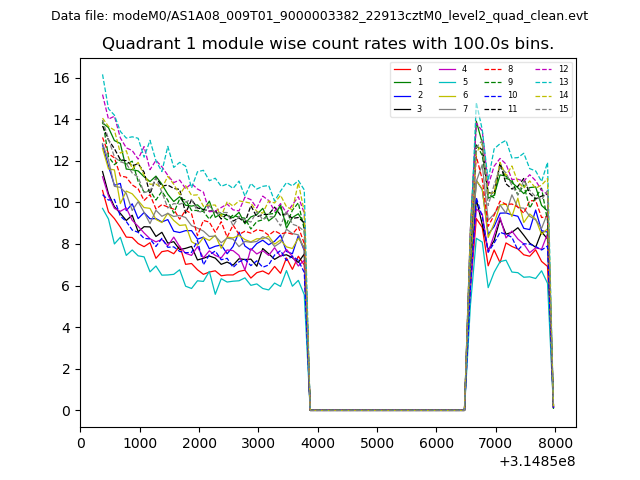
| Module-wise count rates for Quadrant A Data is divided into 100 sec bins |
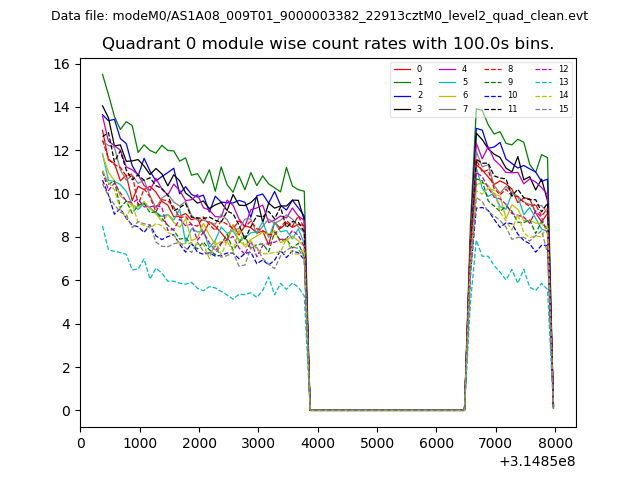 |
 |
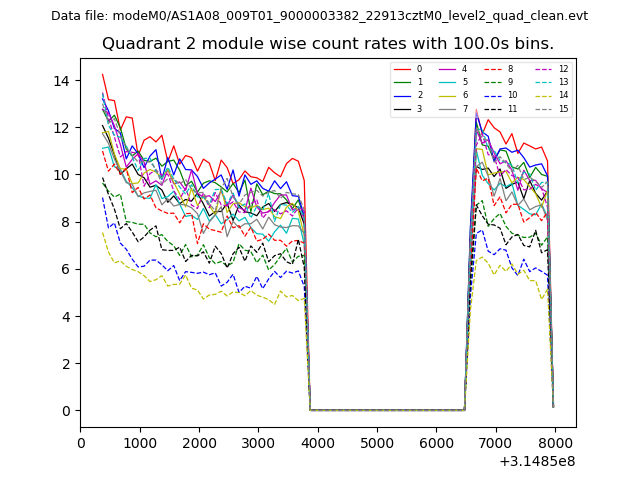
| Module-wise count rates for Quadrant B Data is divided into 100 sec bins |
 |
 |
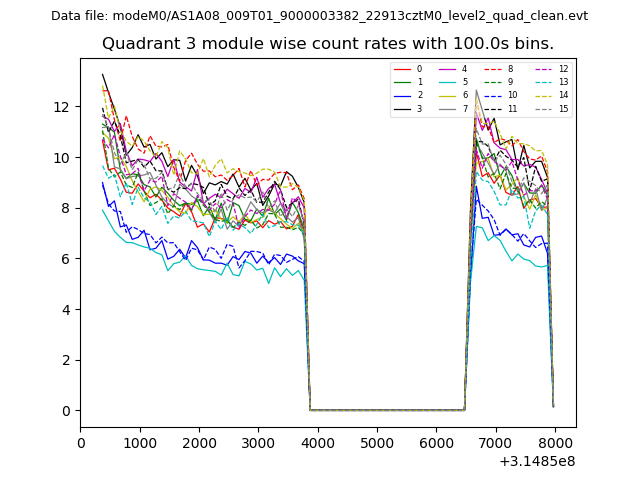
| Module-wise count rates for Quadrant C Data is divided into 100 sec bins |
 |
 |
| Module-wise count rates for Quadrant D Data is divided into 100 sec bins |
 |
 |
| Parameter | Plot |
|---|---|
| CZT HV Monitor | 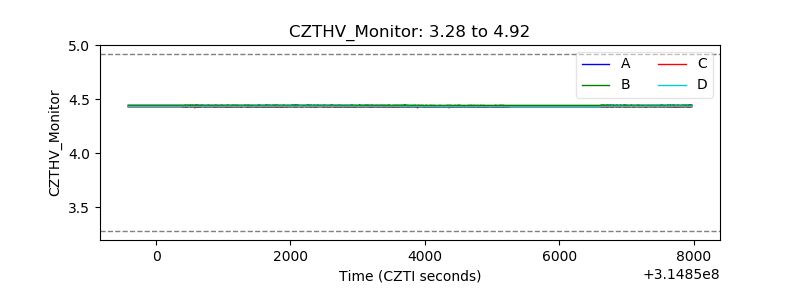 |
| D_VDD | 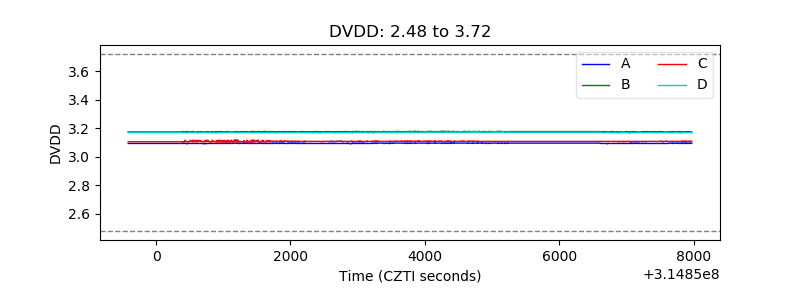 |
| Temperature 1 |  |
| Veto HV Monitor | 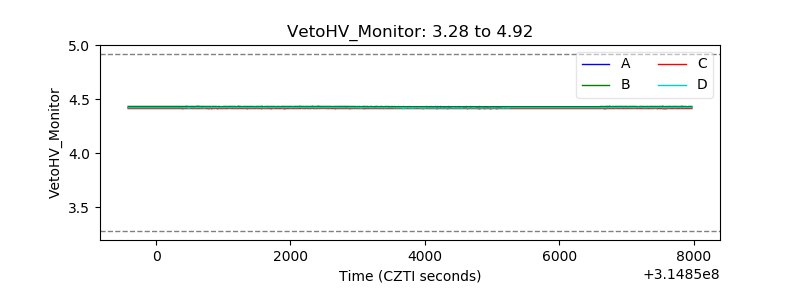 |
| Veto LLD | 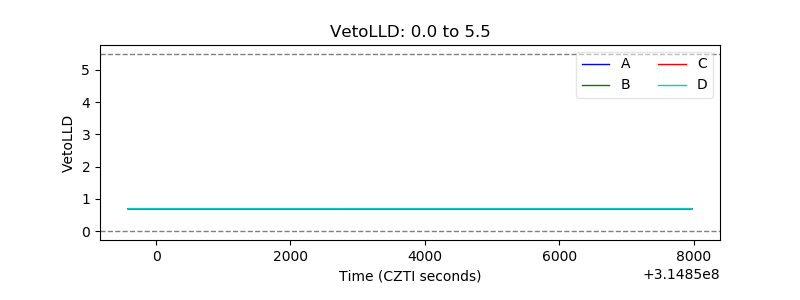 |
| Alpha Counter | 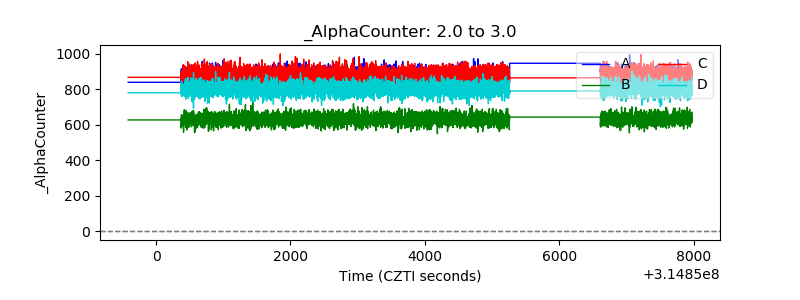 |
| _CPM_Rate | 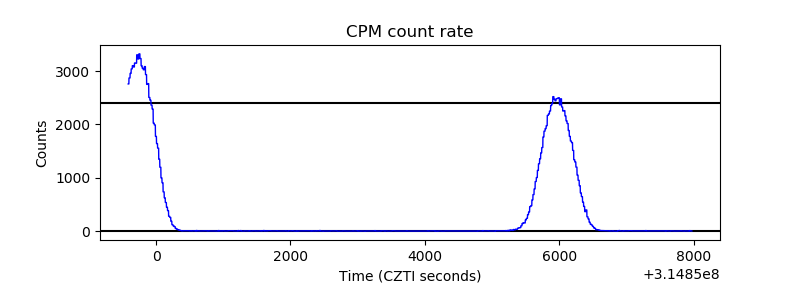 |
| CZT Counter | 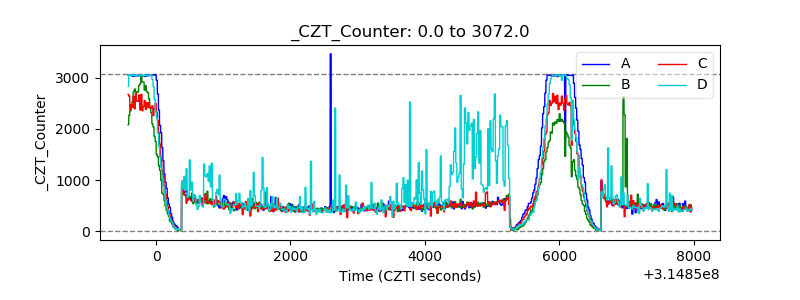 |
| +2.5 Volts monitor |  |
| +5 Volts monitor | 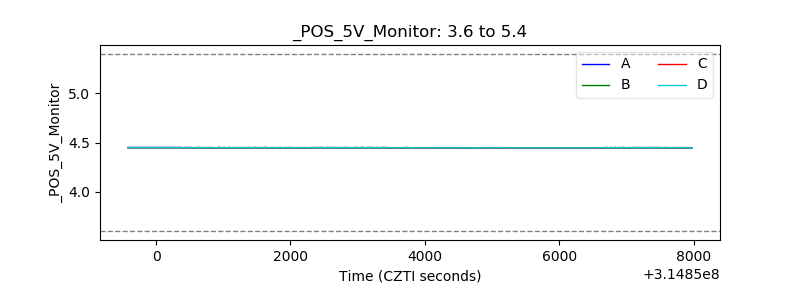 |
| _ROLL_ROT |  |
| _Roll_DEC | 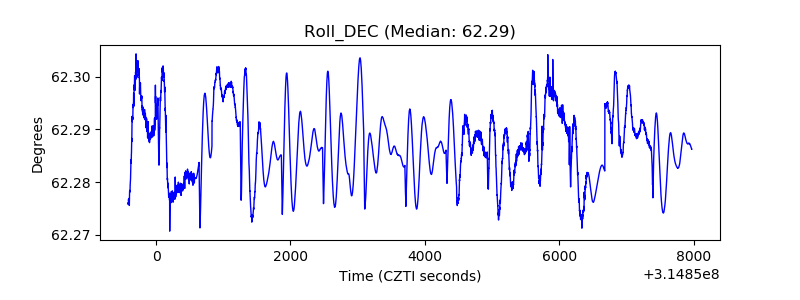 |
| _Roll_RA | 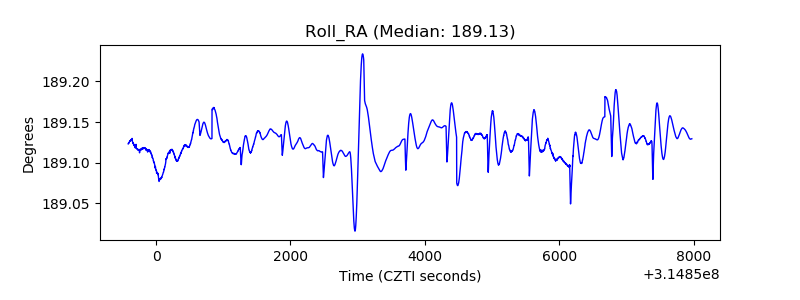 |
| Veto Counter | 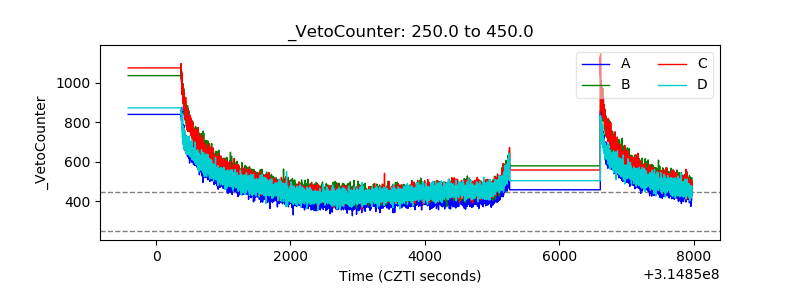 |