| Param | Original file | Final file |
|---|---|---|
| Filename | modeM0/AS1A08_009T01_9000003382_22914cztM0_level2.evt | modeM0/AS1A08_009T01_9000003382_22914cztM0_level2_quad_clean.evt |
| Size (bytes) | 493,004,160 | 101,664,000 |
| Size | 470.2 MB | 97.0 MB |
| Events in quadrant A | 3,074,264 | 680,423 |
| Events in quadrant B | 3,532,064 | 687,786 |
| Events in quadrant C | 3,019,411 | 648,382 |
| Events in quadrant D | 4,877,177 | 622,647 |
| Mode M9 | |||
|---|---|---|---|
| Quadrant | BADHDUFLAG | Total packets | Discarded packets |
| A | 0 | 13 | 0 |
| B | 0 | 13 | 0 |
| C | 0 | 13 | 0 |
| D | 0 | 13 | 0 |
| Mode M0 | |||
|---|---|---|---|
| Quadrant | BADHDUFLAG | Total packets | Discarded packets |
| A | 0 | 12971 | 1 |
| B | 0 | 14367 | 1 |
| C | 0 | 12964 | 1 |
| D | 0 | 18957 | 3 |
| Mode SS | |||
|---|---|---|---|
| Quadrant | BADHDUFLAG | Total packets | Discarded packets |
| A | 0 | 128 | 0 |
| B | 0 | 128 | 0 |
| C | 0 | 128 | 0 |
| D | 0 | 128 | 0 |
| Quadrant | Total seconds | Saturated seconds | Saturation percentage |
|---|---|---|---|
| A | 6301 | 52 | 0.825266% |
| B | 6301 | 130 | 2.063165% |
| C | 6301 | 72 | 1.142676% |
| D | 6301 | 391 | 6.205364% |
Noise dominated data is calculated using 1-second bins in cleaned event files. If a bin has >2000 counts, and if more than 50% of those come from <1% of pixels, then it is considered to be noise-dominated and hence unusable.
| Quadrant | # 1 sec bins | Bins with >0 counts | Bins with >2000 counts | High rate bins dominated by noise | Noise dominated (total time) | Noise dominated (detector-on time) | Marked lightcurve |
|---|---|---|---|---|---|---|---|
| A | 7576 | 6303 | 0 | 0 | 0.00% | 0.00% | 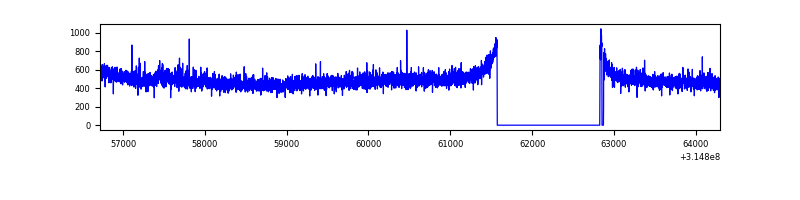 |
| B | 7576 | 6303 | 49 | 49 | 0.65% | 0.78% | 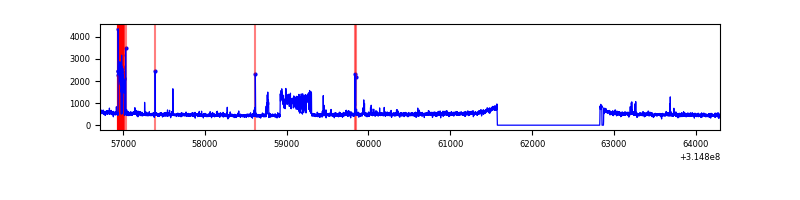 |
| C | 7576 | 6303 | 0 | 0 | 0.00% | 0.00% | 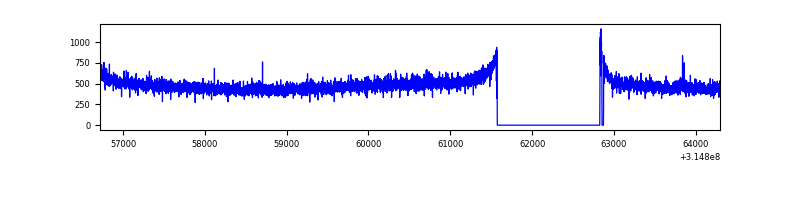 |
| D | 7576 | 6303 | 318 | 318 | 4.20% | 5.05% | 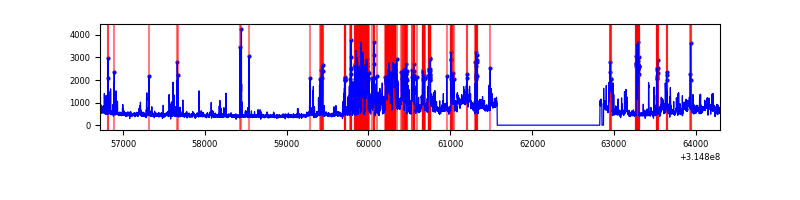 |
Top three noisy pixels from each quadrant. If the there are fewer than three noisy pixels in the level2.evt file, extra rows are filled as -1
| Pixel properties | Quadrant properties | ||||||
|---|---|---|---|---|---|---|---|
| Quadrant | DetID | PixID | Counts | Sigma | Mean | Median | Sigma |
| A | 0 | 23 | 19371 | 118.23 | 790 | 776 | 157.3 |
| A | 13 | 254 | 10389 | 61.12 | 790 | 776 | 157.3 |
| A | 13 | 252 | 10116 | 59.39 | 790 | 776 | 157.3 |
| B | 0 | 197 | 277918 | 1915.27 | 780 | 763 | 144.7 |
| B | 6 | 36 | 137506 | 944.96 | 780 | 763 | 144.7 |
| B | 0 | 230 | 24323 | 162.81 | 780 | 763 | 144.7 |
| C | 14 | 238 | 121448 | 716.51 | 741 | 744 | 168.5 |
| C | 7 | 247 | 6370 | 33.4 | 741 | 744 | 168.5 |
| C | 13 | 61 | 5142 | 26.11 | 741 | 744 | 168.5 |
| D | 1 | 52 | 1251296 | 7085.54 | 738 | 719 | 176.5 |
| D | 12 | 233 | 268948 | 1519.74 | 738 | 719 | 176.5 |
| D | 13 | 174 | 263883 | 1491.04 | 738 | 719 | 176.5 |
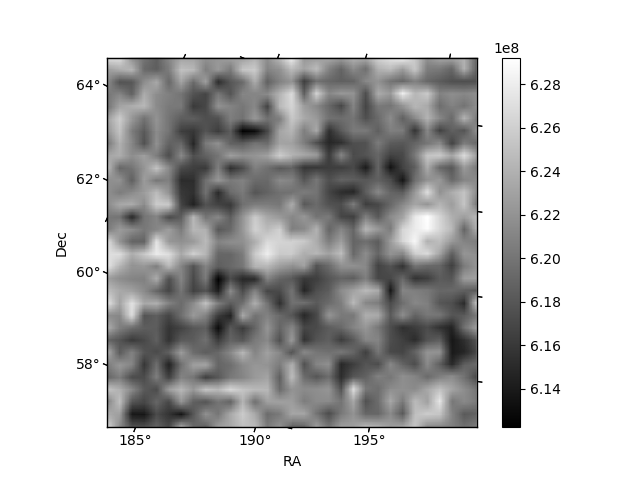
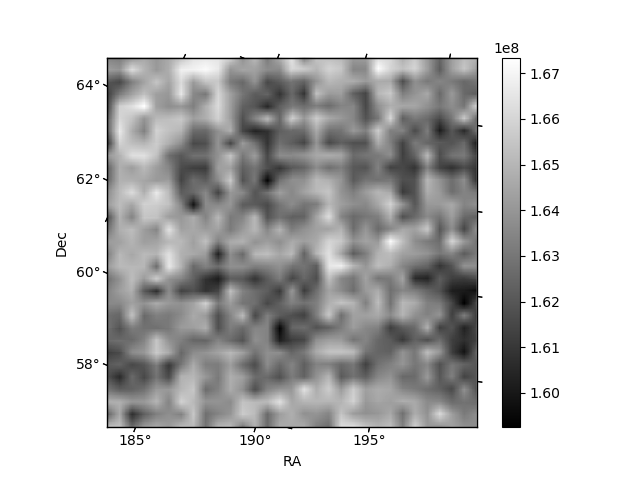
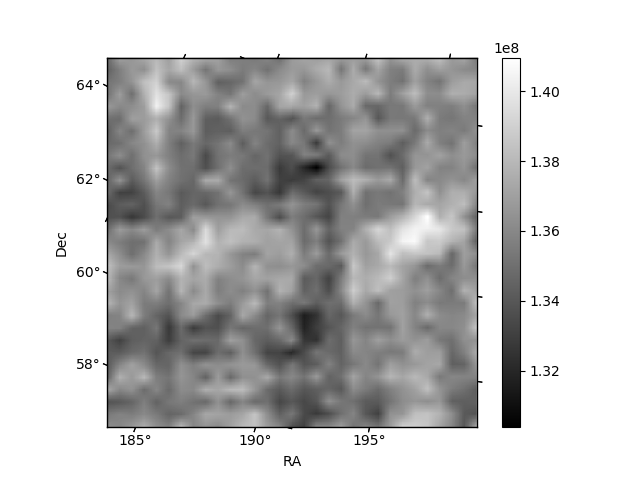
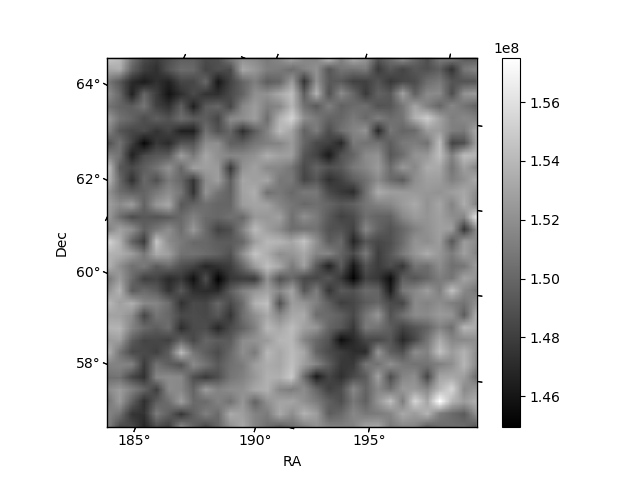
Histogram calculated using DETX and DETY for each event in the final _common_clean file
| Quadrant A | 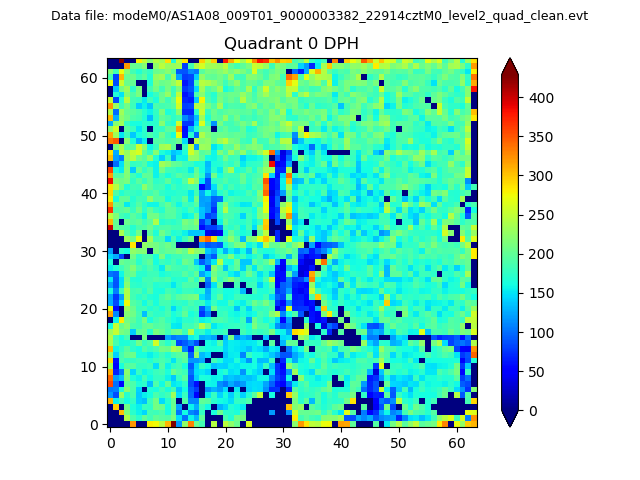 |
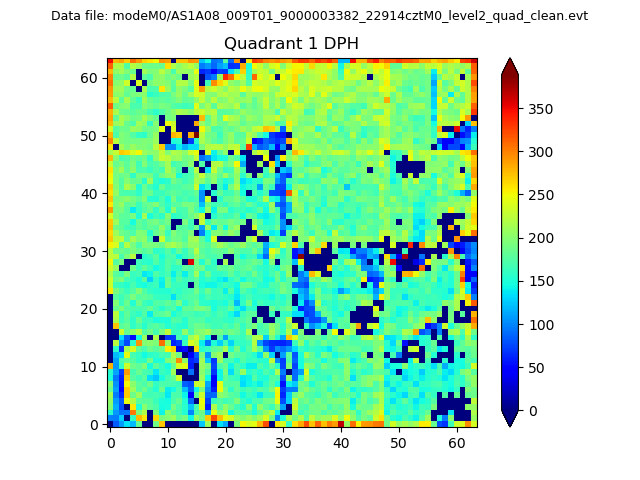 |
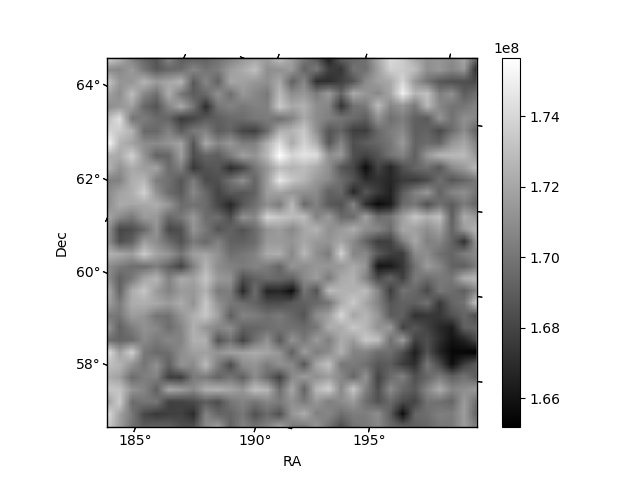
Quadrant B |
|---|---|---|---|
| Quadrant D | 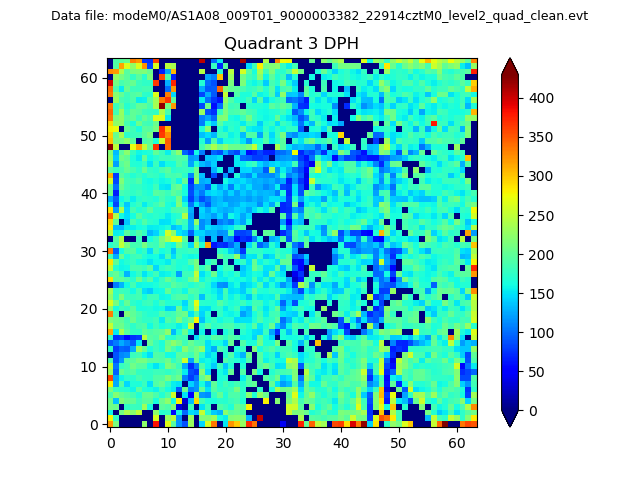 |
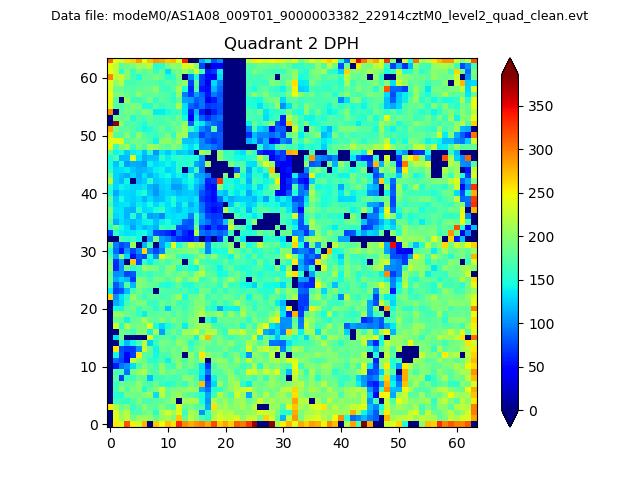 |
Quadrant C |
| Plot type | Count rate plots | Images |
|---|---|---|
| Comparison with Poisson distribution Blue bars denote a histogram of data divided into 1 sec bins. Red curve is a Poisson curve with rate = median count rate of data. |
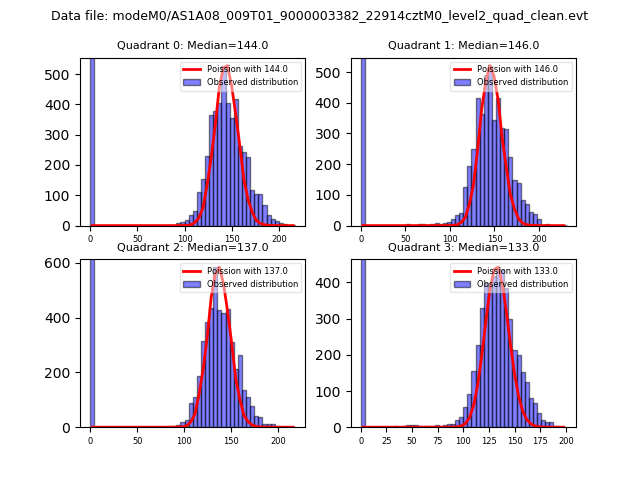 |
 |
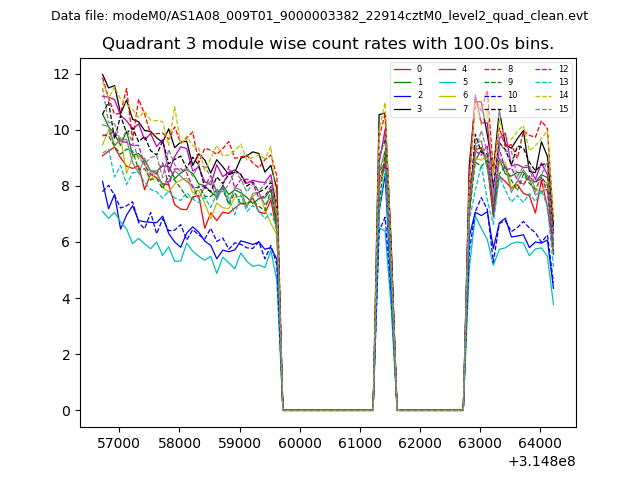
| Quadrant-wise count rates Data is divided into 100 sec bins |
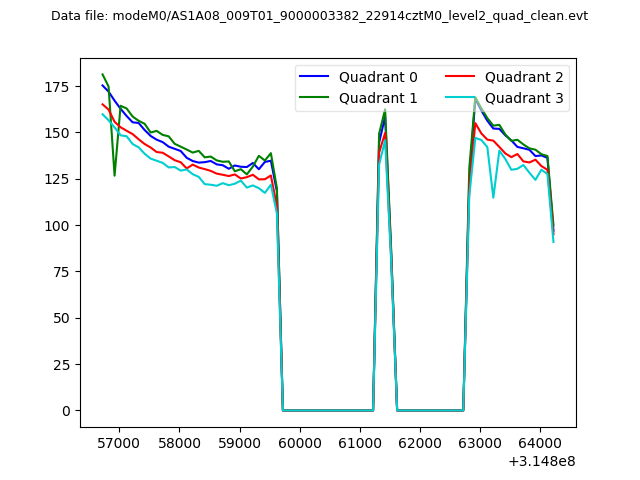 |
|
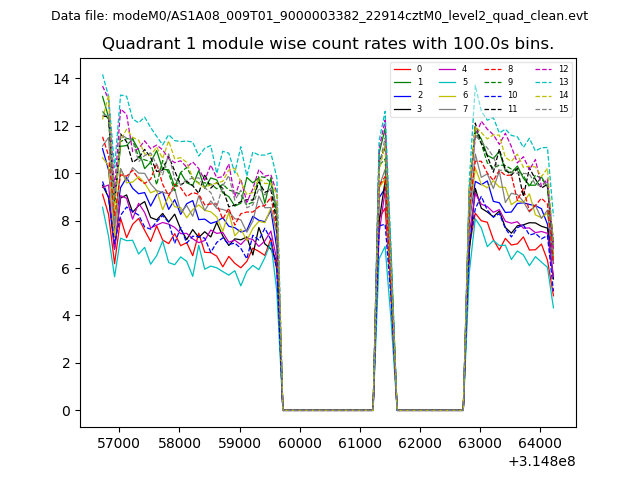
| Module-wise count rates for Quadrant A Data is divided into 100 sec bins |
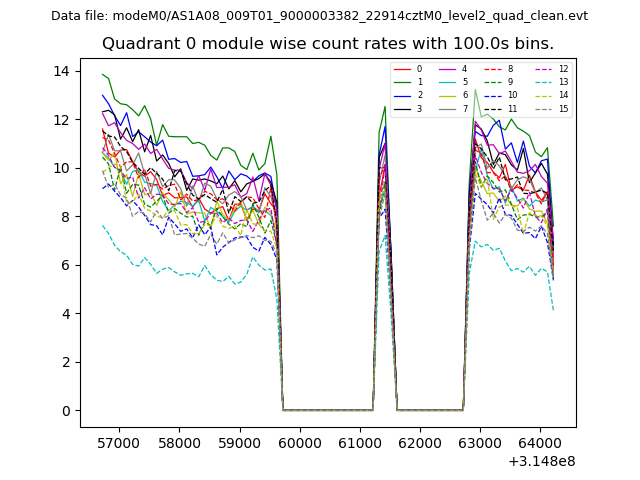 |
 |
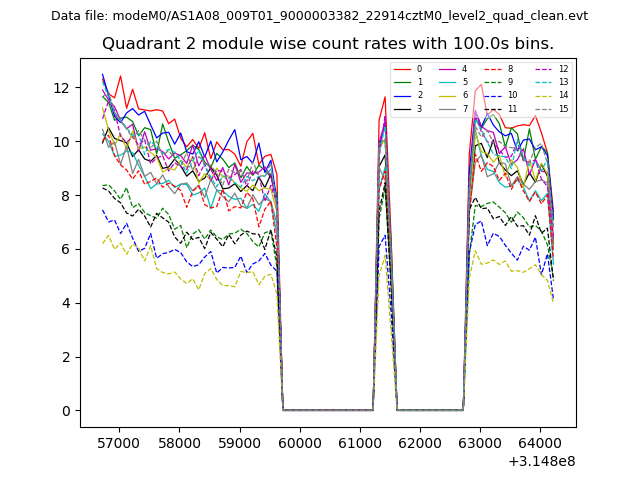
| Module-wise count rates for Quadrant B Data is divided into 100 sec bins |
 |
 |
| Module-wise count rates for Quadrant C Data is divided into 100 sec bins |
 |
 |
| Module-wise count rates for Quadrant D Data is divided into 100 sec bins |
 |
 |
| Parameter | Plot |
|---|---|
| CZT HV Monitor | 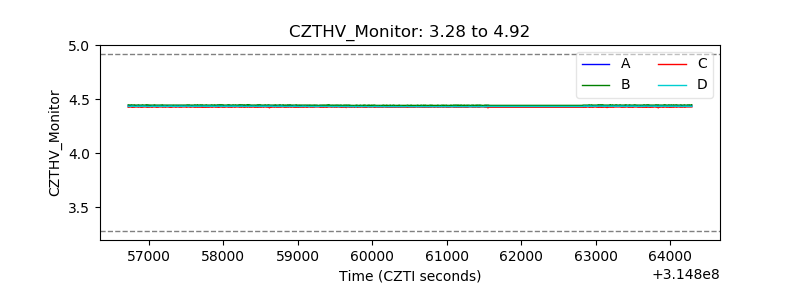 |
| D_VDD | 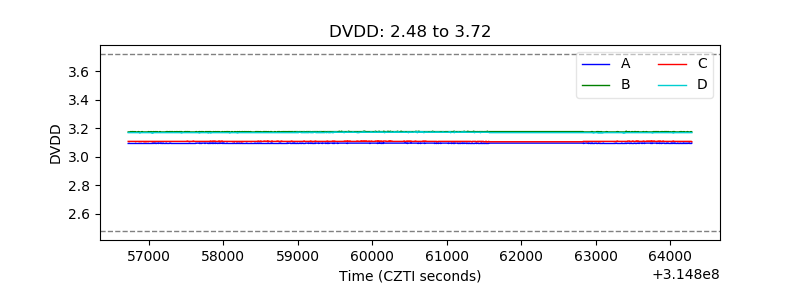 |
| Temperature 1 | 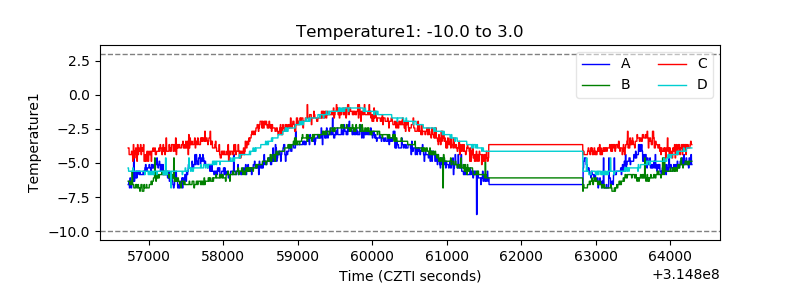 |
| Veto HV Monitor | 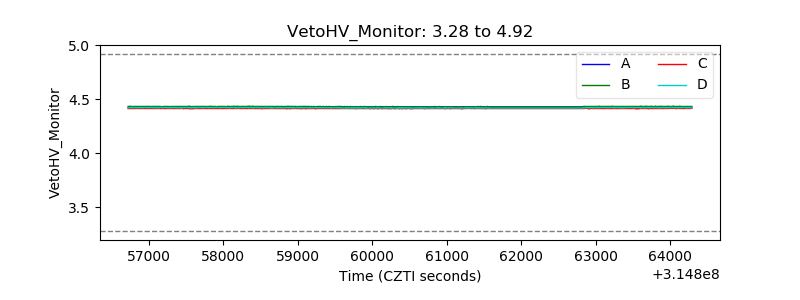 |
| Veto LLD |  |
| Alpha Counter | 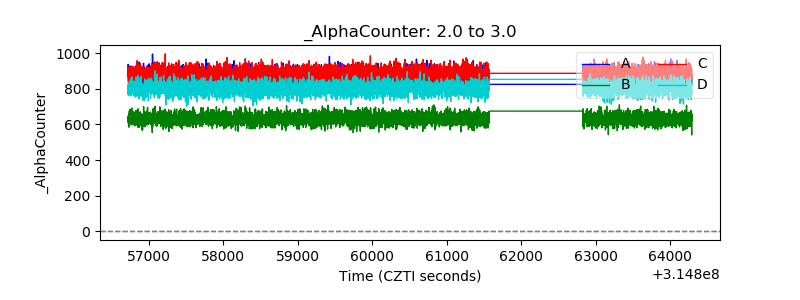 |
| _CPM_Rate | 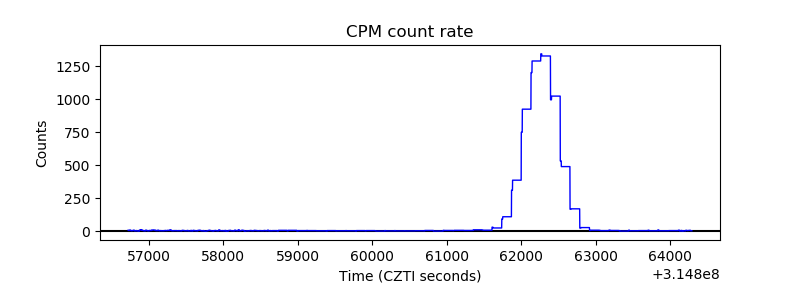 |
| CZT Counter | 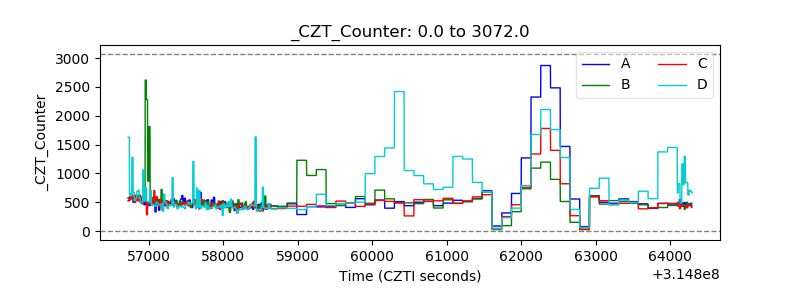 |
| +2.5 Volts monitor |  |
| +5 Volts monitor |  |
| _ROLL_ROT | 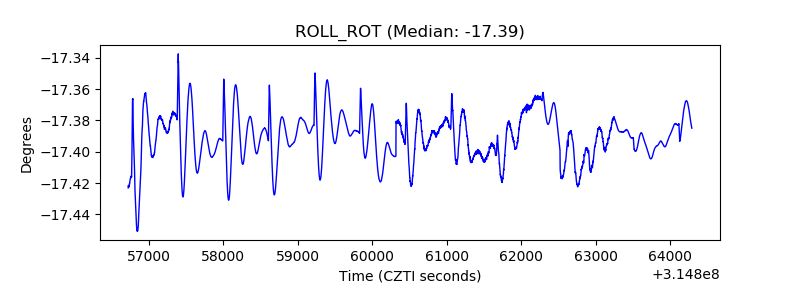 |
| _Roll_DEC | 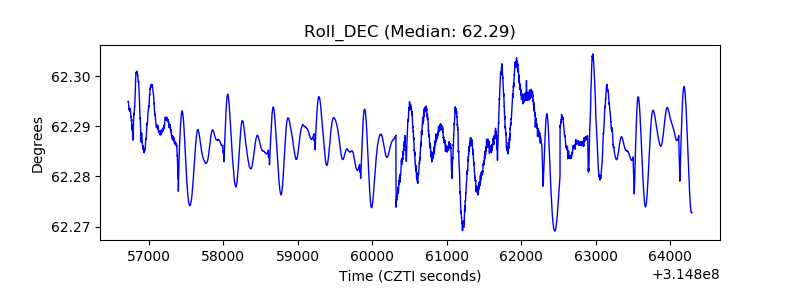 |
| _Roll_RA | 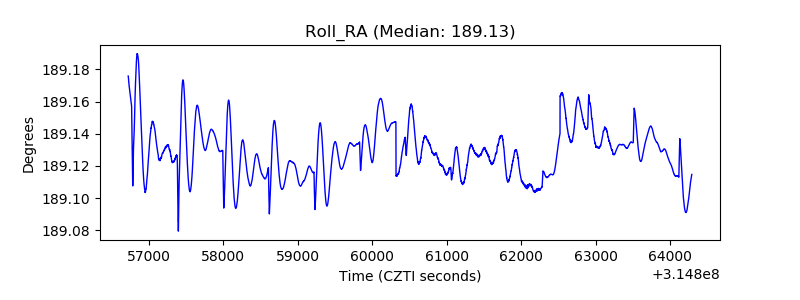 |
| Veto Counter | 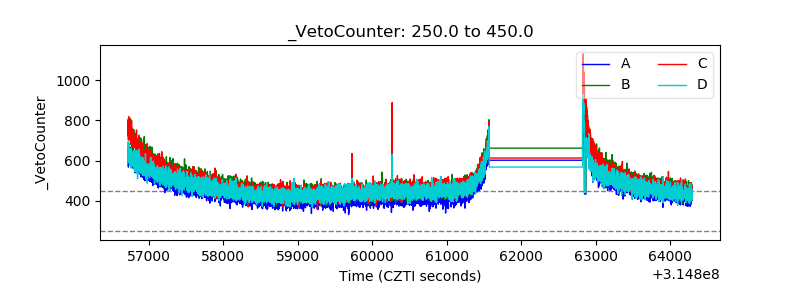 |