| Param | Original file | Final file |
|---|---|---|
| Filename | modeM0/AS1A08_009T01_9000003382_22917cztM0_level2.evt | modeM0/AS1A08_009T01_9000003382_22917cztM0_level2_quad_clean.evt |
| Size (bytes) | 331,931,520 | 55,105,920 |
| Size | 316.6 MB | 52.6 MB |
| Events in quadrant A | 1,981,110 | 347,783 |
| Events in quadrant B | 2,030,866 | 351,912 |
| Events in quadrant C | 2,039,378 | 337,332 |
| Events in quadrant D | 3,701,320 | 321,571 |
| Mode M0 | |||
|---|---|---|---|
| Quadrant | BADHDUFLAG | Total packets | Discarded packets |
| A | 0 | 8840 | 0 |
| B | 0 | 8912 | 0 |
| C | 0 | 8871 | 0 |
| D | 0 | 14094 | 0 |
| Mode SS | |||
|---|---|---|---|
| Quadrant | BADHDUFLAG | Total packets | Discarded packets |
| A | 0 | 88 | 0 |
| B | 0 | 88 | 0 |
| C | 0 | 88 | 0 |
| D | 0 | 88 | 0 |
| Quadrant | Total seconds | Saturated seconds | Saturation percentage |
|---|---|---|---|
| A | 4400 | 3 | 0.068182% |
| B | 4401 | 4 | 0.090888% |
| C | 4401 | 10 | 0.227221% |
| D | 4401 | 232 | 5.271529% |
Noise dominated data is calculated using 1-second bins in cleaned event files. If a bin has >2000 counts, and if more than 50% of those come from <1% of pixels, then it is considered to be noise-dominated and hence unusable.
| Quadrant | # 1 sec bins | Bins with >0 counts | Bins with >2000 counts | High rate bins dominated by noise | Noise dominated (total time) | Noise dominated (detector-on time) | Marked lightcurve |
|---|---|---|---|---|---|---|---|
| A | 4400 | 4400 | 0 | 0 | 0.00% | 0.00% | 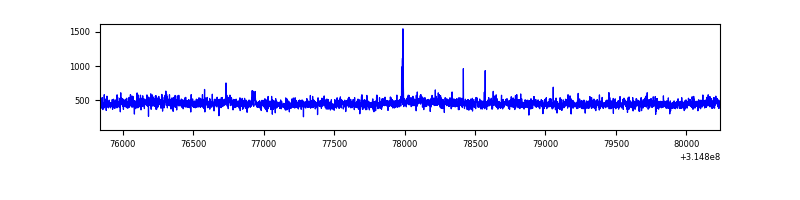 |
| B | 4401 | 4401 | 2 | 2 | 0.05% | 0.05% | 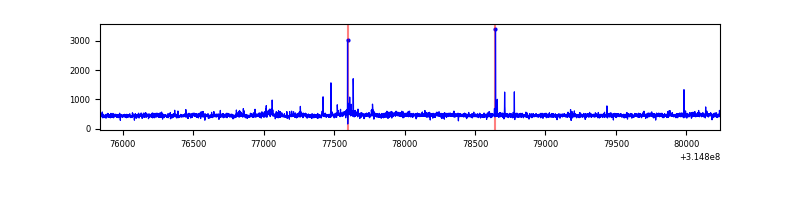 |
| C | 4401 | 4401 | 0 | 0 | 0.00% | 0.00% | 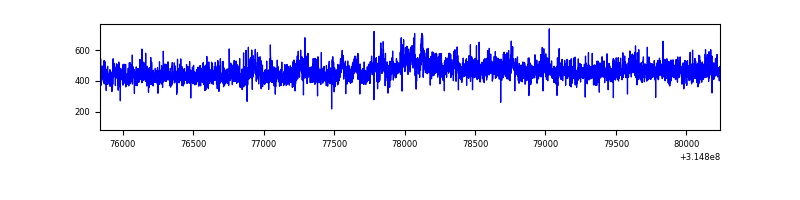 |
| D | 4401 | 4401 | 219 | 219 | 4.98% | 4.98% | 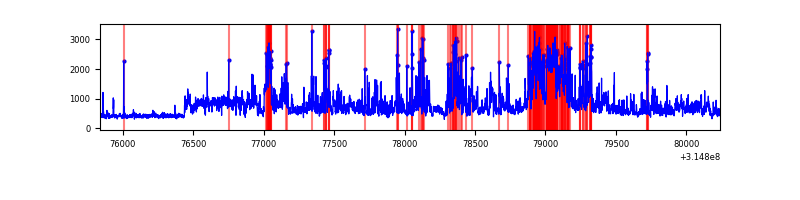 |
Top three noisy pixels from each quadrant. If the there are fewer than three noisy pixels in the level2.evt file, extra rows are filled as -1
| Pixel properties | Quadrant properties | ||||||
|---|---|---|---|---|---|---|---|
| Quadrant | DetID | PixID | Counts | Sigma | Mean | Median | Sigma |
| A | 13 | 252 | 18883 | 178.15 | 504 | 493 | 103.2 |
| A | 2 | 79 | 15622 | 146.56 | 504 | 493 | 103.2 |
| A | 13 | 254 | 7719 | 70.0 | 504 | 493 | 103.2 |
| B | 3 | 64 | 14086 | 142.95 | 497 | 484 | 95.1 |
| B | 4 | 216 | 11589 | 116.71 | 497 | 484 | 95.1 |
| B | 0 | 190 | 11437 | 115.11 | 497 | 484 | 95.1 |
| C | 6 | 80 | 87227 | 775.24 | 479 | 482 | 111.9 |
| C | 14 | 238 | 77127 | 684.98 | 479 | 482 | 111.9 |
| C | 13 | 61 | 3397 | 26.05 | 479 | 482 | 111.9 |
| D | 1 | 52 | 555633 | 4747.34 | 480 | 465 | 116.9 |
| D | 13 | 174 | 540101 | 4614.52 | 480 | 465 | 116.9 |
| D | 13 | 172 | 458823 | 3919.5 | 480 | 465 | 116.9 |
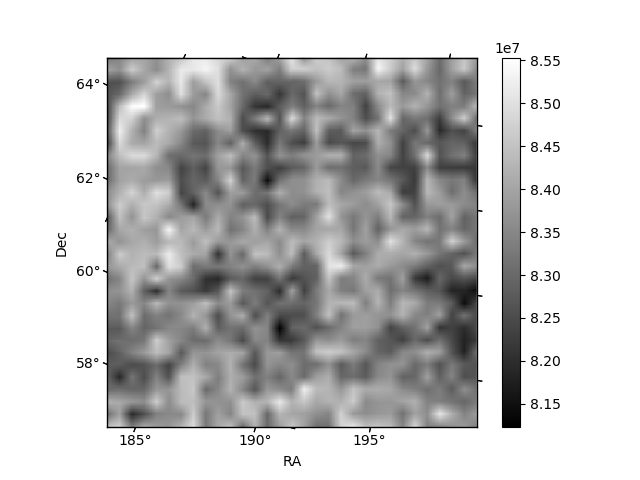
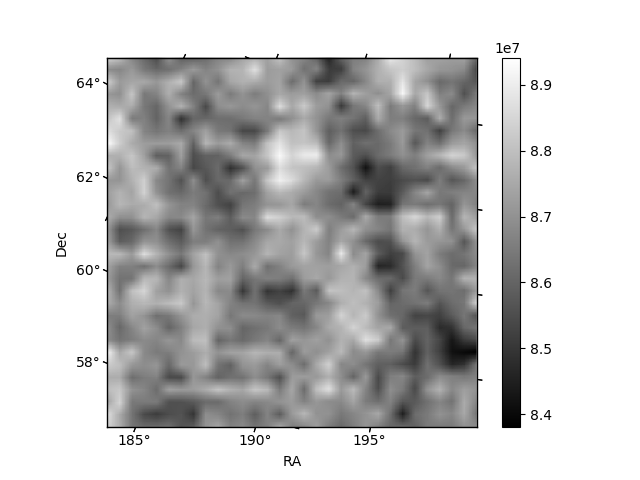
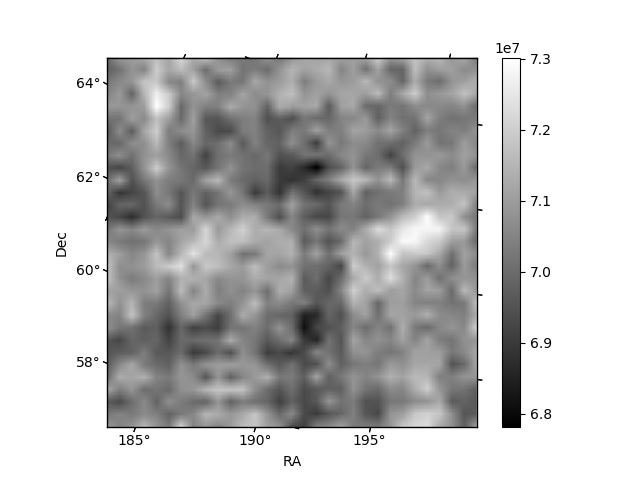
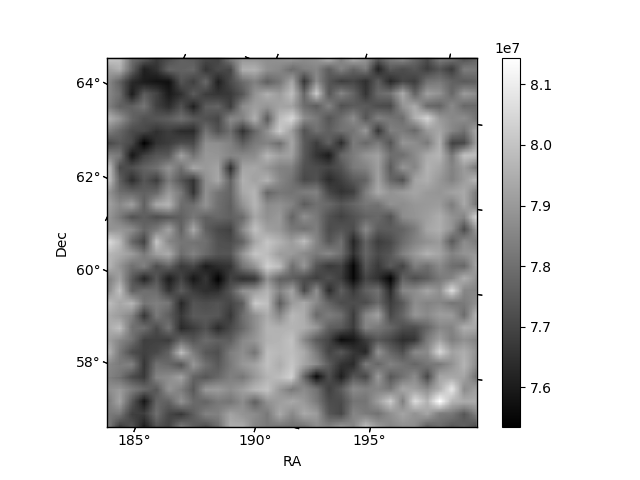
Histogram calculated using DETX and DETY for each event in the final _common_clean file
| Quadrant A | 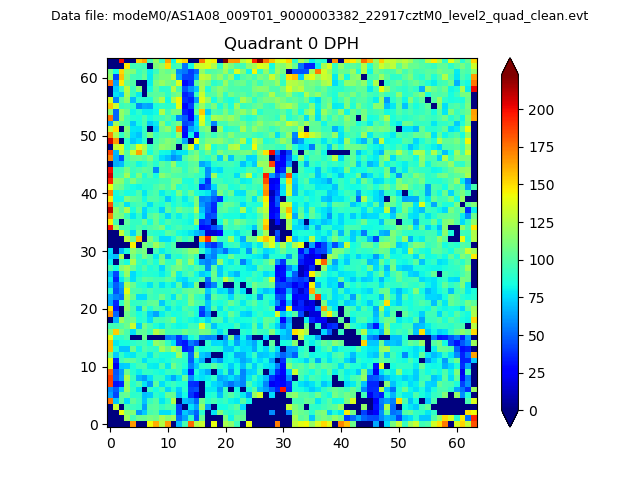 |
 |
Quadrant B |
|---|---|---|---|
| Quadrant D | 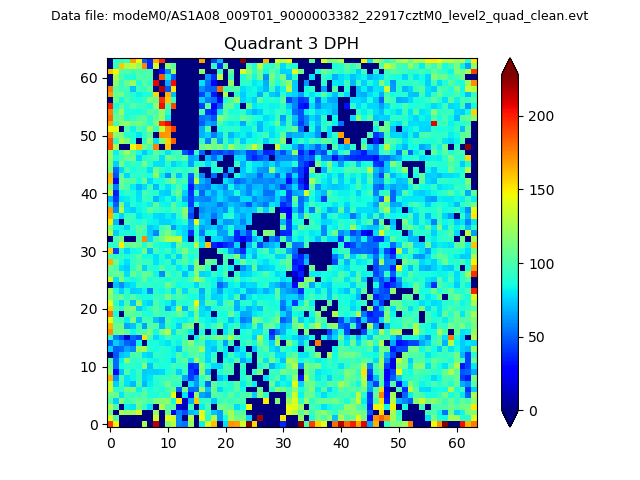 |
 |
Quadrant C |
| Plot type | Count rate plots | Images |
|---|---|---|
| Comparison with Poisson distribution Blue bars denote a histogram of data divided into 1 sec bins. Red curve is a Poisson curve with rate = median count rate of data. |
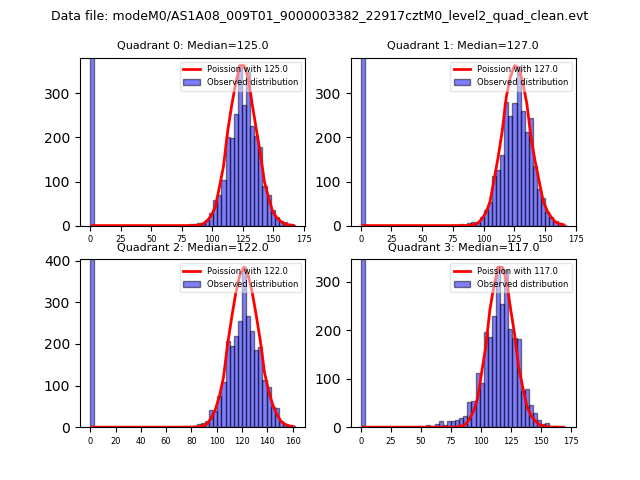 |
 |
| Quadrant-wise count rates Data is divided into 100 sec bins |
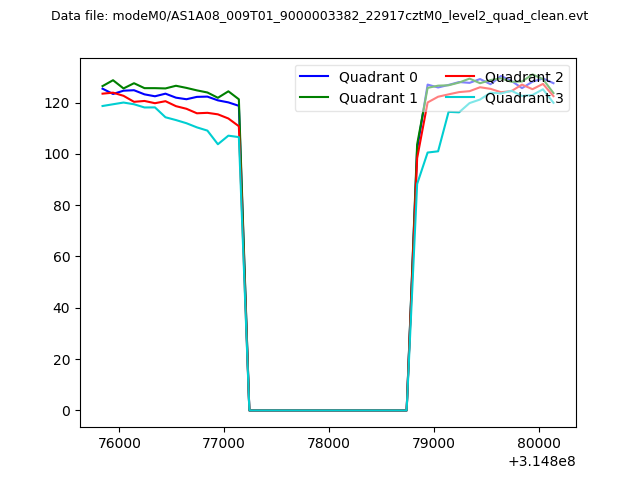 |
|
| Module-wise count rates for Quadrant A Data is divided into 100 sec bins |
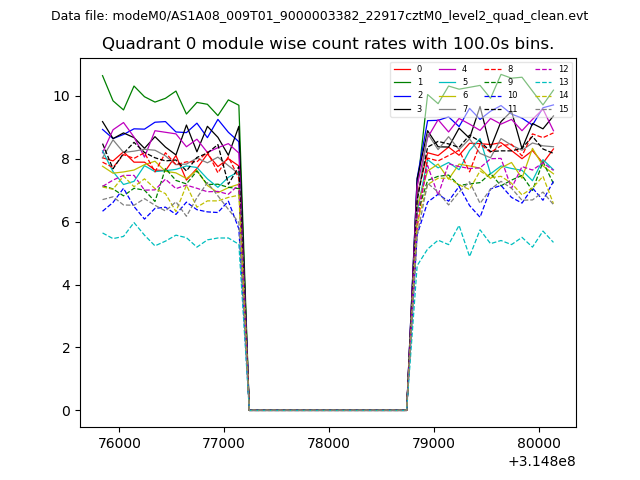 |
 |
| Module-wise count rates for Quadrant B Data is divided into 100 sec bins |
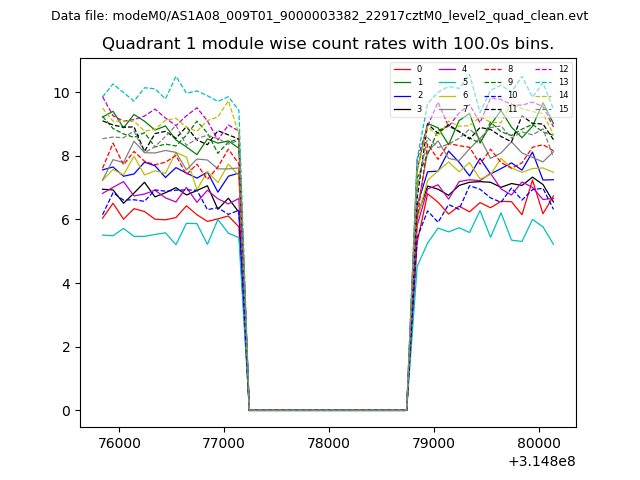 |
 |
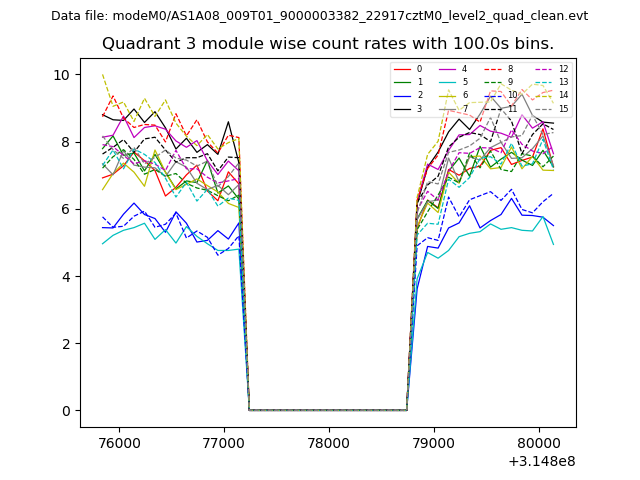
| Module-wise count rates for Quadrant C Data is divided into 100 sec bins |
 |
 |
| Module-wise count rates for Quadrant D Data is divided into 100 sec bins |
 |
 |
| Parameter | Plot |
|---|---|
| CZT HV Monitor |  |
| D_VDD | 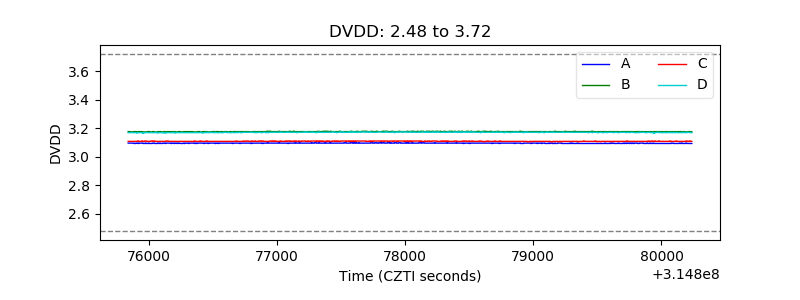 |
| Temperature 1 | 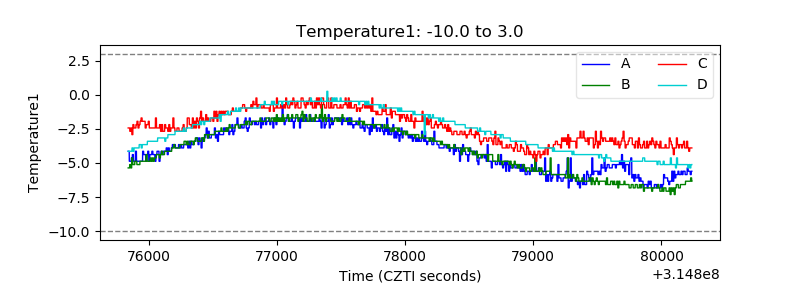 |
| Veto HV Monitor | 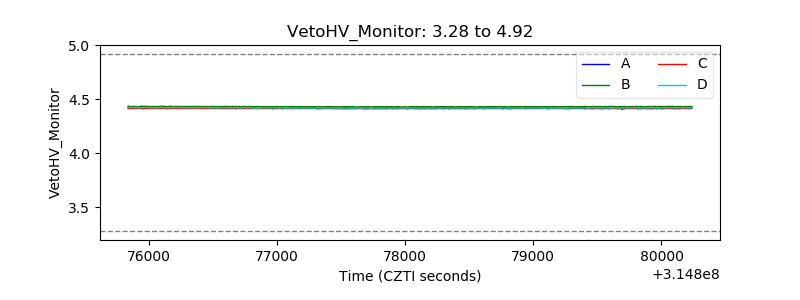 |
| Veto LLD | 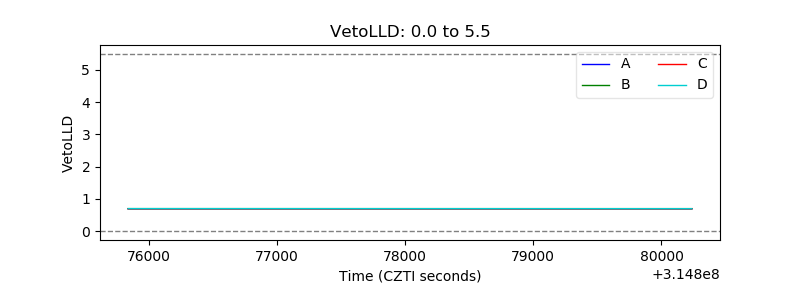 |
| Alpha Counter | 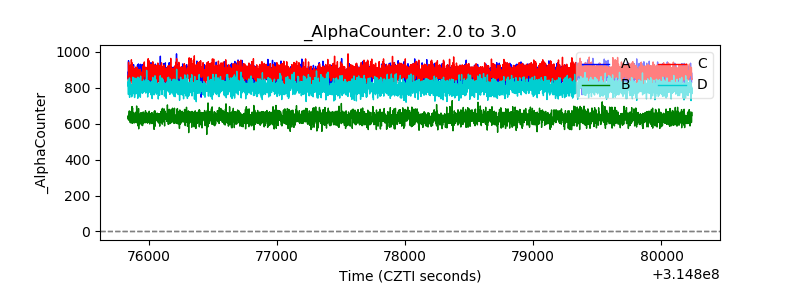 |
| _CPM_Rate | 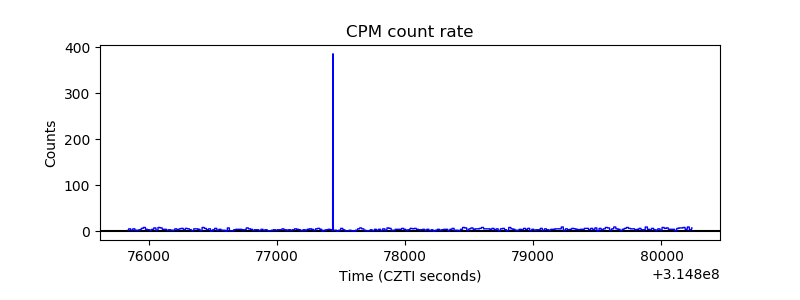 |
| CZT Counter |  |
| +2.5 Volts monitor |  |
| +5 Volts monitor | 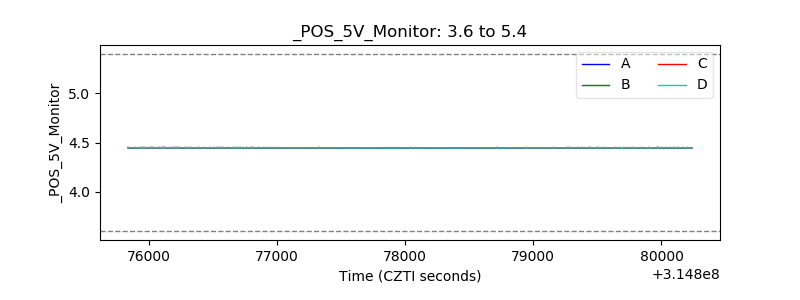 |
| _ROLL_ROT | 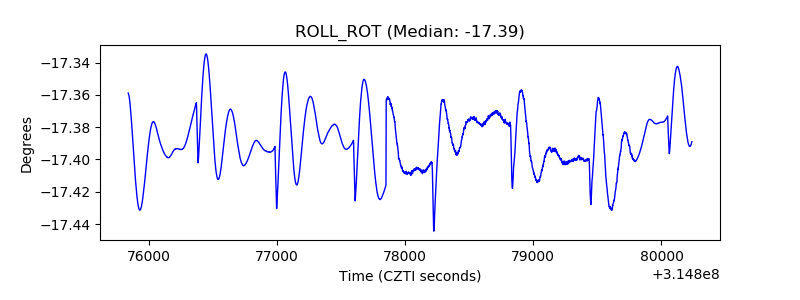 |
| _Roll_DEC | 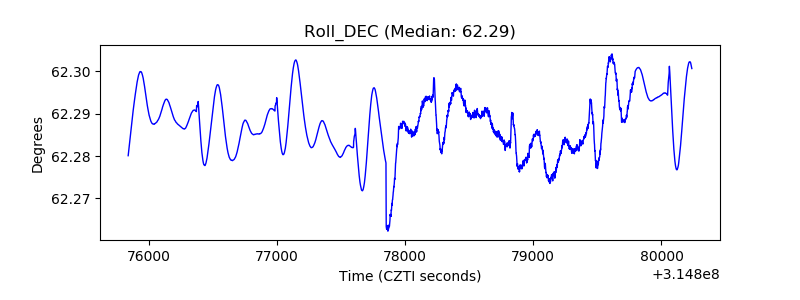 |
| _Roll_RA | 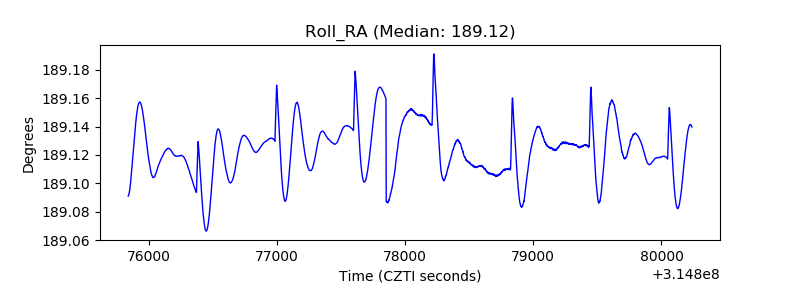 |
| Veto Counter | 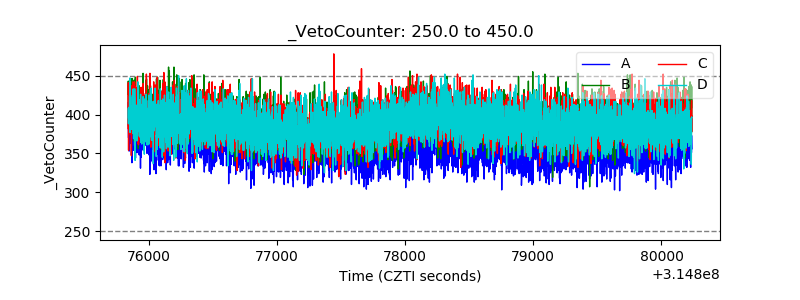 |