| Param | Original file | Final file |
|---|---|---|
| Filename | modeM0/AS1A07_047T08_9000003384_22917cztM0_level2.evt | modeM0/AS1A07_047T08_9000003384_22917cztM0_level2_quad_clean.evt |
| Size (bytes) | 115,784,640 | 28,952,640 |
| Size | 110.4 MB | 27.6 MB |
| Events in quadrant A | 728,366 | 193,210 |
| Events in quadrant B | 749,179 | 198,344 |
| Events in quadrant C | 721,683 | 189,844 |
| Events in quadrant D | 1,199,152 | 180,379 |
| Mode SS | |||
|---|---|---|---|
| Quadrant | BADHDUFLAG | Total packets | Discarded packets |
| A | 0 | 30 | 0 |
| B | 0 | 30 | 0 |
| C | 0 | 30 | 0 |
| D | 0 | 30 | 0 |
| Mode M0 | |||
|---|---|---|---|
| Quadrant | BADHDUFLAG | Total packets | Discarded packets |
| A | 0 | 3128 | 0 |
| B | 0 | 3178 | 0 |
| C | 0 | 3119 | 0 |
| D | 0 | 4556 | 0 |
| Quadrant | Total seconds | Saturated seconds | Saturation percentage |
|---|---|---|---|
| A | 1553 | 4 | 0.257566% |
| B | 1553 | 4 | 0.257566% |
| C | 1553 | 6 | 0.386349% |
| D | 1553 | 79 | 5.086929% |
Noise dominated data is calculated using 1-second bins in cleaned event files. If a bin has >2000 counts, and if more than 50% of those come from <1% of pixels, then it is considered to be noise-dominated and hence unusable.
| Quadrant | # 1 sec bins | Bins with >0 counts | Bins with >2000 counts | High rate bins dominated by noise | Noise dominated (total time) | Noise dominated (detector-on time) | Marked lightcurve |
|---|---|---|---|---|---|---|---|
| A | 1553 | 1553 | 0 | 0 | 0.00% | 0.00% | 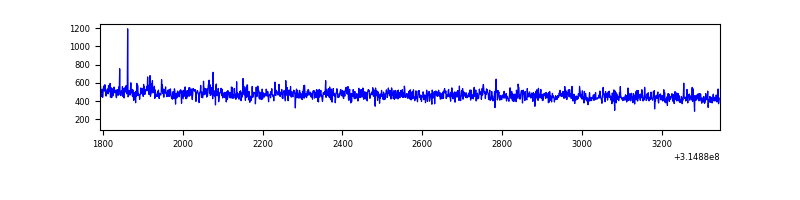 |
| B | 1553 | 1553 | 1 | 1 | 0.06% | 0.06% | 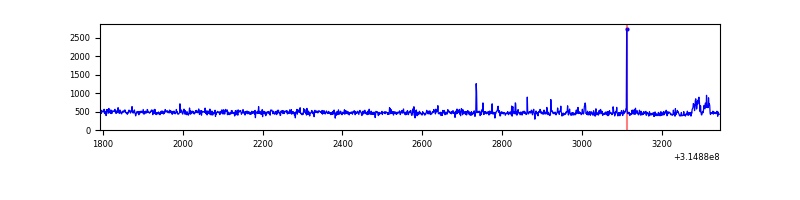 |
| C | 1553 | 1553 | 0 | 0 | 0.00% | 0.00% | 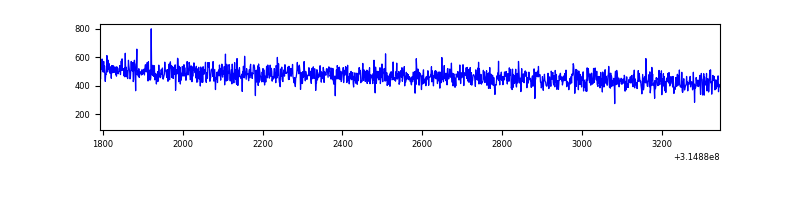 |
| D | 1553 | 1553 | 70 | 70 | 4.51% | 4.51% | 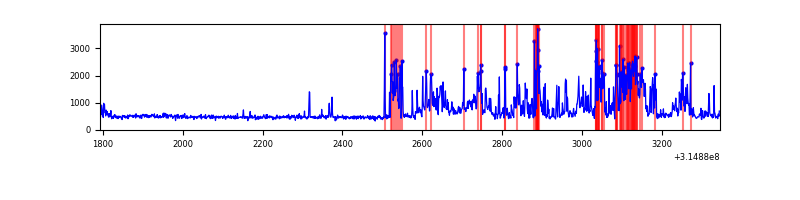 |
Top three noisy pixels from each quadrant. If the there are fewer than three noisy pixels in the level2.evt file, extra rows are filled as -1
| Pixel properties | Quadrant properties | ||||||
|---|---|---|---|---|---|---|---|
| Quadrant | DetID | PixID | Counts | Sigma | Mean | Median | Sigma |
| A | 13 | 252 | 5666 | 137.46 | 187 | 182 | 39.9 |
| A | 13 | 254 | 2718 | 63.57 | 187 | 182 | 39.9 |
| A | 0 | 226 | 1721 | 38.58 | 187 | 182 | 39.9 |
| B | 3 | 64 | 15763 | 419.18 | 183 | 178 | 37.2 |
| B | 0 | 189 | 4350 | 112.21 | 183 | 178 | 37.2 |
| B | 12 | 111 | 4172 | 107.42 | 183 | 178 | 37.2 |
| C | 14 | 238 | 28012 | 651.16 | 177 | 178 | 42.7 |
| C | 13 | 61 | 1182 | 23.49 | 177 | 178 | 42.7 |
| C | 10 | 22 | 760 | 13.62 | 177 | 178 | 42.7 |
| D | 13 | 172 | 266606 | 5807.83 | 181 | 174 | 45.9 |
| D | 1 | 52 | 75691 | 1646.15 | 181 | 174 | 45.9 |
| D | 12 | 233 | 64049 | 1392.37 | 181 | 174 | 45.9 |
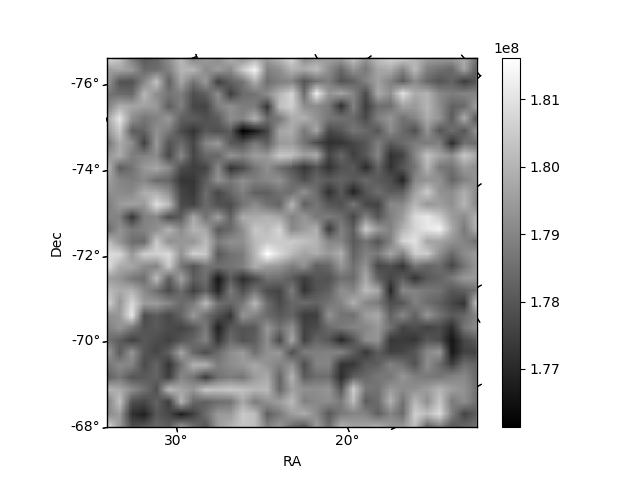
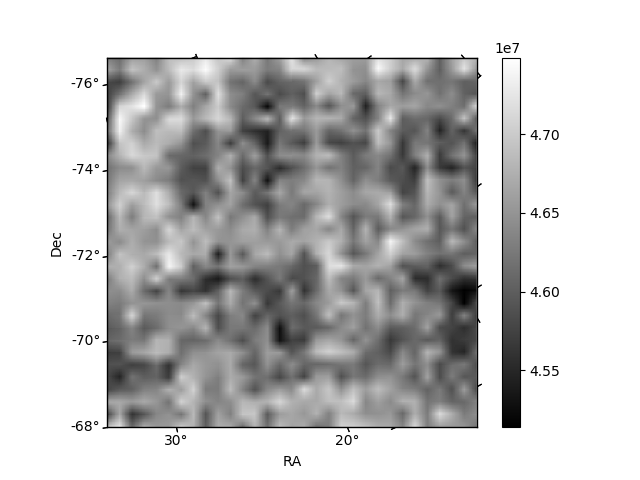
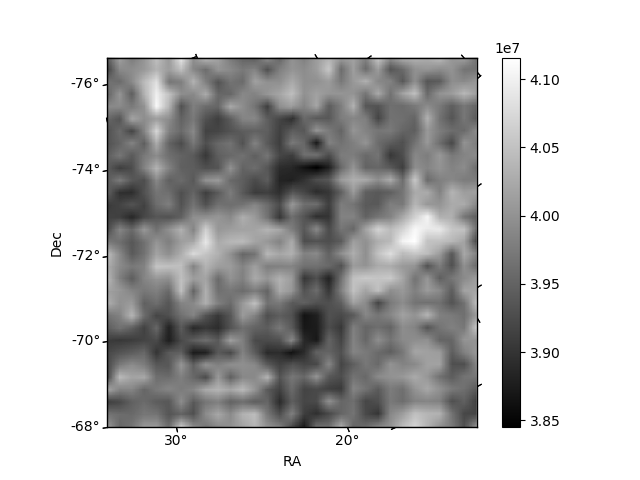
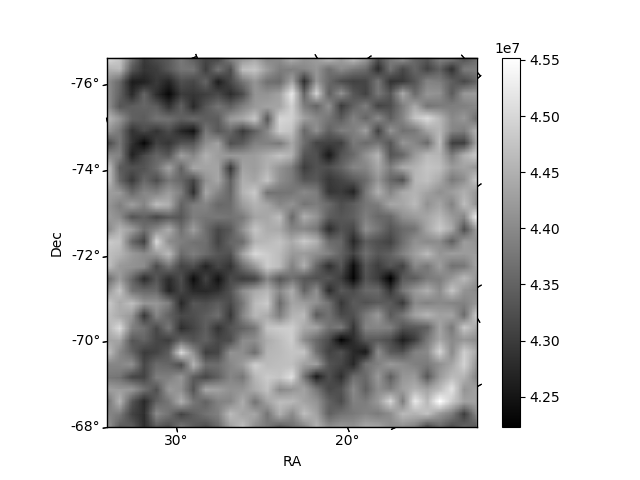
Histogram calculated using DETX and DETY for each event in the final _common_clean file
| Quadrant A | 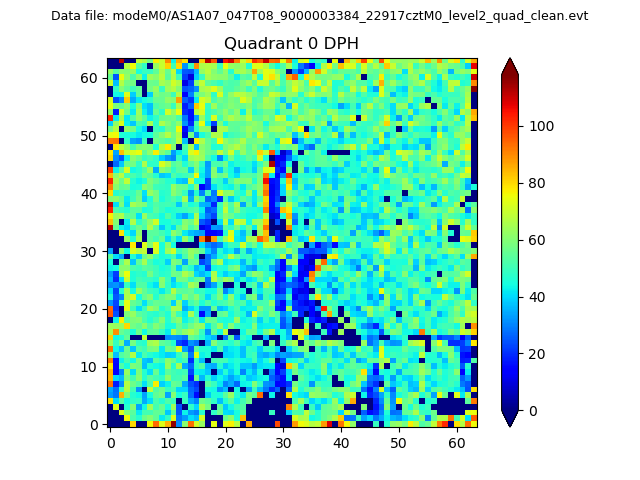 |
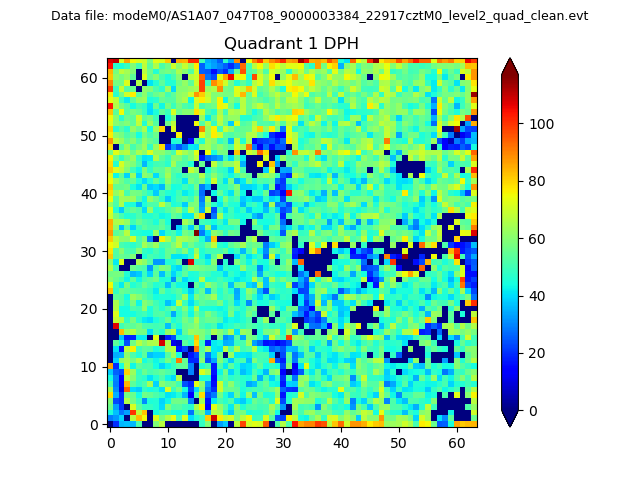 |
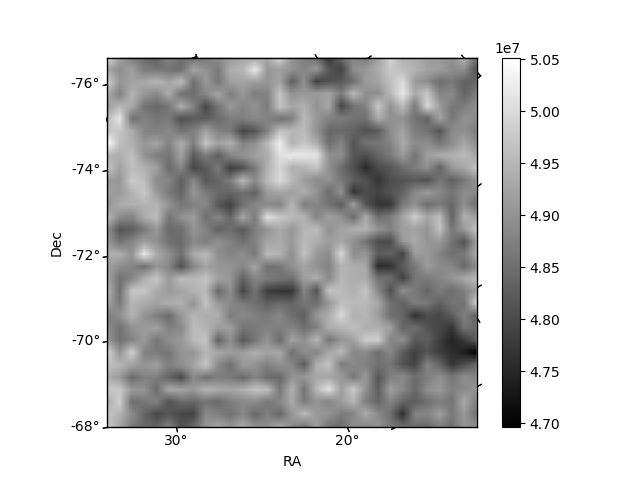
Quadrant B |
|---|---|---|---|
| Quadrant D | 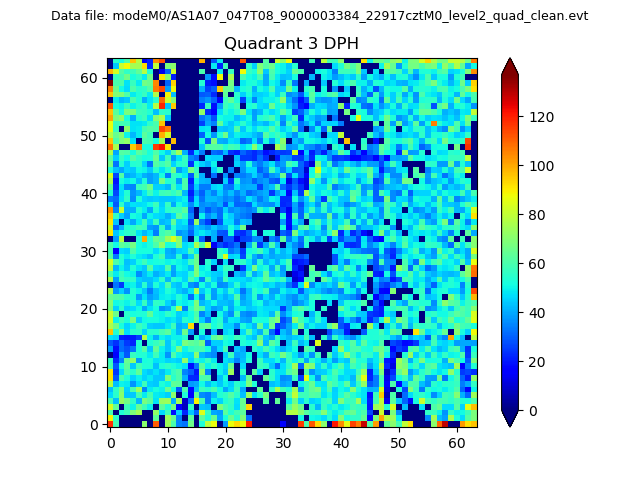 |
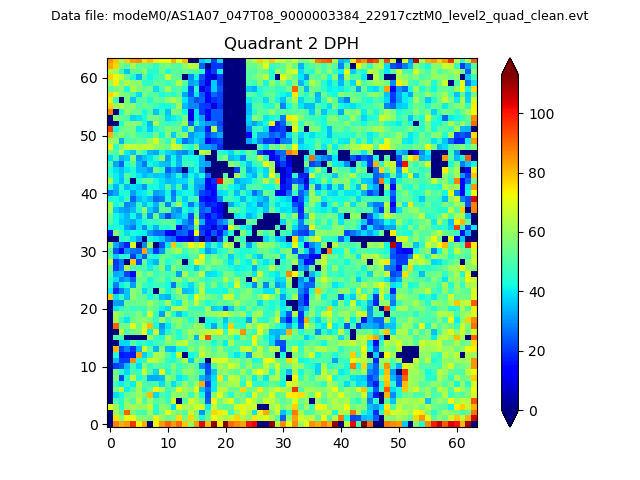 |
Quadrant C |
| Plot type | Count rate plots | Images |
|---|---|---|
| Comparison with Poisson distribution Blue bars denote a histogram of data divided into 1 sec bins. Red curve is a Poisson curve with rate = median count rate of data. |
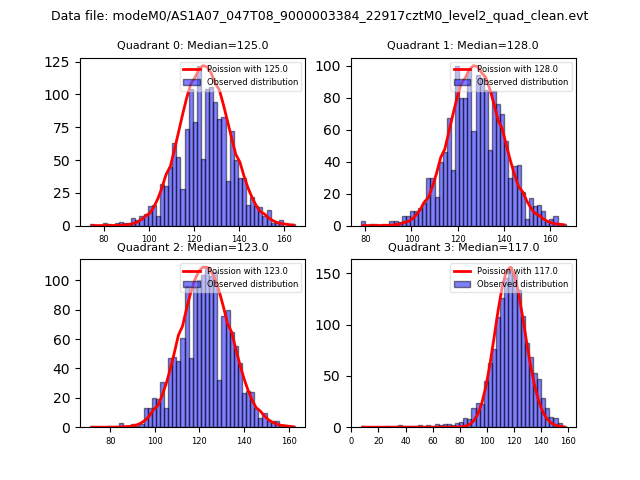 |
 |
| Quadrant-wise count rates Data is divided into 100 sec bins |
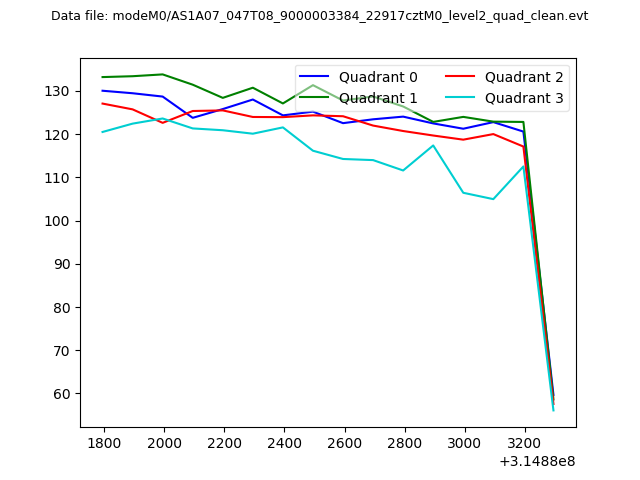 |
|
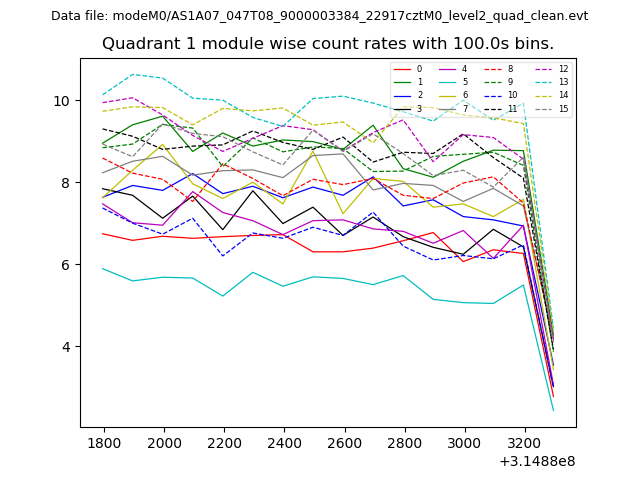
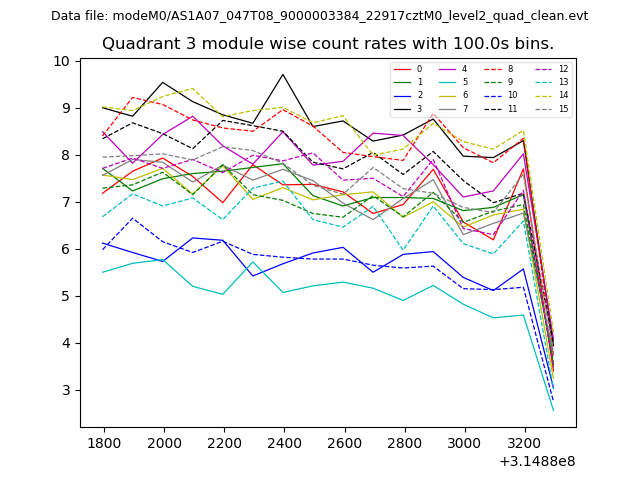
| Module-wise count rates for Quadrant A Data is divided into 100 sec bins |
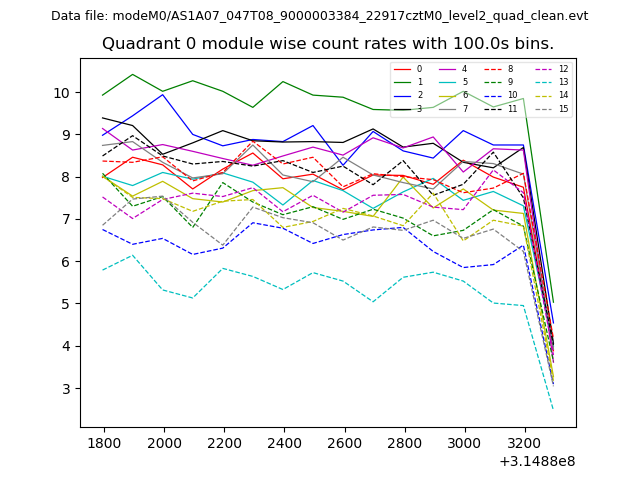 |
 |
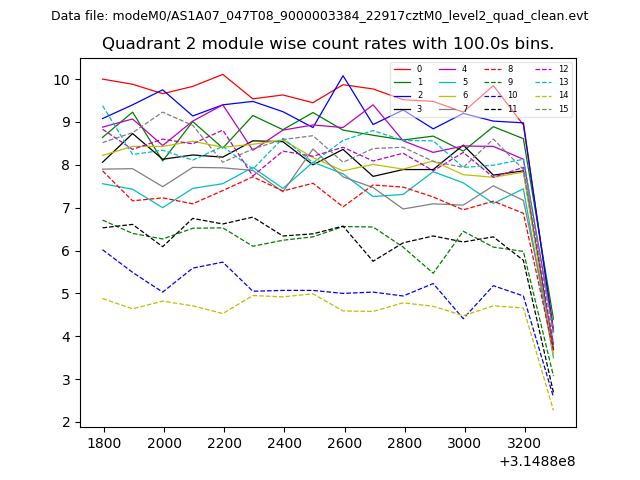
| Module-wise count rates for Quadrant B Data is divided into 100 sec bins |
 |
 |
| Module-wise count rates for Quadrant C Data is divided into 100 sec bins |
 |
 |
| Module-wise count rates for Quadrant D Data is divided into 100 sec bins |
 |
 |
| Parameter | Plot |
|---|---|
| CZT HV Monitor | 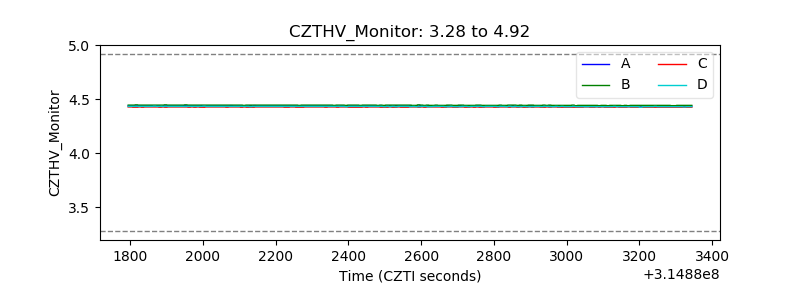 |
| D_VDD | 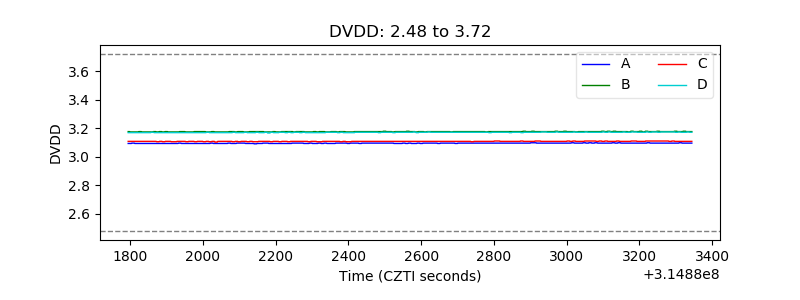 |
| Temperature 1 | 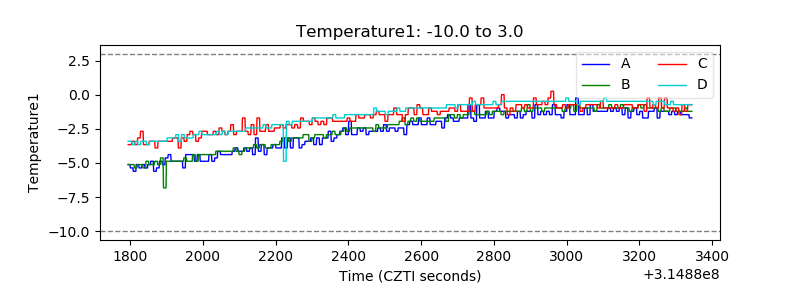 |
| Veto HV Monitor | 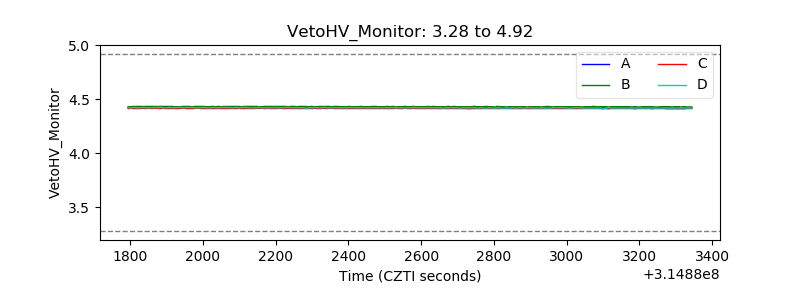 |
| Veto LLD | 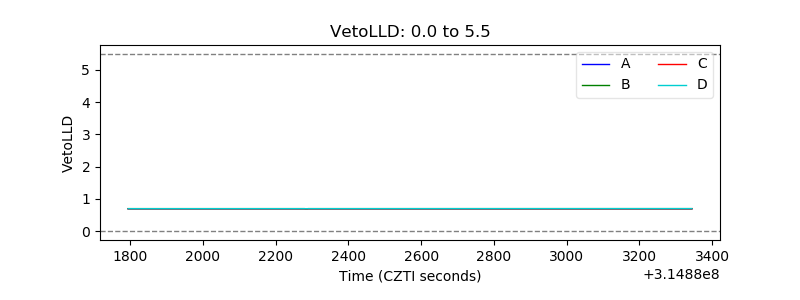 |
| Alpha Counter | 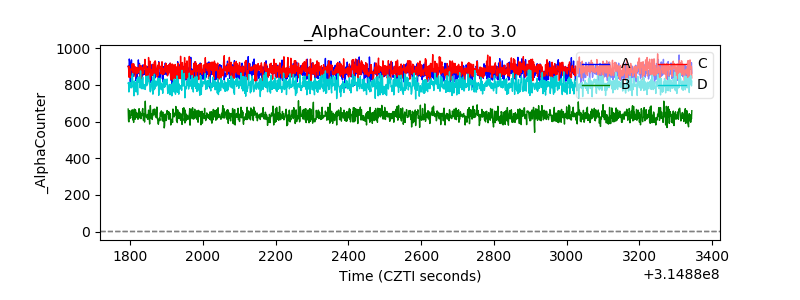 |
| _CPM_Rate | 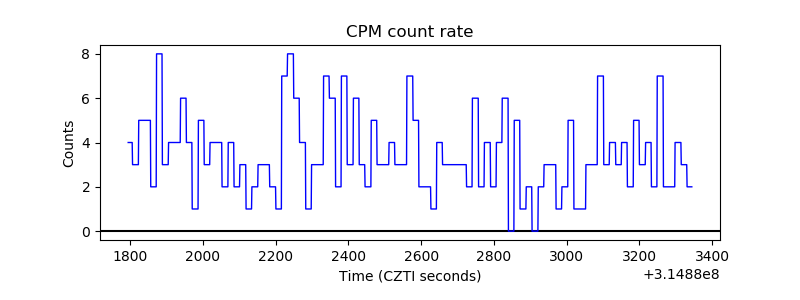 |
| CZT Counter | 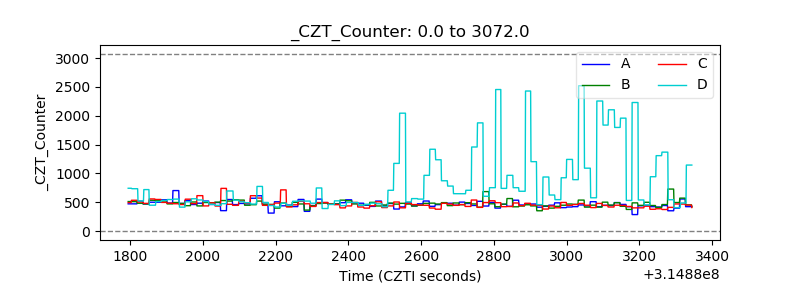 |
| +2.5 Volts monitor |  |
| +5 Volts monitor | 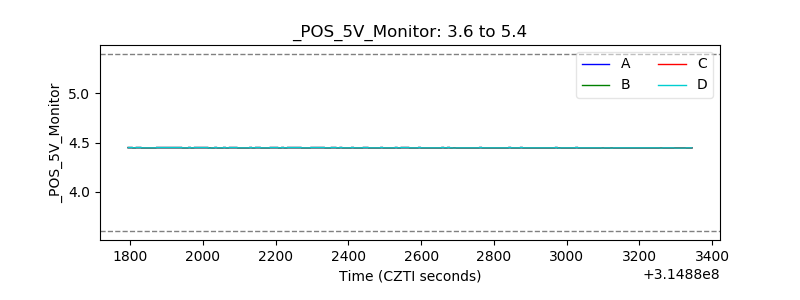 |
| _ROLL_ROT | 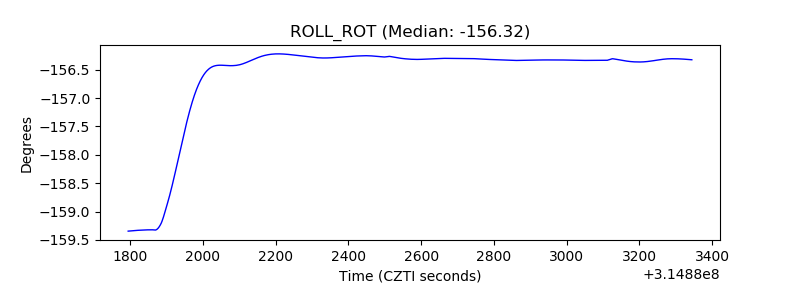 |
| _Roll_DEC | 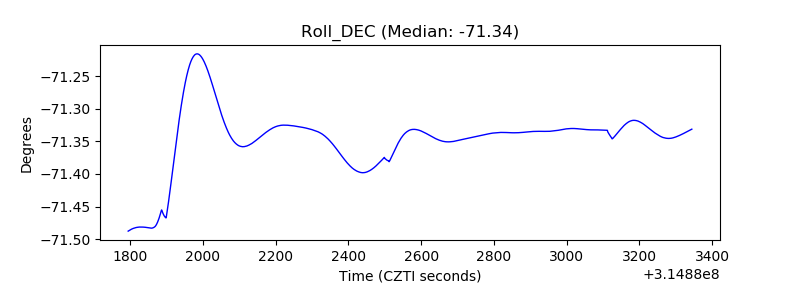 |
| _Roll_RA | 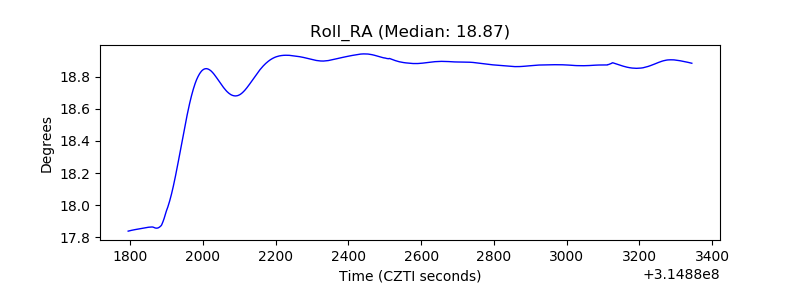 |
| Veto Counter | 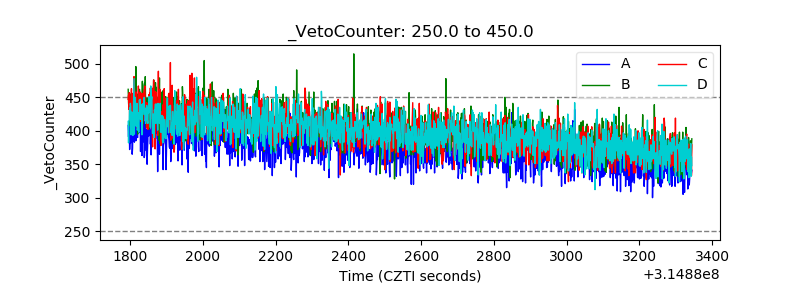 |