| Param | Original file | Final file |
|---|---|---|
| Filename | modeM0/AS1A07_047T09_9000003386cztM0_level2.fits | modeM0/AS1A07_047T09_9000003386cztM0_level2_quad_clean.evt |
| Size (bytes) | 94,985,280 | 99,380,160 |
| Size | 90.6 MB | 94.8 MB |
| Events in quadrant A | 578,628 | 612,879 |
| Events in quadrant B | 553,220 | 608,971 |
| Events in quadrant C | 558,138 | 573,030 |
| Events in quadrant D | 469,546 | 497,209 |
| Mode M0 | |||
|---|---|---|---|
| Quadrant | BADHDUFLAG | Total packets | Discarded packets |
| A | 0 | 21002 | 0 |
| B | 0 | 21677 | 0 |
| C | 0 | 21245 | 0 |
| D | 0 | 32944 | 0 |
| Mode SS | |||
|---|---|---|---|
| Quadrant | BADHDUFLAG | Total packets | Discarded packets |
| A | 0 | 212 | 0 |
| B | 0 | 212 | 0 |
| C | 0 | 212 | 0 |
| D | 0 | 212 | 0 |
| Mode M9 | |||
|---|---|---|---|
| Quadrant | BADHDUFLAG | Total packets | Discarded packets |
| A | 0 | 10 | 0 |
| B | 0 | 10 | 0 |
| C | 0 | 10 | 0 |
| D | 0 | 10 | 0 |
| Quadrant | Total seconds | Saturated seconds | Saturation percentage |
|---|---|---|---|
| A | 10347 | 40 | 0.386585% |
| B | 10347 | 69 | 0.666860% |
| C | 10347 | 108 | 1.043781% |
| D | 10347 | 832 | 8.040978% |
Noise dominated data is calculated using 1-second bins in cleaned event files. If a bin has >2000 counts, and if more than 50% of those come from <1% of pixels, then it is considered to be noise-dominated and hence unusable.
| Quadrant | # 1 sec bins | Bins with >0 counts | Bins with >2000 counts | High rate bins dominated by noise | Noise dominated (total time) | Noise dominated (detector-on time) | Marked lightcurve |
|---|---|---|---|---|---|---|---|
| A | 11357 | 10347 | 0 | 0 | 0.00% | 0.00% | 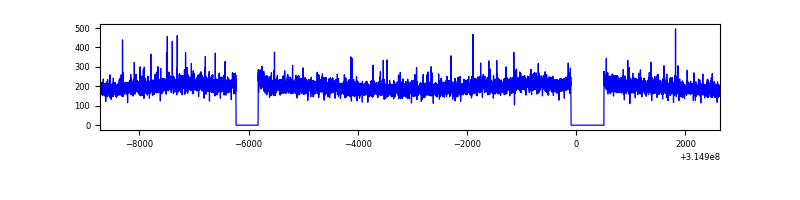 |
| B | 11357 | 10347 | 0 | 0 | 0.00% | 0.00% | 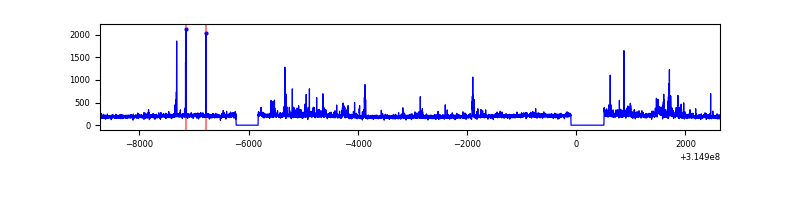 |
| C | 11357 | 10347 | 0 | 0 | 0.00% | 0.00% | 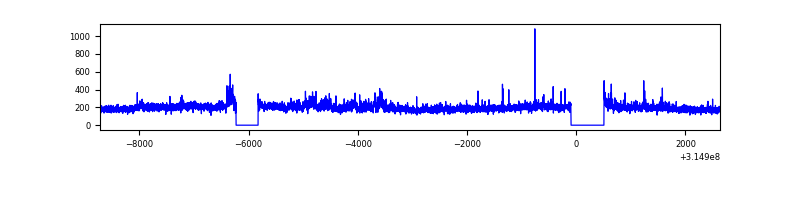 |
| D | 11357 | 10346 | 0 | 0 | 0.00% | 0.00% | 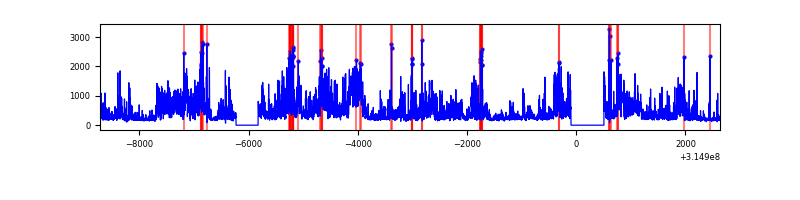 |
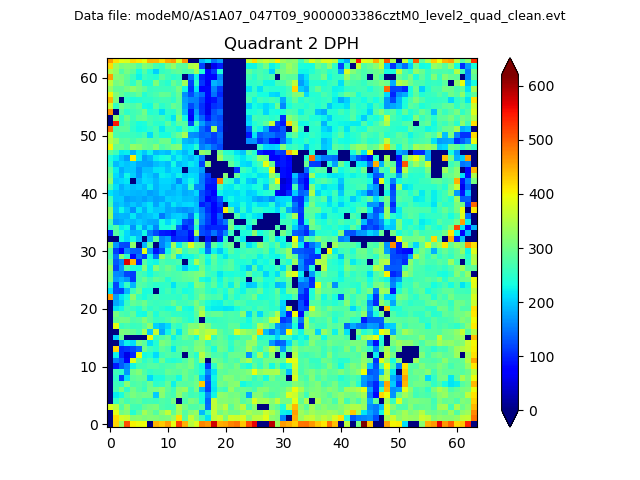
Top three noisy pixels from each quadrant. If the there are fewer than three noisy pixels in the level2.evt file, extra rows are filled as -1
| Pixel properties | Quadrant properties | ||||||
|---|---|---|---|---|---|---|---|
| Quadrant | DetID | PixID | Counts | Sigma | Mean | Median | Sigma |
| A | 0 | 29 | 602 | 11.58 | 150 | 141 | 39.8 |
| A | 0 | 30 | 478 | 8.47 | 150 | 141 | 39.8 |
| A | 9 | 19 | 444 | 7.61 | 150 | 141 | 39.8 |
| B | 2 | 9 | 456 | 10.14 | 146 | 139 | 31.3 |
| B | 2 | 8 | 369 | 7.36 | 146 | 139 | 31.3 |
| B | 14 | 254 | 365 | 7.23 | 146 | 139 | 31.3 |
| C | 3 | 234 | 410 | 6.99 | 147 | 137 | 39.1 |
| C | 12 | 249 | 386 | 6.37 | 147 | 137 | 39.1 |
| C | 9 | 209 | 380 | 6.22 | 147 | 137 | 39.1 |
| D | 3 | 14 | 388 | 7.1 | 134 | 121 | 37.6 |
| D | 3 | 31 | 352 | 6.14 | 134 | 121 | 37.6 |
| D | 6 | 67 | 340 | 5.82 | 134 | 121 | 37.6 |
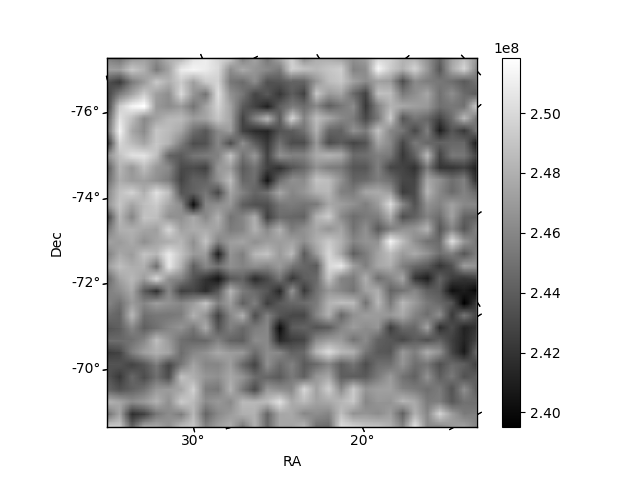
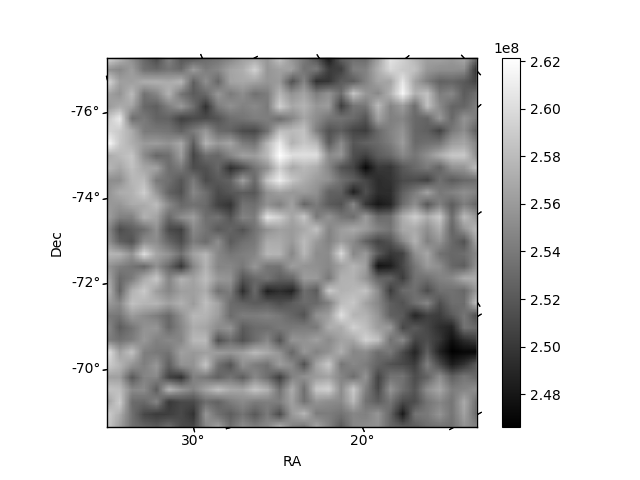
Histogram calculated using DETX and DETY for each event in the final _common_clean file
| Quadrant A | 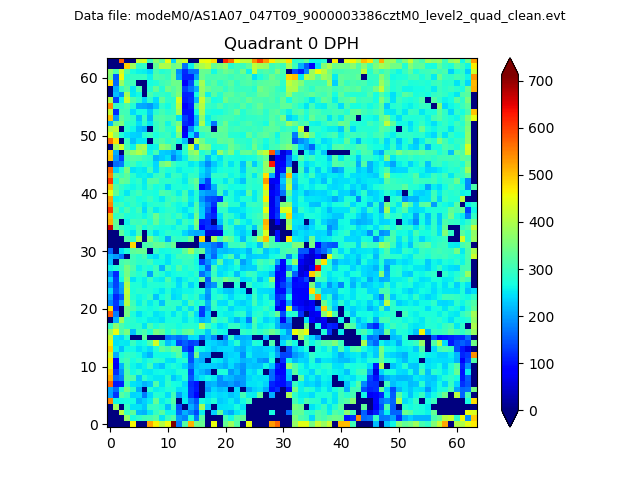 |
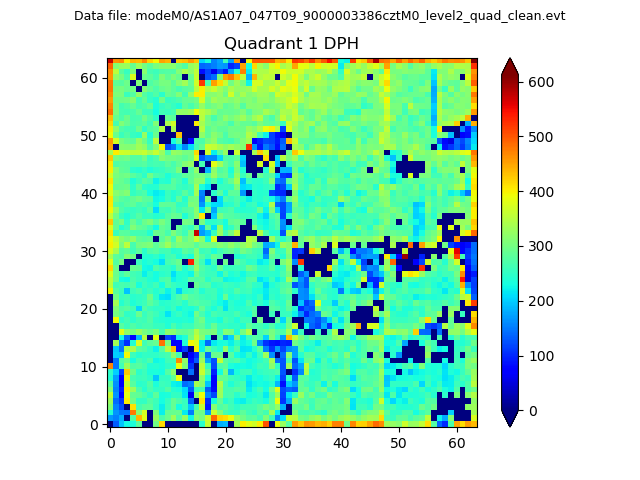 |
Quadrant B |
|---|---|---|---|
| Quadrant D | 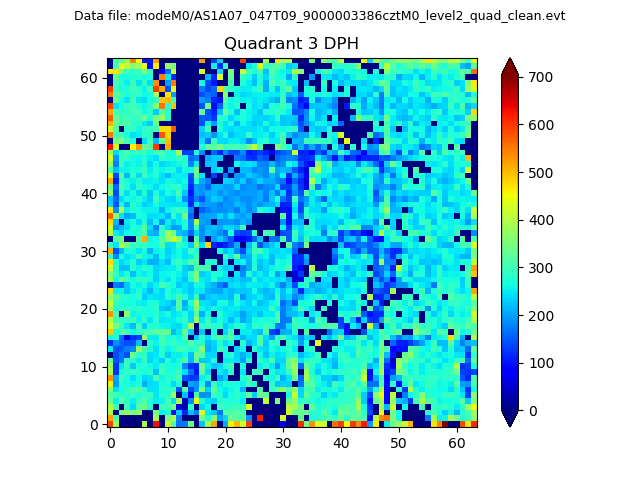 |
 |
Quadrant C |
| Plot type | Count rate plots | Images |
|---|---|---|
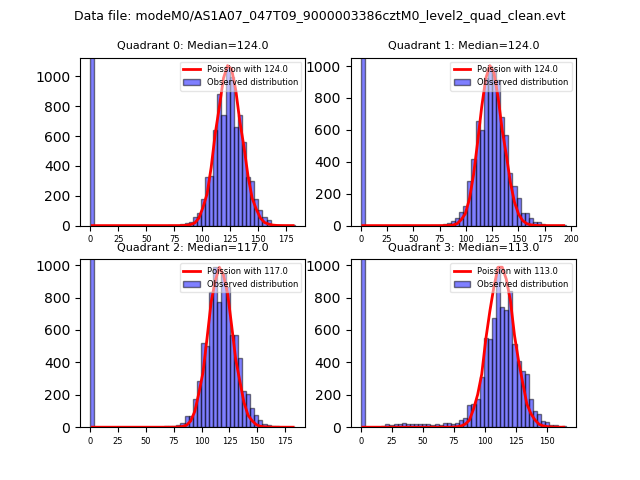
| Comparison with Poisson distribution Blue bars denote a histogram of data divided into 1 sec bins. Red curve is a Poisson curve with rate = median count rate of data. |
 |
 |
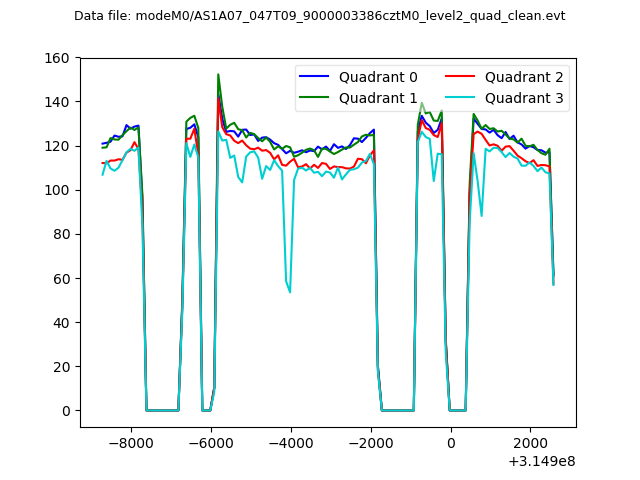
| Quadrant-wise count rates Data is divided into 100 sec bins |
 |
|
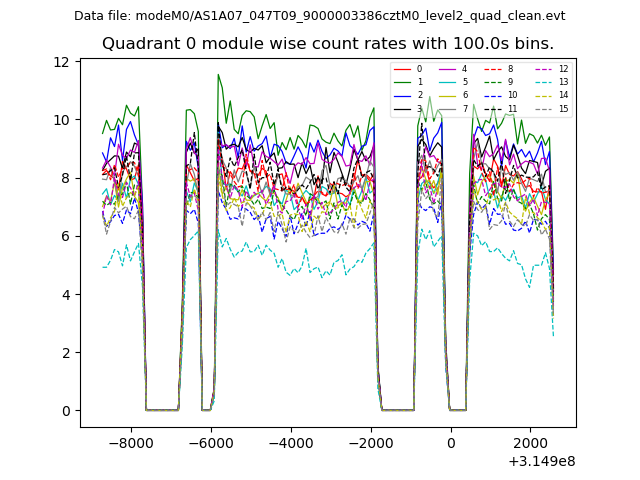
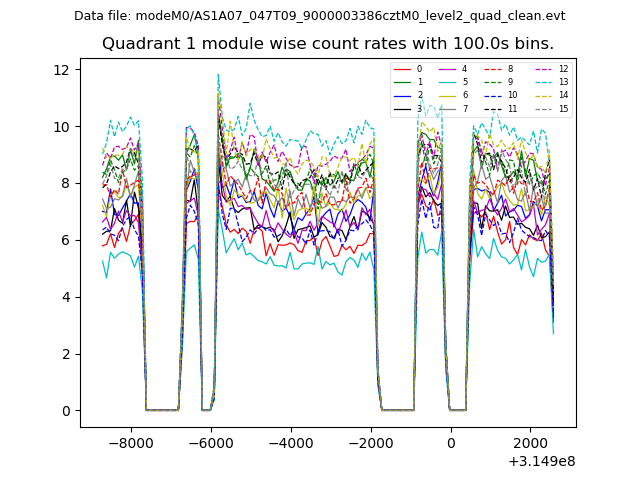
| Module-wise count rates for Quadrant A Data is divided into 100 sec bins |
 |
 |
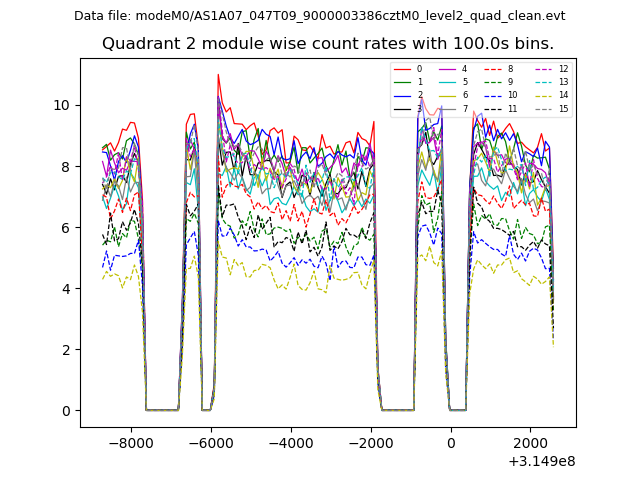
| Module-wise count rates for Quadrant B Data is divided into 100 sec bins |
 |
 |
| Module-wise count rates for Quadrant C Data is divided into 100 sec bins |
 |
 |
| Module-wise count rates for Quadrant D Data is divided into 100 sec bins |
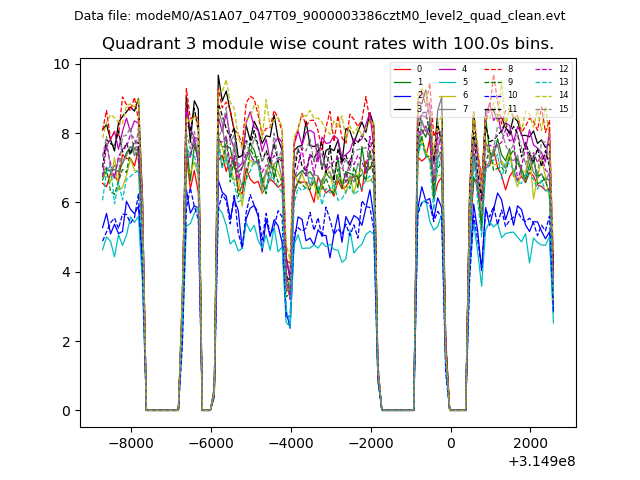 |
 |
| Parameter | Plot |
|---|---|
| CZT HV Monitor | 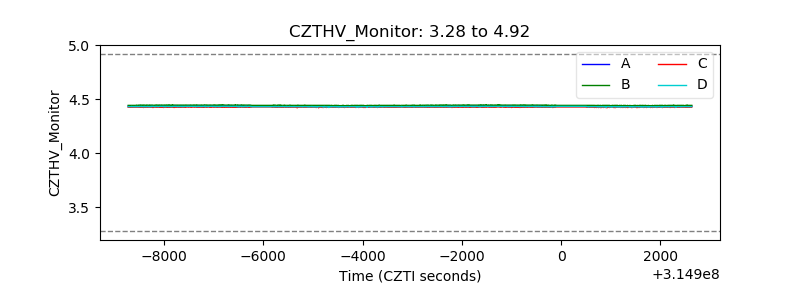 |
| D_VDD | 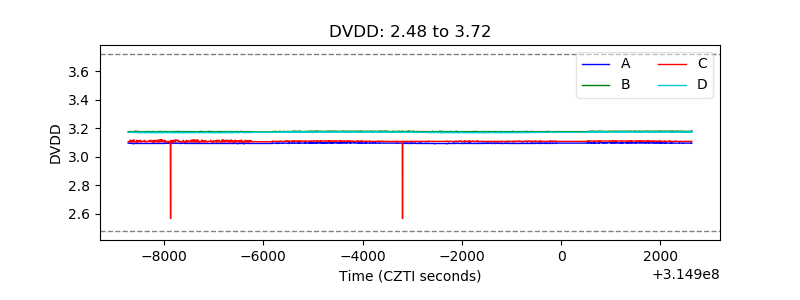 |
| Temperature 1 | 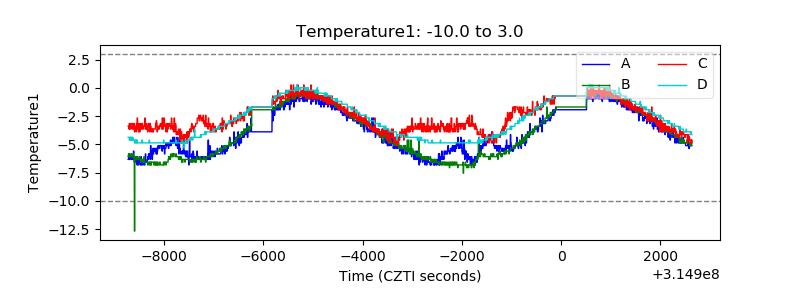 |
| Veto HV Monitor | 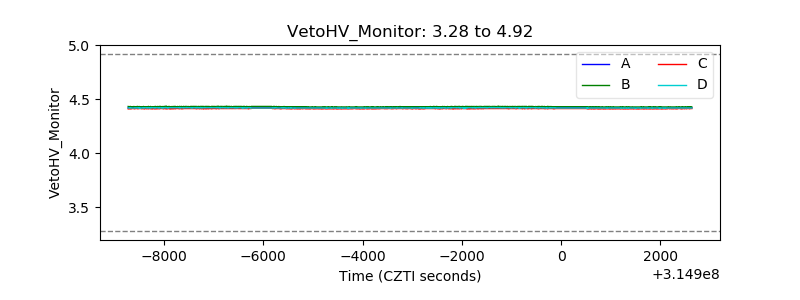 |
| Veto LLD | 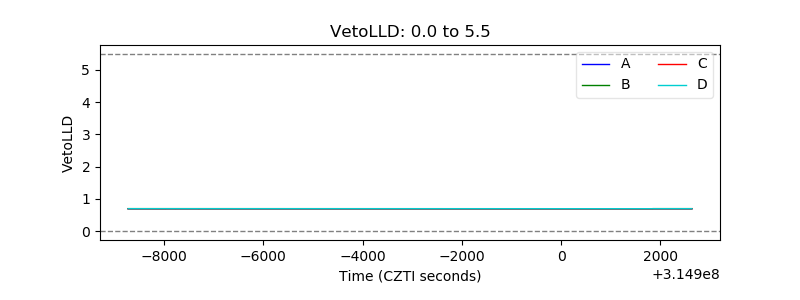 |
| Alpha Counter | 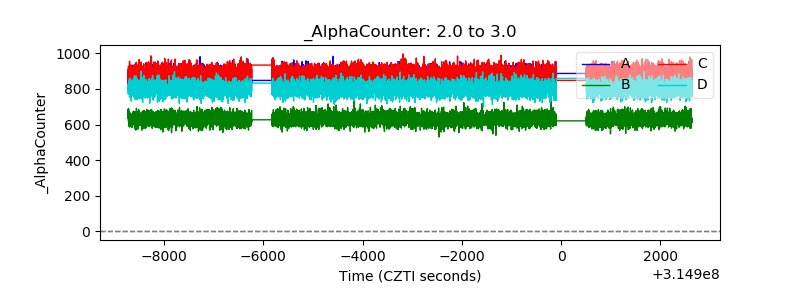 |
| _CPM_Rate | 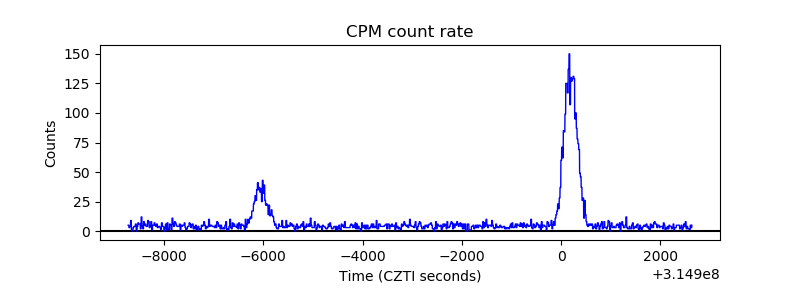 |
| CZT Counter | 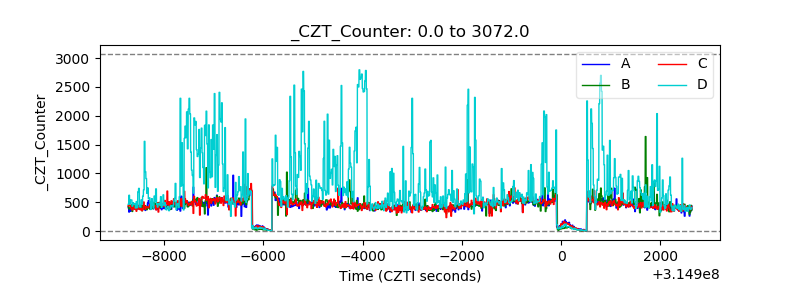 |
| +2.5 Volts monitor | 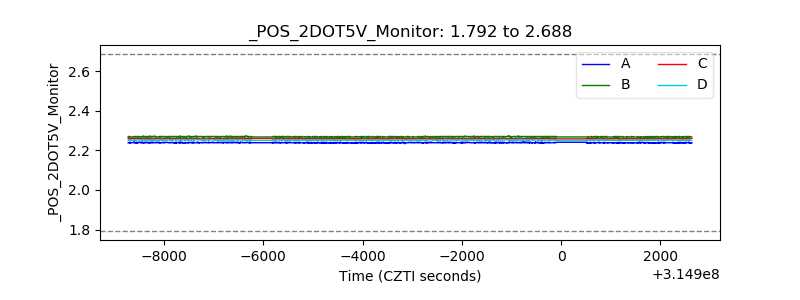 |
| +5 Volts monitor | 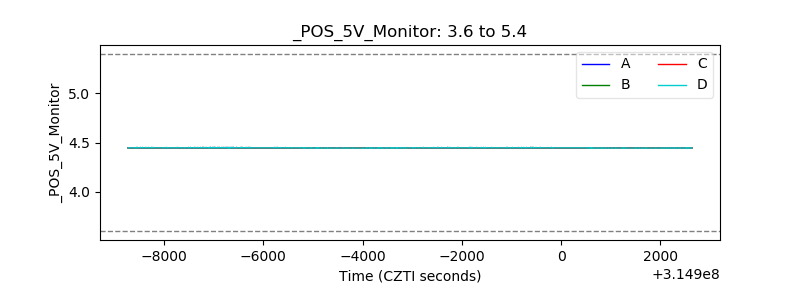 |
| _ROLL_ROT | 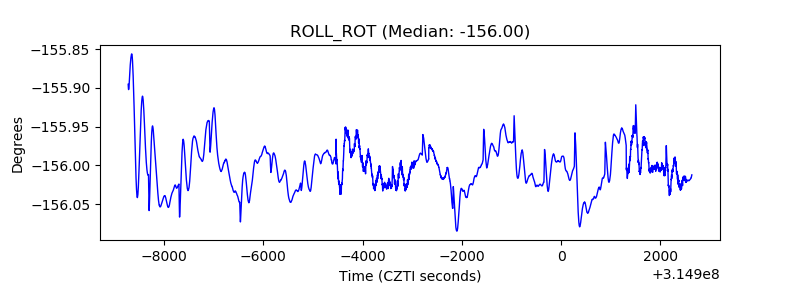 |
| _Roll_DEC | 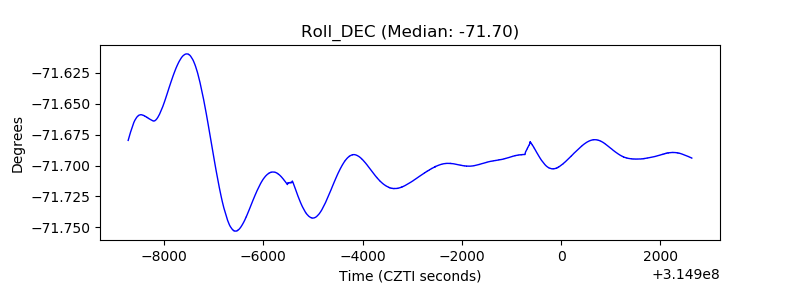 |
| _Roll_RA | 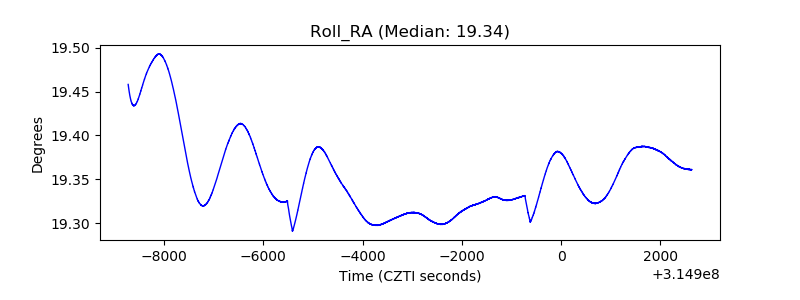 |
| Veto Counter | 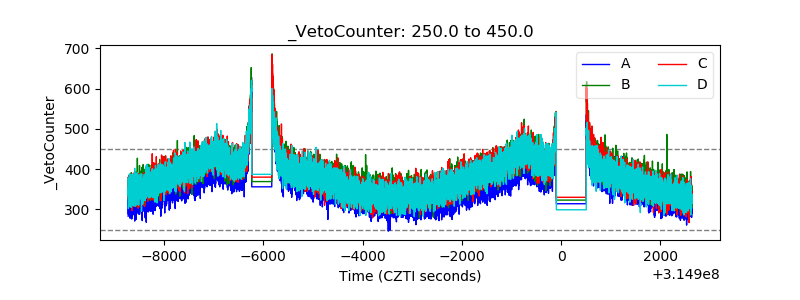 |