| Param | Original file | Final file |
|---|---|---|
| Filename | modeM0/AS1A07_047T09_9000003386_22919cztM0_level2.evt | modeM0/AS1A07_047T09_9000003386_22919cztM0_level2_quad_clean.evt |
| Size (bytes) | 331,473,600 | 59,420,160 |
| Size | 316.1 MB | 56.7 MB |
| Events in quadrant A | 1,931,708 | 390,155 |
| Events in quadrant B | 2,041,866 | 394,463 |
| Events in quadrant C | 2,018,969 | 371,449 |
| Events in quadrant D | 3,767,953 | 355,366 |
| Mode M0 | |||
|---|---|---|---|
| Quadrant | BADHDUFLAG | Total packets | Discarded packets |
| A | 0 | 8353 | 1 |
| B | 0 | 8601 | 1 |
| C | 0 | 8493 | 1 |
| D | 0 | 14047 | 1 |
| Mode SS | |||
|---|---|---|---|
| Quadrant | BADHDUFLAG | Total packets | Discarded packets |
| A | 0 | 84 | 0 |
| B | 0 | 84 | 0 |
| C | 0 | 84 | 0 |
| D | 0 | 84 | 0 |
| Mode M9 | |||
|---|---|---|---|
| Quadrant | BADHDUFLAG | Total packets | Discarded packets |
| A | 0 | 4 | 0 |
| B | 0 | 4 | 0 |
| C | 0 | 4 | 0 |
| D | 0 | 4 | 0 |
| Quadrant | Total seconds | Saturated seconds | Saturation percentage |
|---|---|---|---|
| A | 4079 | 26 | 0.637411% |
| B | 4079 | 49 | 1.201275% |
| C | 4079 | 75 | 1.838686% |
| D | 4079 | 405 | 9.928904% |
Noise dominated data is calculated using 1-second bins in cleaned event files. If a bin has >2000 counts, and if more than 50% of those come from <1% of pixels, then it is considered to be noise-dominated and hence unusable.
| Quadrant | # 1 sec bins | Bins with >0 counts | Bins with >2000 counts | High rate bins dominated by noise | Noise dominated (total time) | Noise dominated (detector-on time) | Marked lightcurve |
|---|---|---|---|---|---|---|---|
| A | 4484 | 4080 | 0 | 0 | 0.00% | 0.00% | 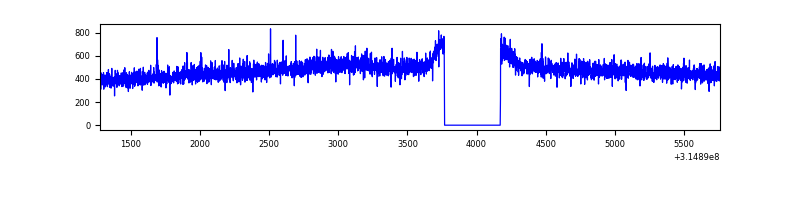 |
| B | 4484 | 4080 | 5 | 5 | 0.11% | 0.12% | 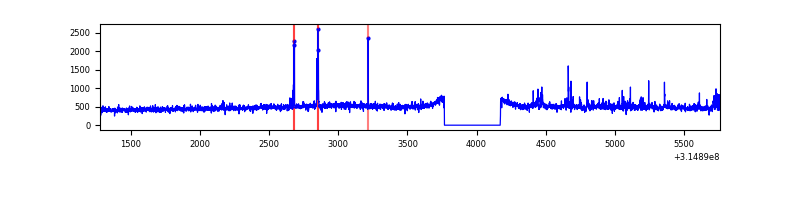 |
| C | 4484 | 4080 | 0 | 0 | 0.00% | 0.00% | 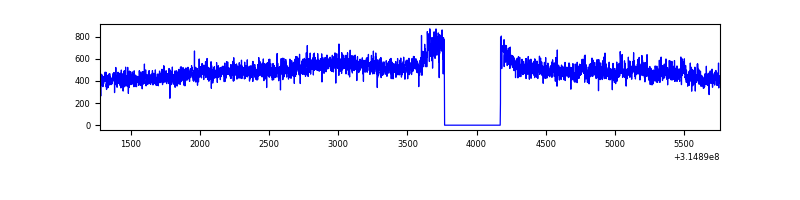 |
| D | 4484 | 4080 | 225 | 225 | 5.02% | 5.51% | 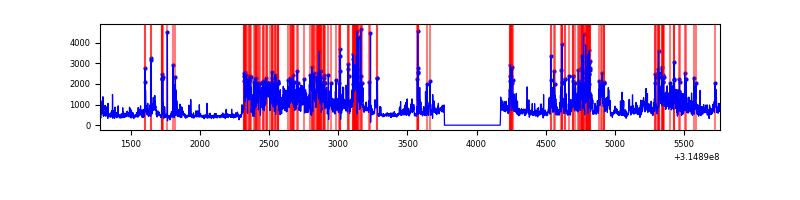 |
Top three noisy pixels from each quadrant. If the there are fewer than three noisy pixels in the level2.evt file, extra rows are filled as -1
| Pixel properties | Quadrant properties | ||||||
|---|---|---|---|---|---|---|---|
| Quadrant | DetID | PixID | Counts | Sigma | Mean | Median | Sigma |
| A | 13 | 254 | 7332 | 67.25 | 498 | 487 | 101.8 |
| A | 0 | 23 | 6608 | 60.14 | 498 | 487 | 101.8 |
| A | 0 | 226 | 4606 | 40.47 | 498 | 487 | 101.8 |
| B | 0 | 190 | 34478 | 354.56 | 496 | 482 | 95.9 |
| B | 10 | 247 | 26440 | 270.73 | 496 | 482 | 95.9 |
| B | 0 | 228 | 16721 | 169.36 | 496 | 482 | 95.9 |
| C | 14 | 238 | 75338 | 664.56 | 478 | 479 | 112.6 |
| C | 6 | 80 | 68968 | 608.01 | 478 | 479 | 112.6 |
| C | 8 | 128 | 4871 | 38.99 | 478 | 479 | 112.6 |
| D | 1 | 52 | 1306007 | 11164.98 | 472 | 456 | 116.9 |
| D | 12 | 233 | 196324 | 1675.05 | 472 | 456 | 116.9 |
| D | 13 | 172 | 160094 | 1365.21 | 472 | 456 | 116.9 |
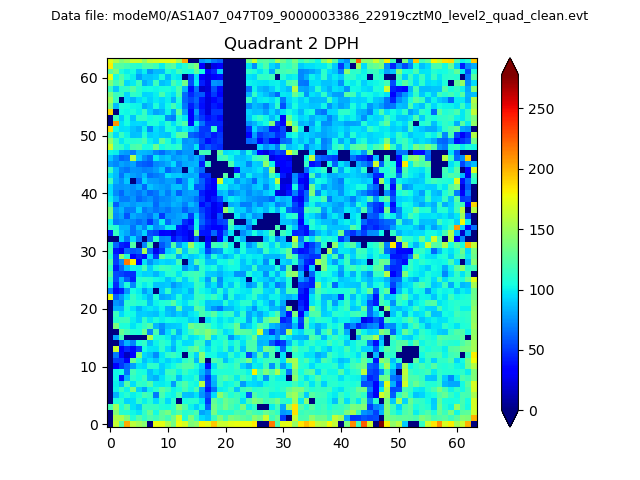
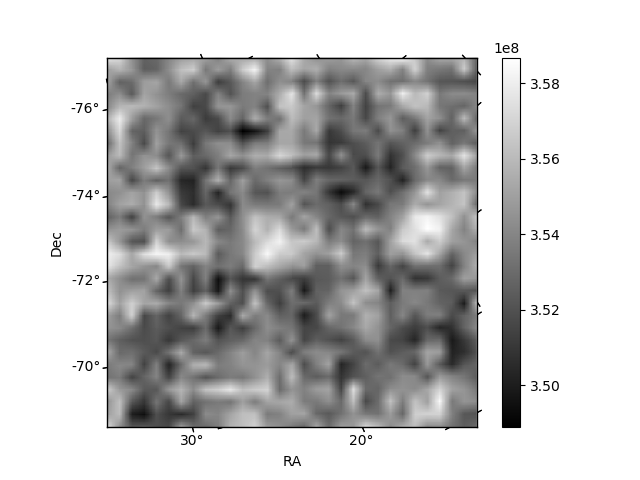
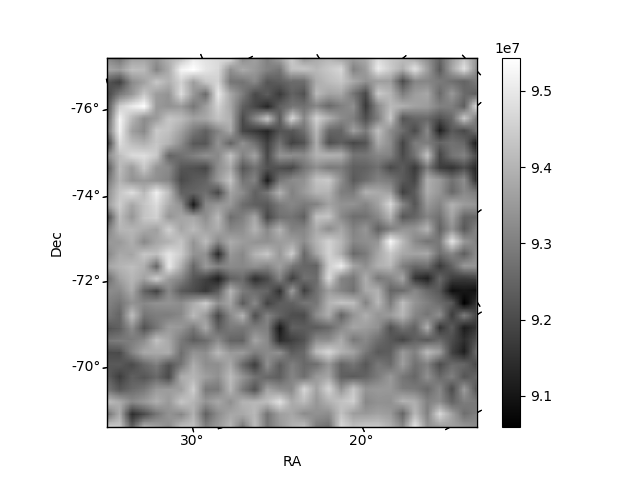
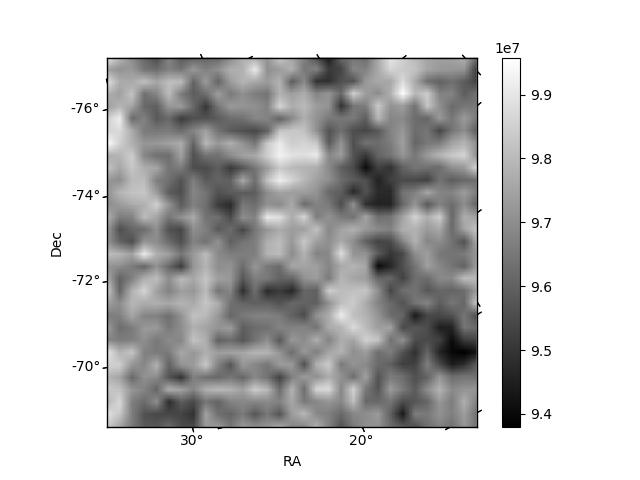
Histogram calculated using DETX and DETY for each event in the final _common_clean file
| Quadrant A | 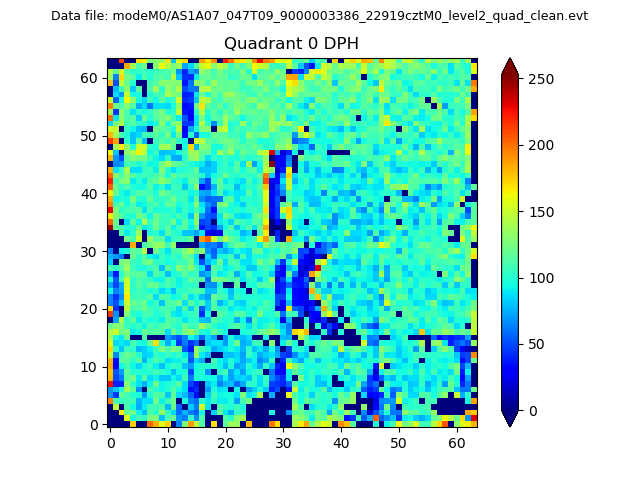 |
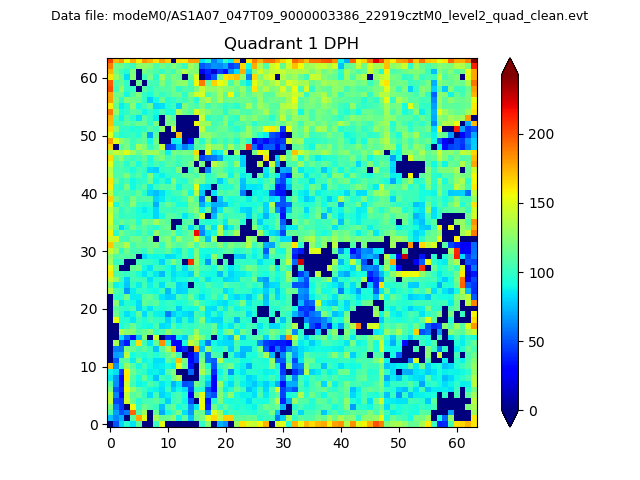 |
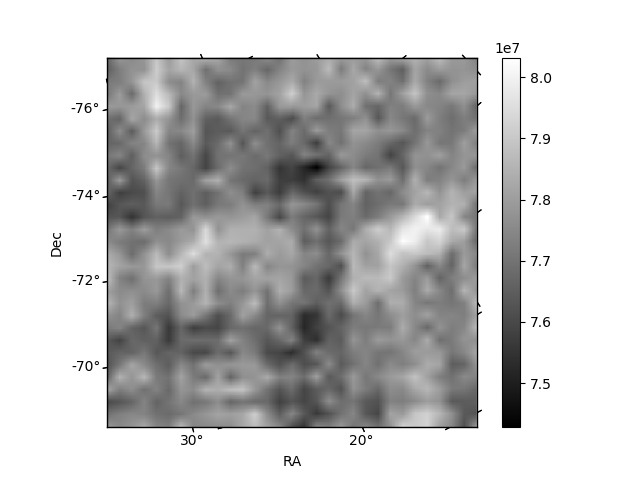
Quadrant B |
|---|---|---|---|
| Quadrant D | 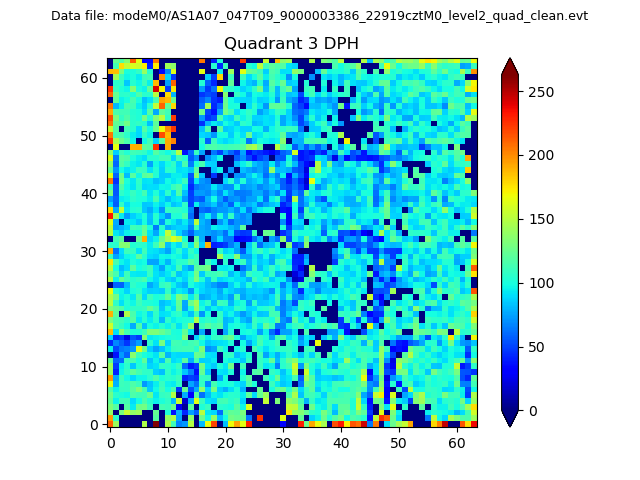 |
 |
Quadrant C |
| Plot type | Count rate plots | Images |
|---|---|---|
| Comparison with Poisson distribution Blue bars denote a histogram of data divided into 1 sec bins. Red curve is a Poisson curve with rate = median count rate of data. |
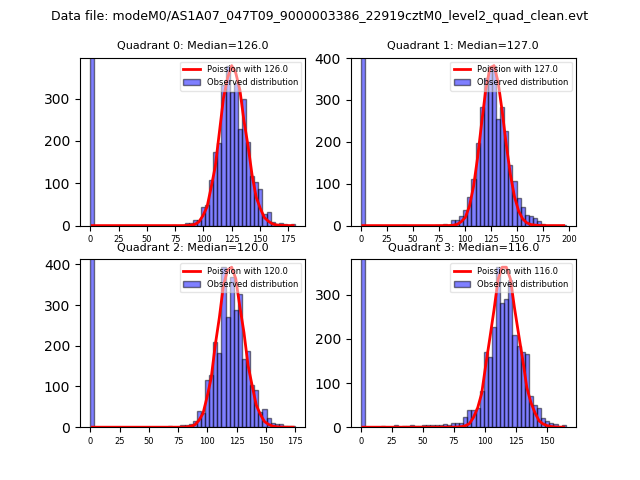 |
 |
| Quadrant-wise count rates Data is divided into 100 sec bins |
 |
|
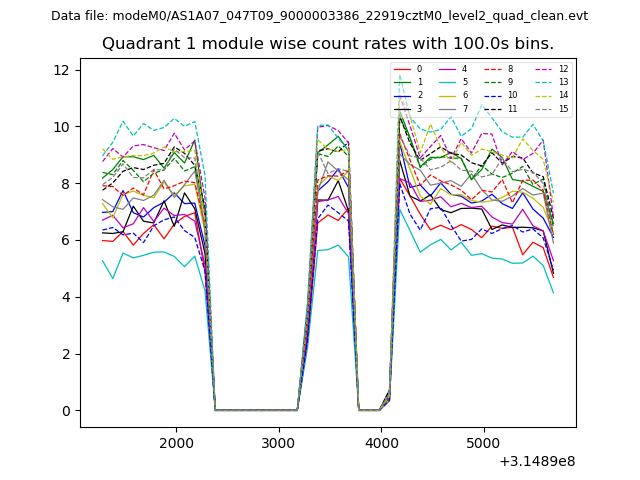
| Module-wise count rates for Quadrant A Data is divided into 100 sec bins |
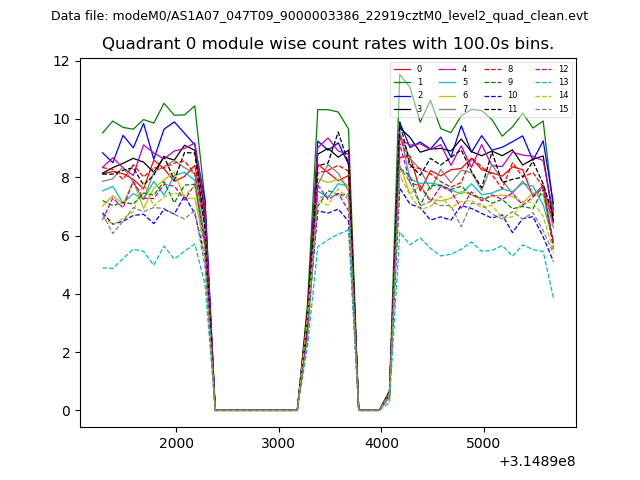 |
 |
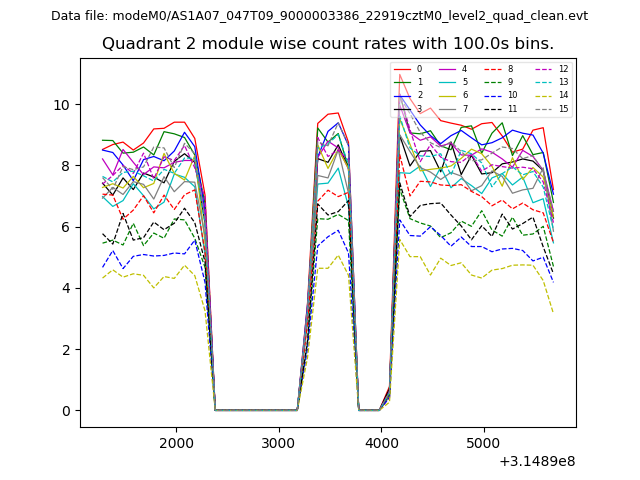
| Module-wise count rates for Quadrant B Data is divided into 100 sec bins |
 |
 |
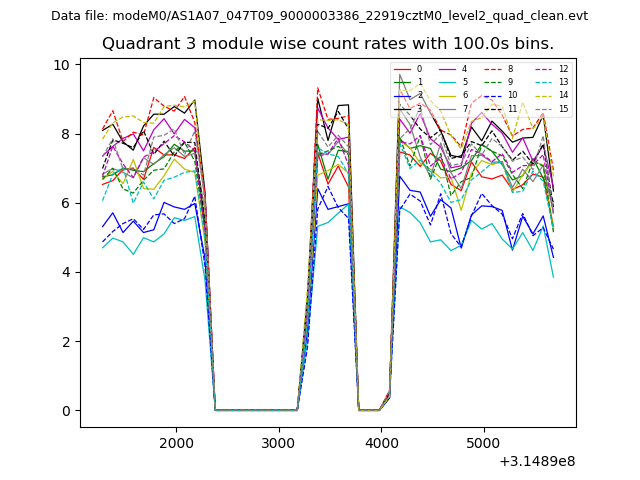
| Module-wise count rates for Quadrant C Data is divided into 100 sec bins |
 |
 |
| Module-wise count rates for Quadrant D Data is divided into 100 sec bins |
 |
 |
| Parameter | Plot |
|---|---|
| CZT HV Monitor |  |
| D_VDD | 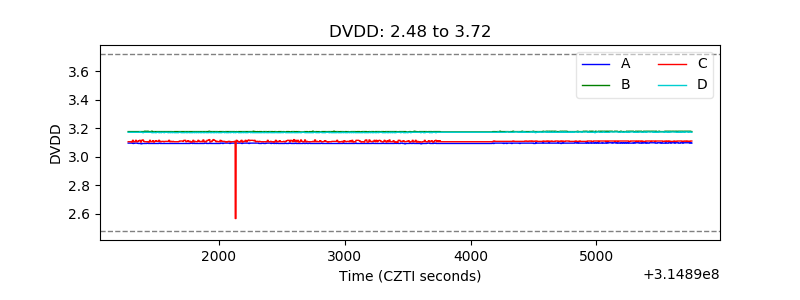 |
| Temperature 1 | 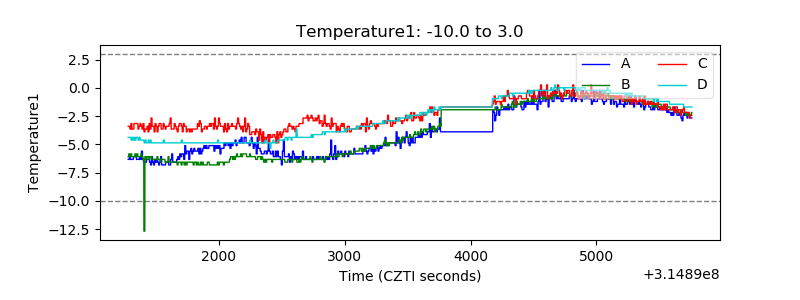 |
| Veto HV Monitor | 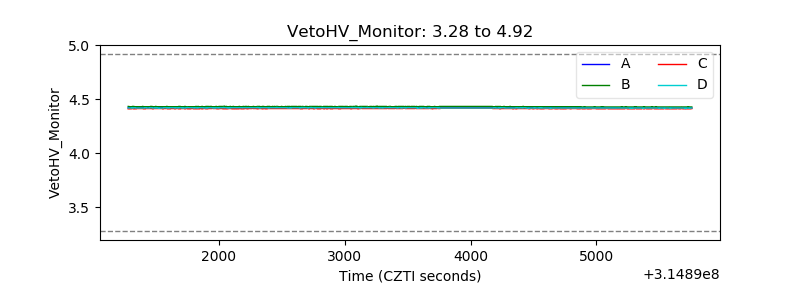 |
| Veto LLD | 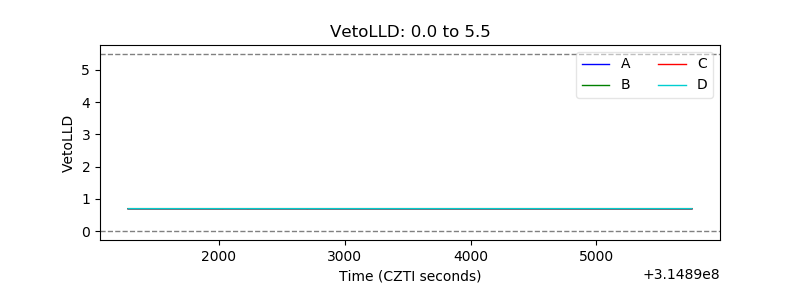 |
| Alpha Counter | 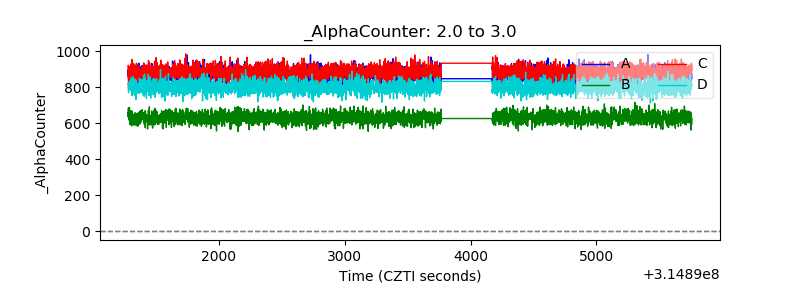 |
| _CPM_Rate | 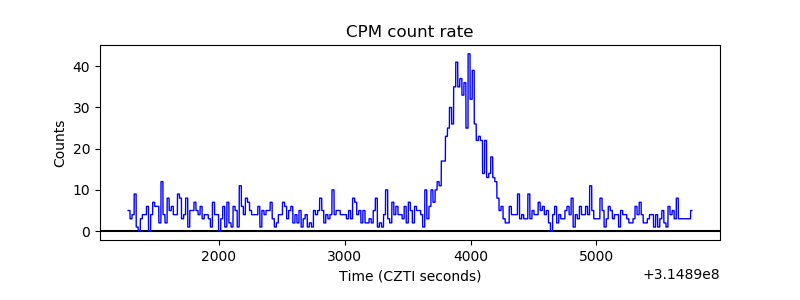 |
| CZT Counter | 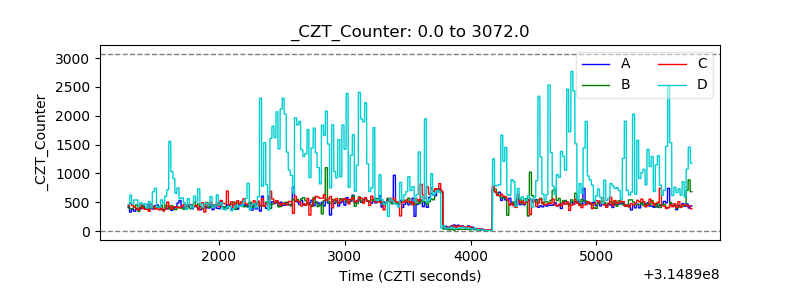 |
| +2.5 Volts monitor |  |
| +5 Volts monitor |  |
| _ROLL_ROT | 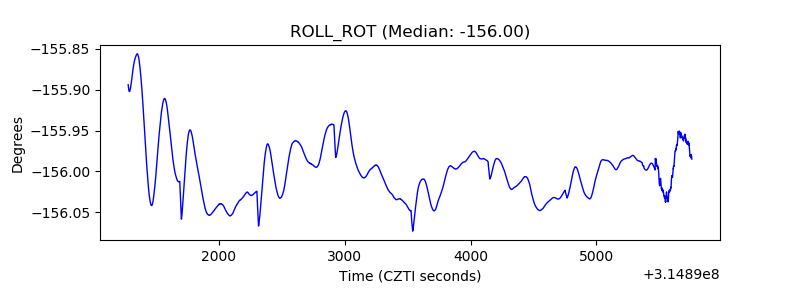 |
| _Roll_DEC | 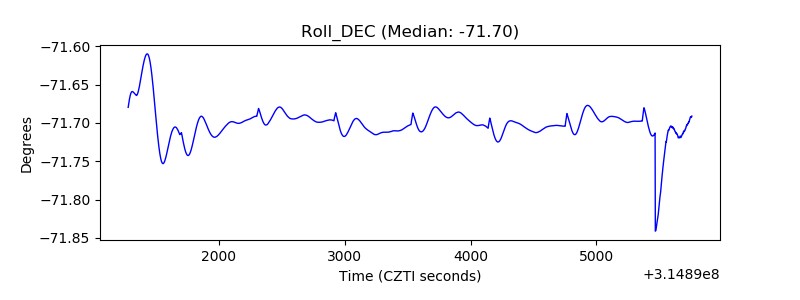 |
| _Roll_RA | 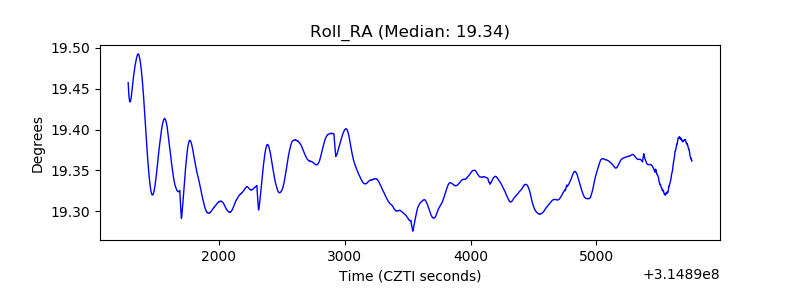 |
| Veto Counter | 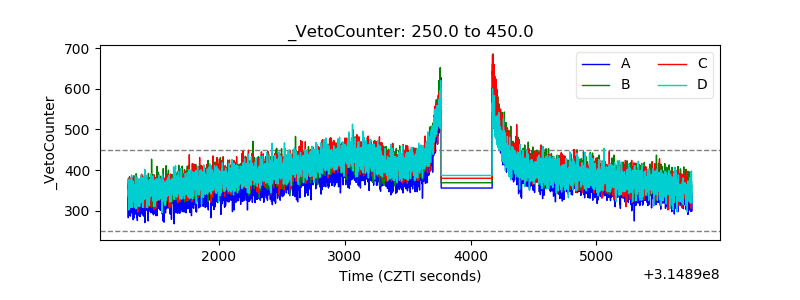 |