| Param | Original file | Final file |
|---|---|---|
| Filename | modeM0/AS1A07_047T09_9000003386_22922cztM0_level2.evt | modeM0/AS1A07_047T09_9000003386_22922cztM0_level2_quad_clean.evt |
| Size (bytes) | 193,510,080 | 46,347,840 |
| Size | 184.5 MB | 44.2 MB |
| Events in quadrant A | 1,166,702 | 314,212 |
| Events in quadrant B | 1,301,934 | 318,873 |
| Events in quadrant C | 1,166,159 | 302,501 |
| Events in quadrant D | 2,051,513 | 285,842 |
| Mode M0 | |||
|---|---|---|---|
| Quadrant | BADHDUFLAG | Total packets | Discarded packets |
| A | 0 | 5141 | 1 |
| B | 0 | 5500 | 1 |
| C | 0 | 5180 | 1 |
| D | 0 | 7938 | 1 |
| Mode SS | |||
|---|---|---|---|
| Quadrant | BADHDUFLAG | Total packets | Discarded packets |
| A | 0 | 52 | 0 |
| B | 0 | 52 | 0 |
| C | 0 | 52 | 0 |
| D | 0 | 52 | 0 |
| Mode M9 | |||
|---|---|---|---|
| Quadrant | BADHDUFLAG | Total packets | Discarded packets |
| A | 0 | 6 | 0 |
| B | 0 | 6 | 0 |
| C | 0 | 6 | 0 |
| D | 0 | 6 | 0 |
| Quadrant | Total seconds | Saturated seconds | Saturation percentage |
|---|---|---|---|
| A | 2533 | 8 | 0.315831% |
| B | 2534 | 15 | 0.591949% |
| C | 2534 | 12 | 0.473560% |
| D | 2534 | 200 | 7.892660% |
Noise dominated data is calculated using 1-second bins in cleaned event files. If a bin has >2000 counts, and if more than 50% of those come from <1% of pixels, then it is considered to be noise-dominated and hence unusable.
| Quadrant | # 1 sec bins | Bins with >0 counts | Bins with >2000 counts | High rate bins dominated by noise | Noise dominated (total time) | Noise dominated (detector-on time) | Marked lightcurve |
|---|---|---|---|---|---|---|---|
| A | 3138 | 2534 | 0 | 0 | 0.00% | 0.00% | 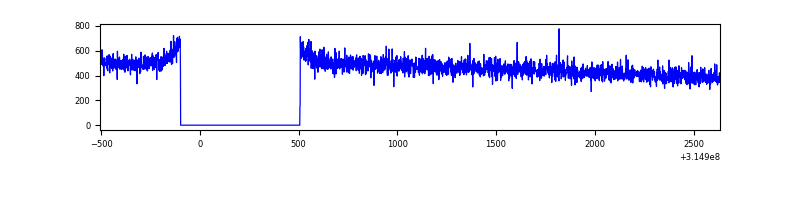 |
| B | 3139 | 2535 | 1 | 1 | 0.03% | 0.04% | 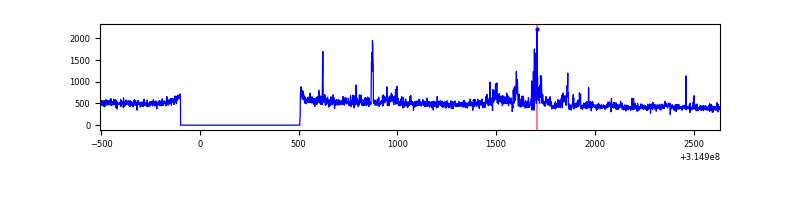 |
| C | 3139 | 2535 | 0 | 0 | 0.00% | 0.00% | 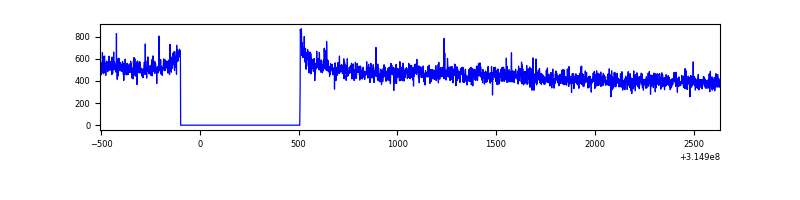 |
| D | 3139 | 2535 | 121 | 121 | 3.85% | 4.77% | 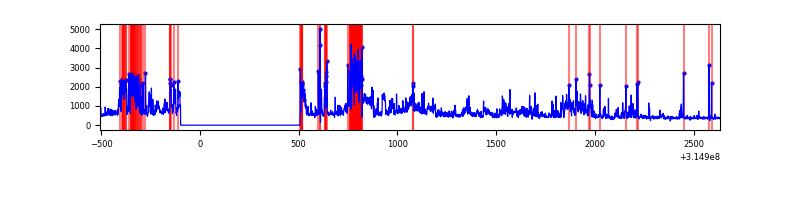 |
Top three noisy pixels from each quadrant. If the there are fewer than three noisy pixels in the level2.evt file, extra rows are filled as -1
| Pixel properties | Quadrant properties | ||||||
|---|---|---|---|---|---|---|---|
| Quadrant | DetID | PixID | Counts | Sigma | Mean | Median | Sigma |
| A | 0 | 23 | 5394 | 81.23 | 300 | 293 | 62.8 |
| A | 13 | 254 | 4763 | 71.19 | 300 | 293 | 62.8 |
| A | 0 | 226 | 3011 | 43.28 | 300 | 293 | 62.8 |
| B | 0 | 190 | 84879 | 1437.6 | 299 | 292 | 58.8 |
| B | 0 | 228 | 14724 | 245.28 | 299 | 292 | 58.8 |
| B | 0 | 197 | 13318 | 221.38 | 299 | 292 | 58.8 |
| C | 14 | 238 | 45026 | 666.78 | 279 | 279 | 67.1 |
| C | 6 | 80 | 21927 | 322.58 | 279 | 279 | 67.1 |
| C | 7 | 247 | 8226 | 118.42 | 279 | 279 | 67.1 |
| D | 1 | 52 | 656911 | 9416.22 | 277 | 267 | 69.7 |
| D | 13 | 172 | 218437 | 3128.54 | 277 | 267 | 69.7 |
| D | 12 | 233 | 38456 | 547.63 | 277 | 267 | 69.7 |
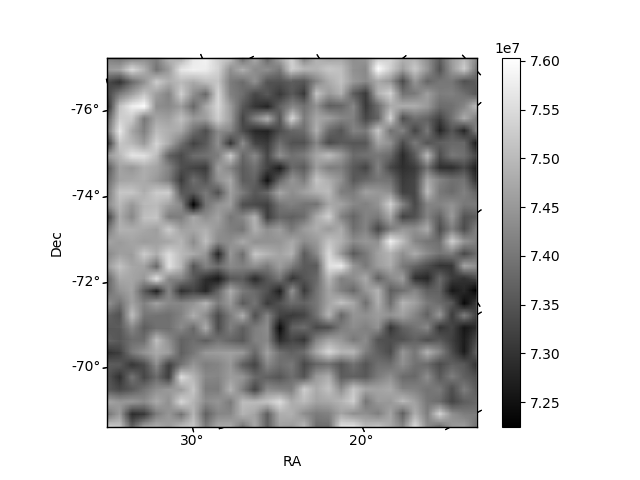
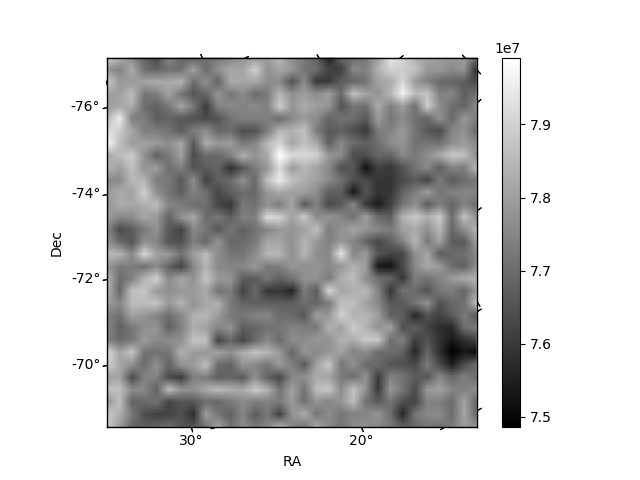
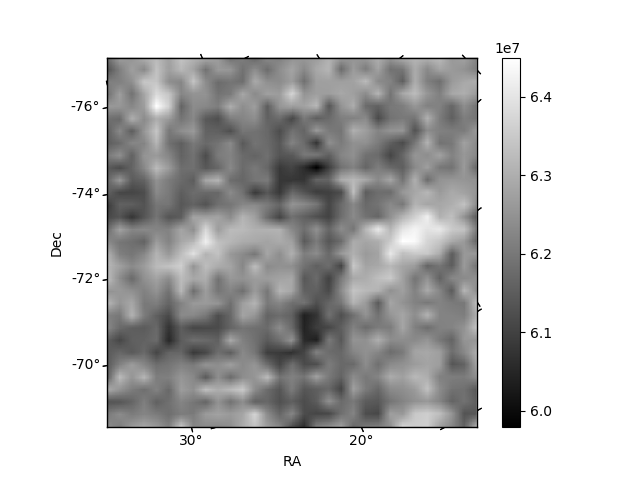
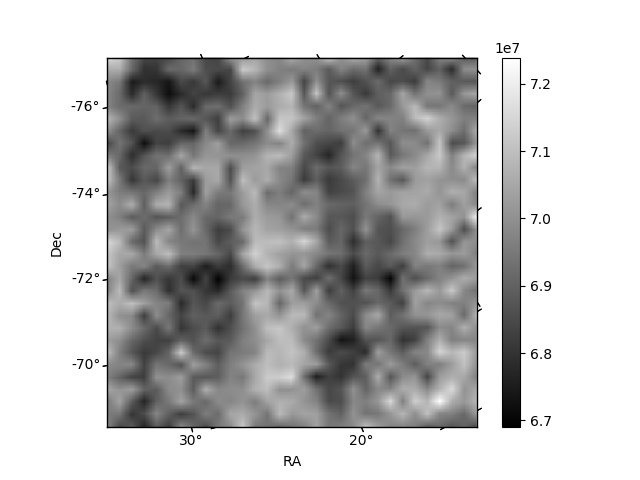
Histogram calculated using DETX and DETY for each event in the final _common_clean file
| Quadrant A | 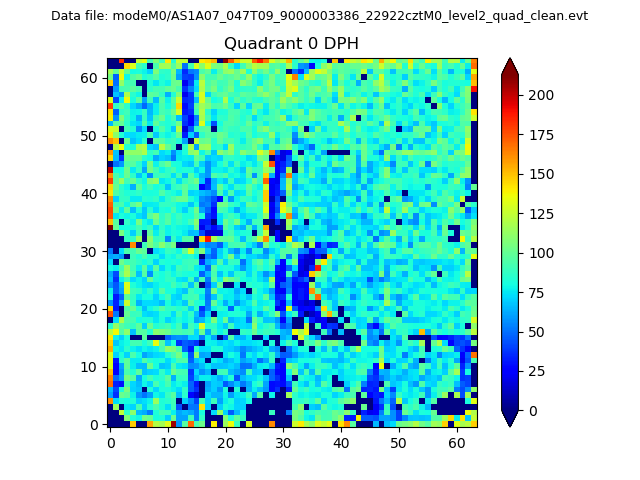 |
 |
Quadrant B |
|---|---|---|---|
| Quadrant D | 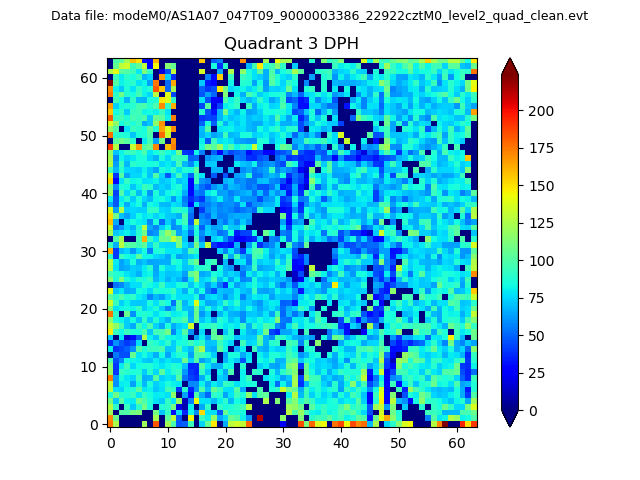 |
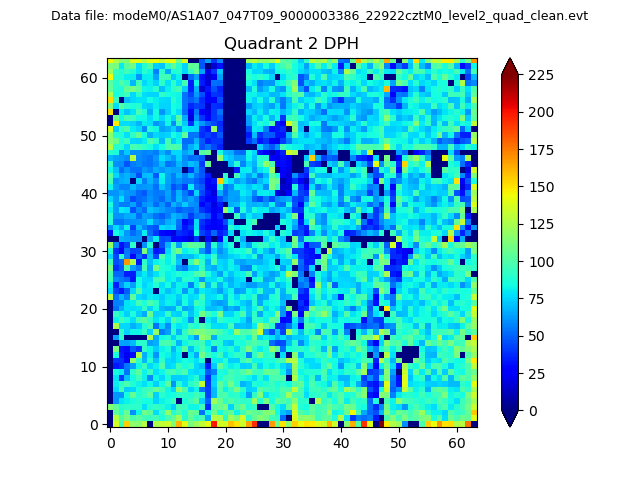 |
Quadrant C |
| Plot type | Count rate plots | Images |
|---|---|---|
| Comparison with Poisson distribution Blue bars denote a histogram of data divided into 1 sec bins. Red curve is a Poisson curve with rate = median count rate of data. |
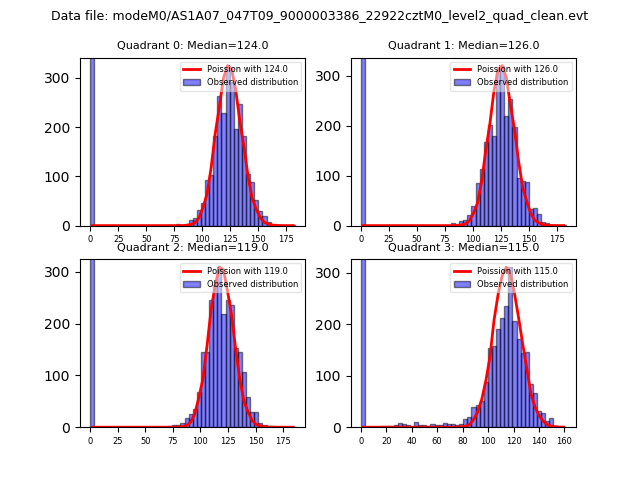 |
 |
| Quadrant-wise count rates Data is divided into 100 sec bins |
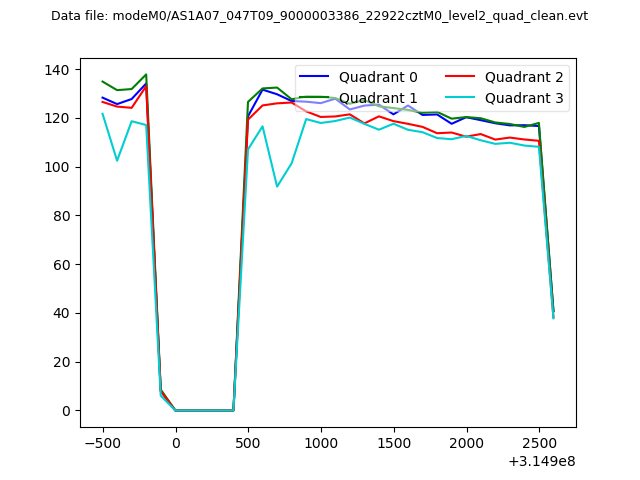 |
|
| Module-wise count rates for Quadrant A Data is divided into 100 sec bins |
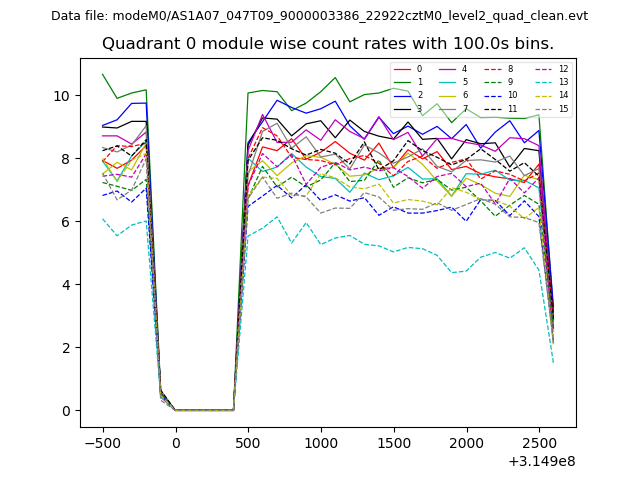 |
 |
| Module-wise count rates for Quadrant B Data is divided into 100 sec bins |
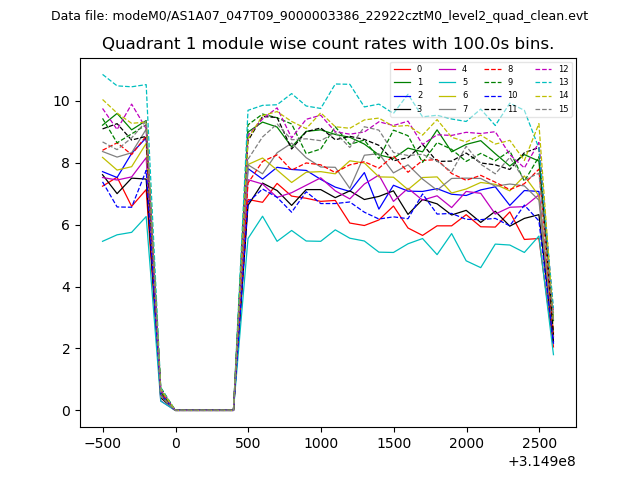 |
 |
| Module-wise count rates for Quadrant C Data is divided into 100 sec bins |
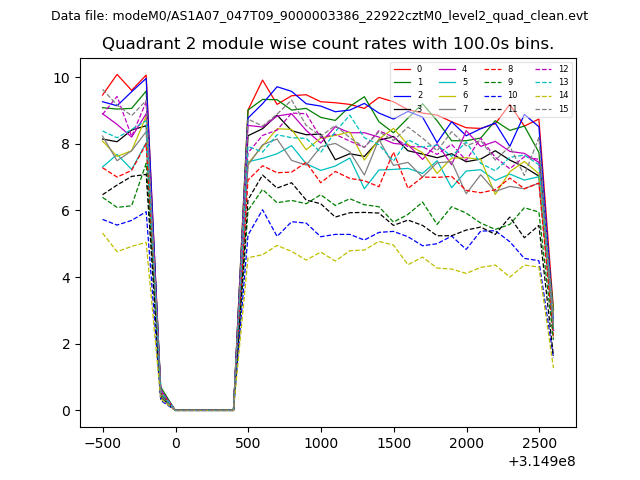 |
 |
| Module-wise count rates for Quadrant D Data is divided into 100 sec bins |
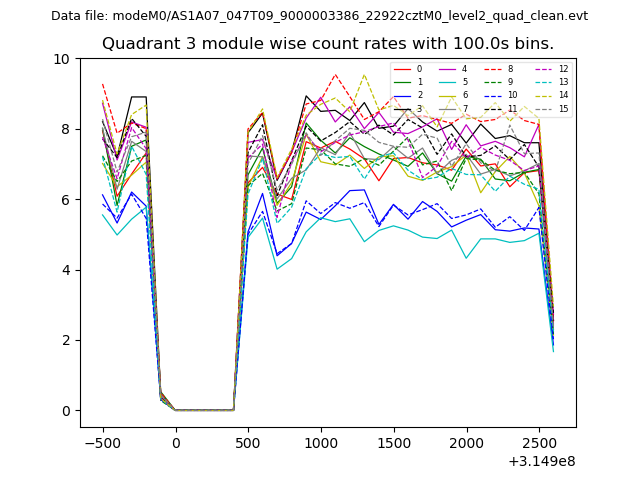 |
 |
| Parameter | Plot |
|---|---|
| CZT HV Monitor | 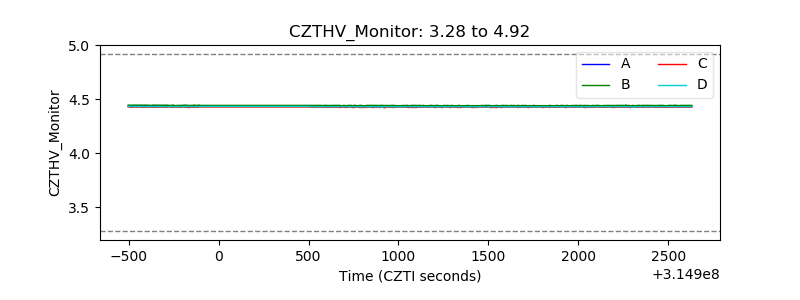 |
| D_VDD | 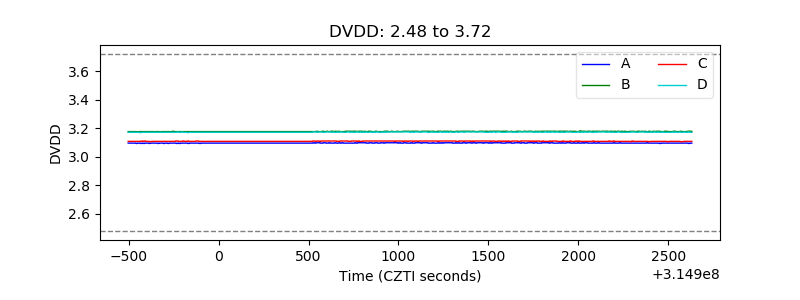 |
| Temperature 1 | 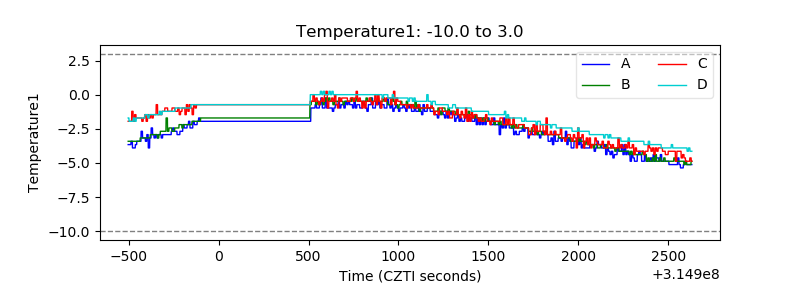 |
| Veto HV Monitor | 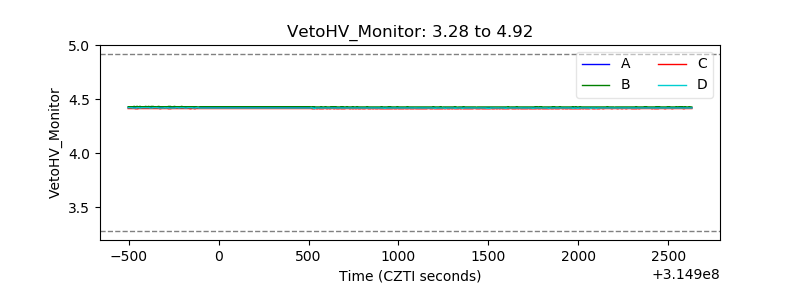 |
| Veto LLD | 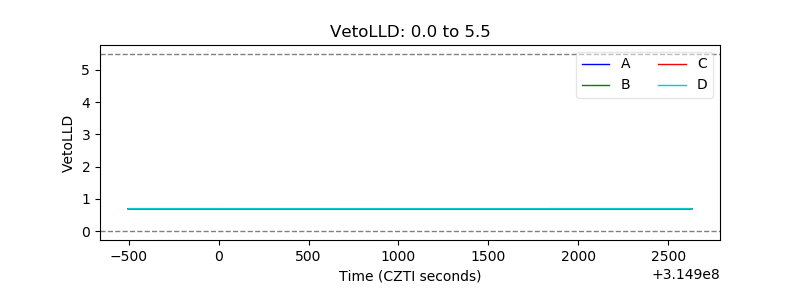 |
| Alpha Counter | 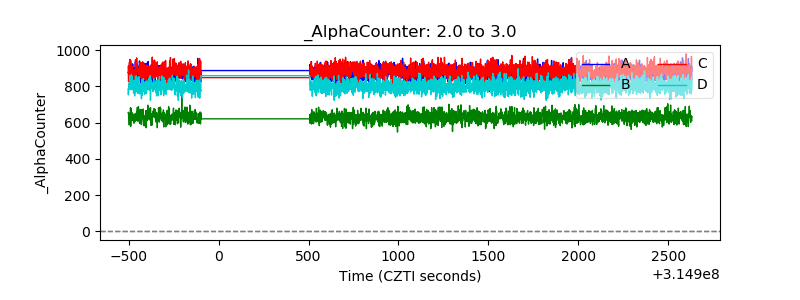 |
| _CPM_Rate | 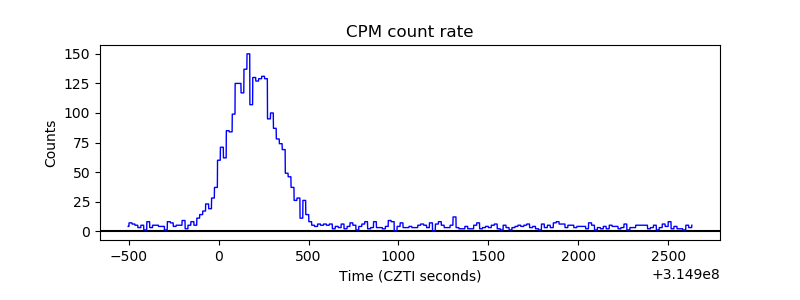 |
| CZT Counter |  |
| +2.5 Volts monitor | 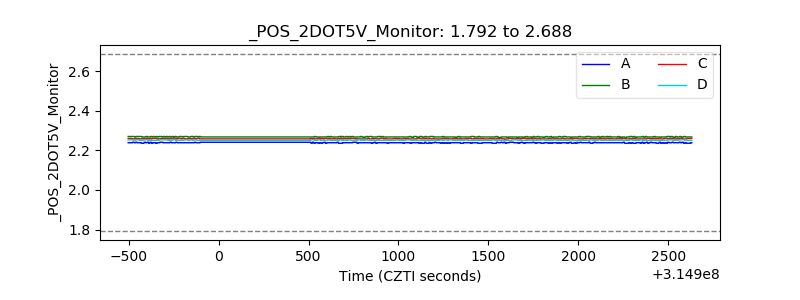 |
| +5 Volts monitor | 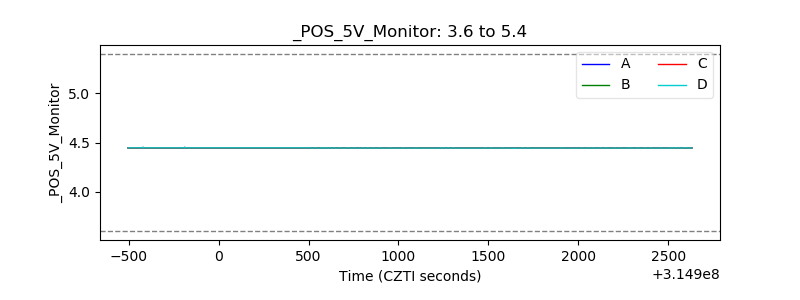 |
| _ROLL_ROT | 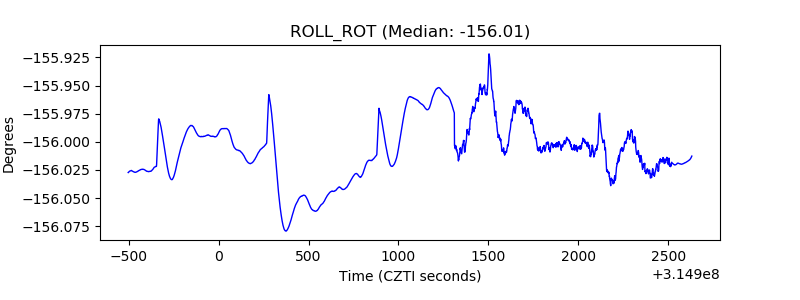 |
| _Roll_DEC | 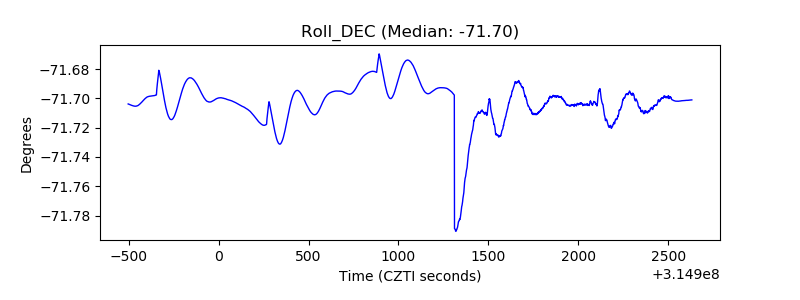 |
| _Roll_RA |  |
| Veto Counter | 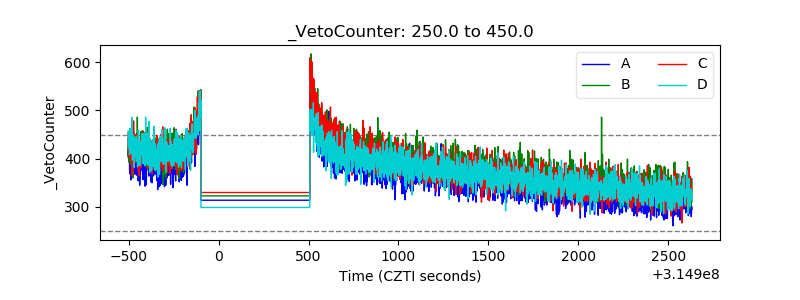 |