| Param | Original file | Final file |
|---|---|---|
| Filename | modeM0/AS1T03_170T01_9000003388cztM0_level2.fits | modeM0/AS1T03_170T01_9000003388cztM0_level2_quad_clean.evt |
| Size (bytes) | 698,673,600 | 624,044,160 |
| Size | 666.3 MB | 595.1 MB |
| Events in quadrant A | 4,316,908 | 3,707,464 |
| Events in quadrant B | 4,141,834 | 3,708,397 |
| Events in quadrant C | 4,255,820 | 3,528,003 |
| Events in quadrant D | 3,603,844 | 3,114,341 |
| Mode SS | |||
|---|---|---|---|
| Quadrant | BADHDUFLAG | Total packets | Discarded packets |
| A | 0 | 1436 | 0 |
| B | 0 | 1436 | 0 |
| C | 0 | 1436 | 0 |
| D | 0 | 1436 | 0 |
| Mode M9 | |||
|---|---|---|---|
| Quadrant | BADHDUFLAG | Total packets | Discarded packets |
| A | 0 | 115 | 0 |
| B | 0 | 115 | 0 |
| C | 0 | 115 | 0 |
| D | 0 | 115 | 0 |
| Mode M0 | |||
|---|---|---|---|
| Quadrant | BADHDUFLAG | Total packets | Discarded packets |
| A | 0 | 147018 | 0 |
| B | 0 | 148728 | 0 |
| C | 0 | 150693 | 0 |
| D | 0 | 205072 | 0 |
| Quadrant | Total seconds | Saturated seconds | Saturation percentage |
|---|---|---|---|
| A | 70578 | 802 | 1.136331% |
| B | 70578 | 916 | 1.297855% |
| C | 70578 | 1207 | 1.710165% |
| D | 70578 | 4065 | 5.759585% |
Noise dominated data is calculated using 1-second bins in cleaned event files. If a bin has >2000 counts, and if more than 50% of those come from <1% of pixels, then it is considered to be noise-dominated and hence unusable.
| Quadrant | # 1 sec bins | Bins with >0 counts | Bins with >2000 counts | High rate bins dominated by noise | Noise dominated (total time) | Noise dominated (detector-on time) | Marked lightcurve |
|---|---|---|---|---|---|---|---|
| A | 82144 | 70578 | 0 | 0 | 0.00% | 0.00% |  |
| B | 82144 | 70578 | 0 | 0 | 0.00% | 0.00% |  |
| C | 82144 | 70578 | 0 | 0 | 0.00% | 0.00% |  |
| D | 82144 | 70504 | 0 | 0 | 0.00% | 0.00% |  |
Top three noisy pixels from each quadrant. If the there are fewer than three noisy pixels in the level2.evt file, extra rows are filled as -1
| Pixel properties | Quadrant properties | ||||||
|---|---|---|---|---|---|---|---|
| Quadrant | DetID | PixID | Counts | Sigma | Mean | Median | Sigma |
| A | 0 | 29 | 4077 | 11.04 | 1123 | 1059 | 273.3 |
| A | 7 | 110 | 3490 | 8.89 | 1123 | 1059 | 273.3 |
| A | 0 | 30 | 3169 | 7.72 | 1123 | 1059 | 273.3 |
| B | 2 | 9 | 3366 | 10.8 | 1097 | 1048 | 214.5 |
| B | 2 | 8 | 2835 | 8.33 | 1097 | 1048 | 214.5 |
| B | 3 | 17 | 2750 | 7.93 | 1097 | 1048 | 214.5 |
| C | 1 | 81 | 3199 | 7.53 | 1122 | 1052 | 285.3 |
| C | 1 | 80 | 3152 | 7.36 | 1122 | 1052 | 285.3 |
| C | 3 | 234 | 3082 | 7.11 | 1122 | 1052 | 285.3 |
| D | 3 | 14 | 2595 | 6.08 | 1030 | 940 | 272.1 |
| D | 10 | 189 | 2573 | 6.0 | 1030 | 940 | 272.1 |
| D | 6 | 38 | 2507 | 5.76 | 1030 | 940 | 272.1 |
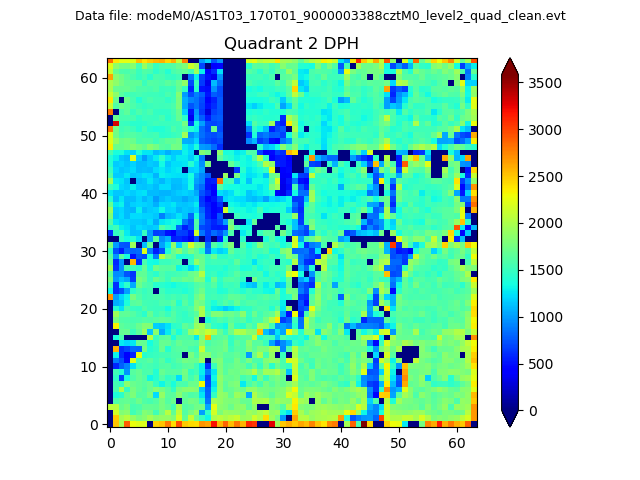
Histogram calculated using DETX and DETY for each event in the final _common_clean file
| Quadrant A | 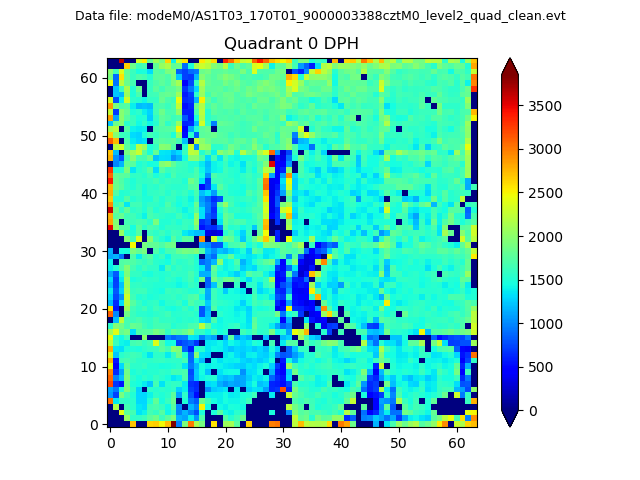 |
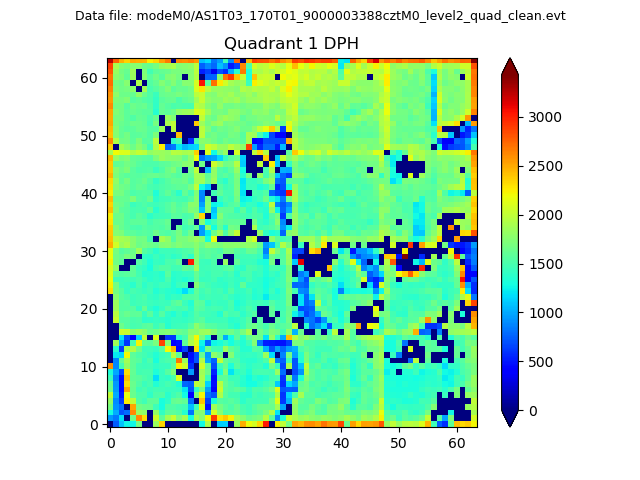 |
Quadrant B |
|---|---|---|---|
| Quadrant D | 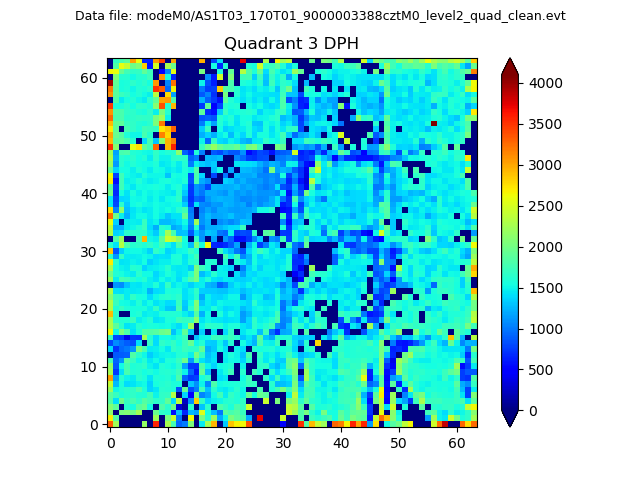 |
 |
Quadrant C |
| Plot type | Count rate plots | Images |
|---|---|---|
| Comparison with Poisson distribution Blue bars denote a histogram of data divided into 1 sec bins. Red curve is a Poisson curve with rate = median count rate of data. |
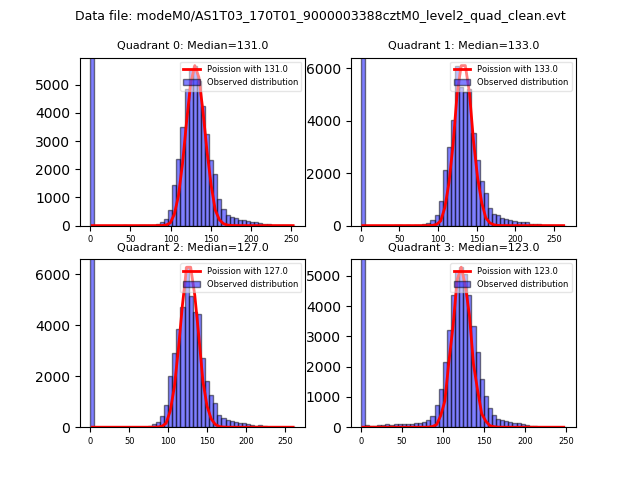 |
 |
| Quadrant-wise count rates Data is divided into 100 sec bins |
 |
|
| Module-wise count rates for Quadrant A Data is divided into 100 sec bins |
 |
 |
| Module-wise count rates for Quadrant B Data is divided into 100 sec bins |
 |
 |
| Module-wise count rates for Quadrant C Data is divided into 100 sec bins |
 |
 |
| Module-wise count rates for Quadrant D Data is divided into 100 sec bins |
 |
 |
| Parameter | Plot |
|---|---|
| CZT HV Monitor |  |
| D_VDD |  |
| Temperature 1 |  |
| Veto HV Monitor |  |
| Veto LLD |  |
| Alpha Counter |  |
| _CPM_Rate |  |
| CZT Counter | 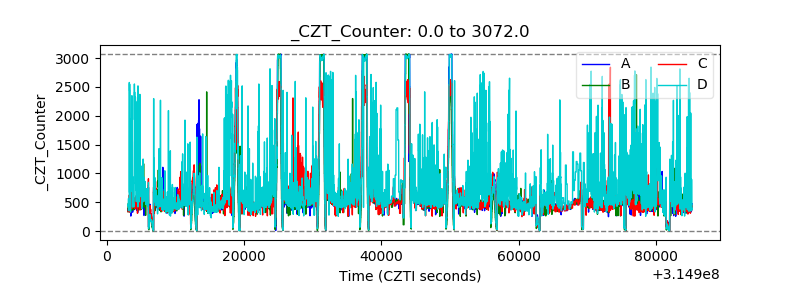 |
| +2.5 Volts monitor |  |
| +5 Volts monitor |  |
| _ROLL_ROT |  |
| _Roll_DEC |  |
| _Roll_RA |  |
| Veto Counter |  |