| Param | Original file | Final file |
|---|---|---|
| Filename | modeM0/AS1T03_170T01_9000003388_22922cztM0_level2.evt | modeM0/AS1T03_170T01_9000003388_22922cztM0_level2_quad_clean.evt |
| Size (bytes) | 740,577,600 | 118,287,360 |
| Size | 706.3 MB | 112.8 MB |
| Events in quadrant A | 5,116,315 | 738,092 |
| Events in quadrant B | 4,841,752 | 755,099 |
| Events in quadrant C | 4,953,850 | 712,185 |
| Events in quadrant D | 6,846,276 | 690,532 |
| Mode SS | |||
|---|---|---|---|
| Quadrant | BADHDUFLAG | Total packets | Discarded packets |
| A | 0 | 200 | 0 |
| B | 0 | 200 | 0 |
| C | 0 | 200 | 0 |
| D | 0 | 200 | 0 |
| Mode M9 | |||
|---|---|---|---|
| Quadrant | BADHDUFLAG | Total packets | Discarded packets |
| A | 0 | 17 | 0 |
| B | 0 | 17 | 0 |
| C | 0 | 17 | 0 |
| D | 0 | 17 | 0 |
| Mode M0 | |||
|---|---|---|---|
| Quadrant | BADHDUFLAG | Total packets | Discarded packets |
| A | 0 | 21904 | 2 |
| B | 0 | 20812 | 2 |
| C | 0 | 21308 | 2 |
| D | 0 | 26997 | 2 |
| Quadrant | Total seconds | Saturated seconds | Saturation percentage |
|---|---|---|---|
| A | 9906 | 132 | 1.332526% |
| B | 9906 | 47 | 0.474460% |
| C | 9906 | 101 | 1.019584% |
| D | 9906 | 419 | 4.229760% |
Noise dominated data is calculated using 1-second bins in cleaned event files. If a bin has >2000 counts, and if more than 50% of those come from <1% of pixels, then it is considered to be noise-dominated and hence unusable.
| Quadrant | # 1 sec bins | Bins with >0 counts | Bins with >2000 counts | High rate bins dominated by noise | Noise dominated (total time) | Noise dominated (detector-on time) | Marked lightcurve |
|---|---|---|---|---|---|---|---|
| A | 11551 | 9908 | 37 | 37 | 0.32% | 0.37% | 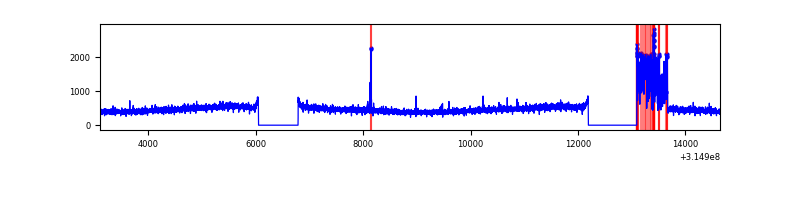 |
| B | 11551 | 9908 | 7 | 7 | 0.06% | 0.07% | 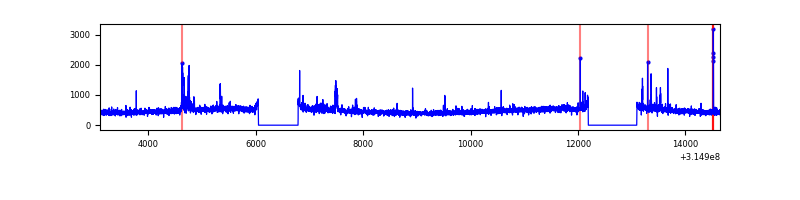 |
| C | 11551 | 9908 | 0 | 0 | 0.00% | 0.00% | 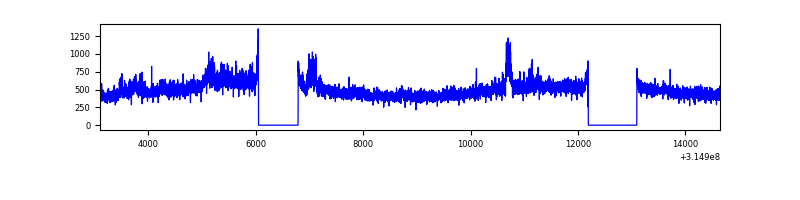 |
| D | 11551 | 9908 | 386 | 386 | 3.34% | 3.90% | 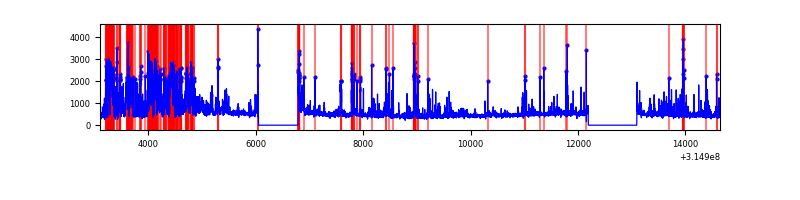 |
Top three noisy pixels from each quadrant. If the there are fewer than three noisy pixels in the level2.evt file, extra rows are filled as -1
| Pixel properties | Quadrant properties | ||||||
|---|---|---|---|---|---|---|---|
| Quadrant | DetID | PixID | Counts | Sigma | Mean | Median | Sigma |
| A | 0 | 23 | 527867 | 2227.65 | 1174 | 1149 | 236.4 |
| A | 0 | 226 | 42017 | 172.84 | 1174 | 1149 | 236.4 |
| A | 4 | 2 | 17672 | 69.88 | 1174 | 1149 | 236.4 |
| B | 4 | 173 | 68583 | 296.97 | 1181 | 1148 | 227.1 |
| B | 0 | 190 | 57323 | 247.38 | 1181 | 1148 | 227.1 |
| B | 0 | 228 | 39607 | 169.36 | 1181 | 1148 | 227.1 |
| C | 6 | 80 | 370662 | 1397.1 | 1128 | 1132 | 264.5 |
| C | 14 | 238 | 177098 | 665.28 | 1128 | 1132 | 264.5 |
| C | 13 | 61 | 7800 | 25.21 | 1128 | 1132 | 264.5 |
| D | 1 | 52 | 1848081 | 6673.0 | 1127 | 1092 | 276.8 |
| D | 13 | 153 | 270357 | 972.83 | 1127 | 1092 | 276.8 |
| D | 13 | 172 | 191011 | 686.16 | 1127 | 1092 | 276.8 |
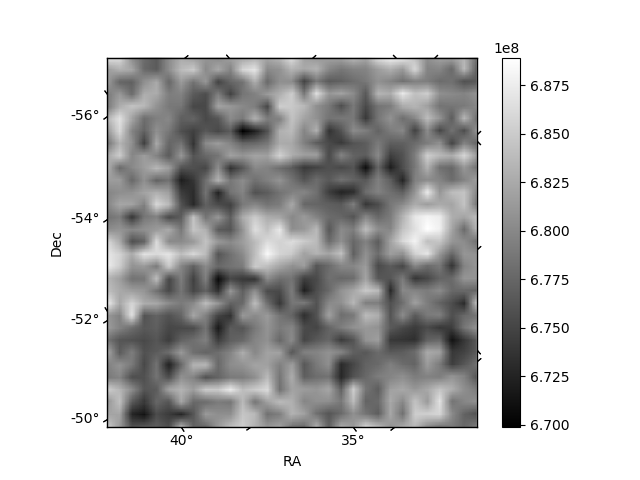
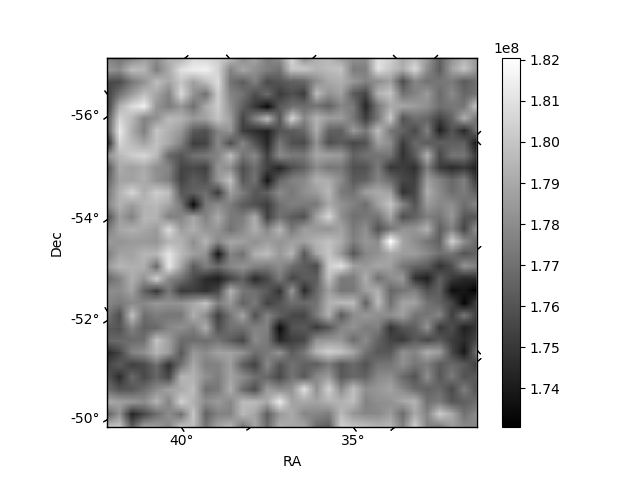
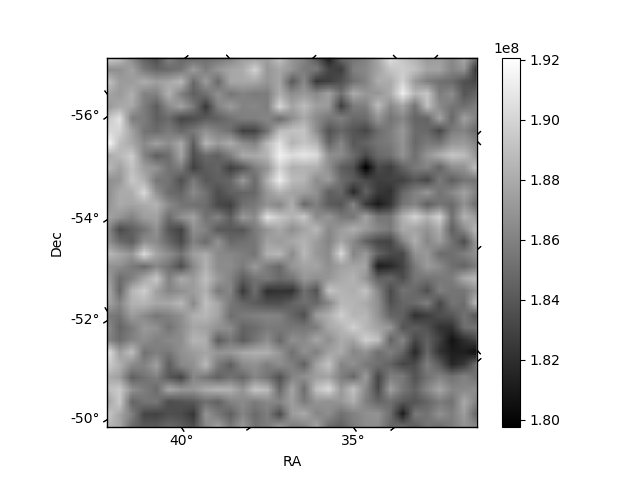
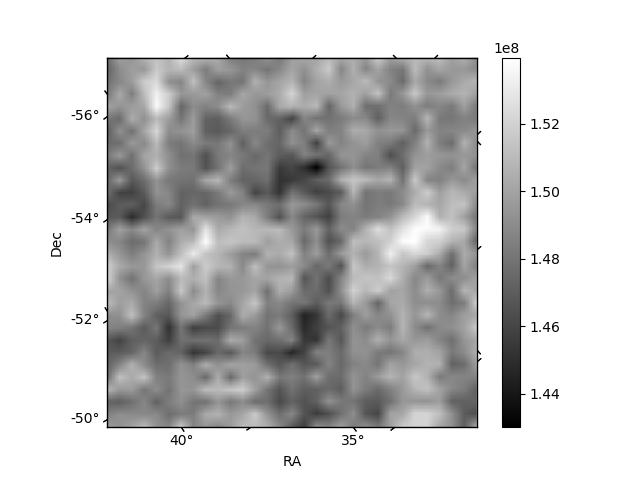
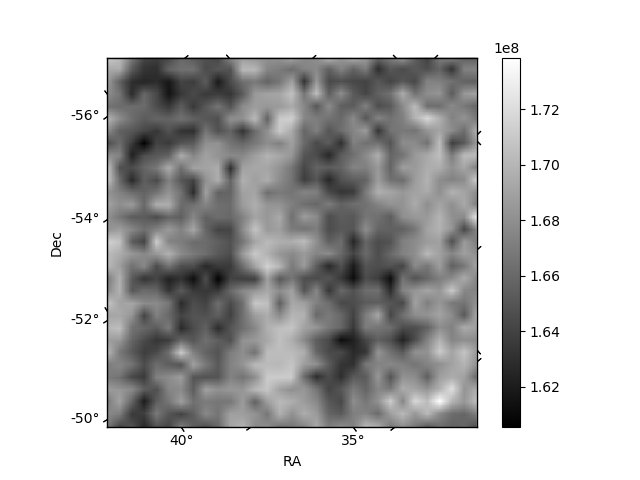
Histogram calculated using DETX and DETY for each event in the final _common_clean file
| Quadrant A | 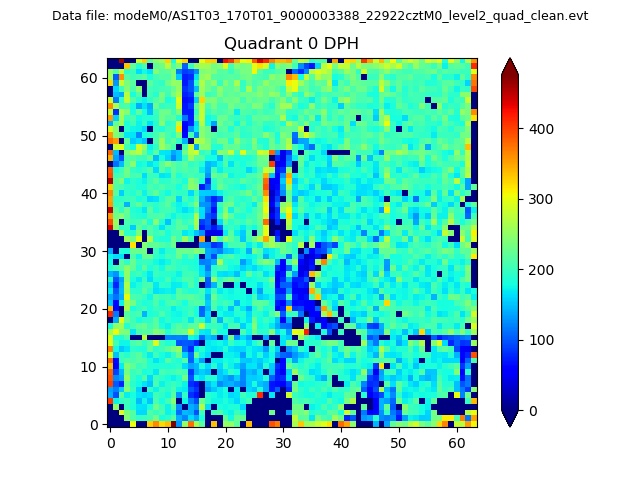 |
 |
Quadrant B |
|---|---|---|---|
| Quadrant D | 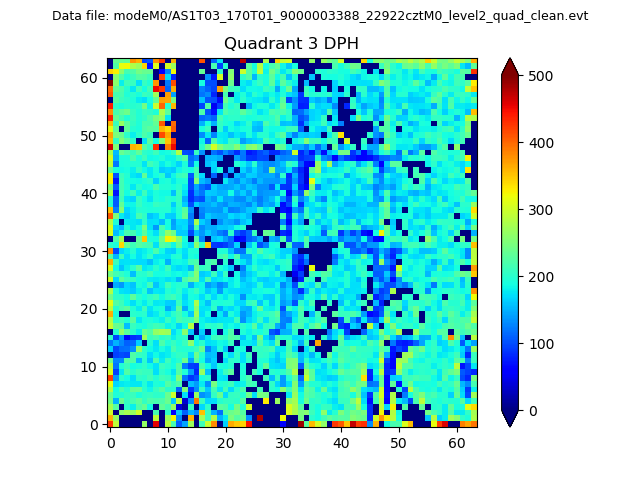 |
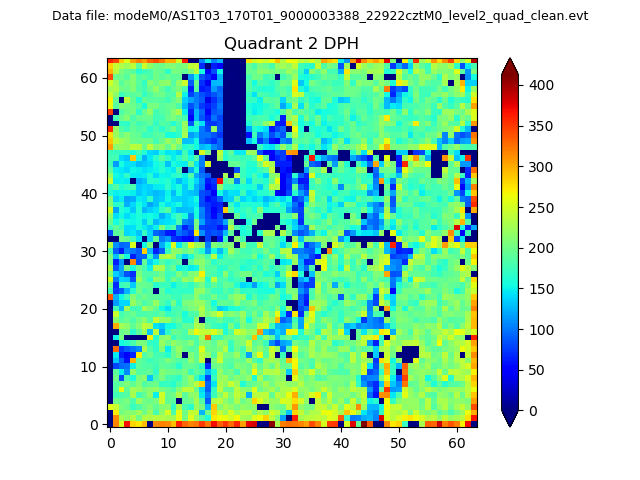 |
Quadrant C |
| Plot type | Count rate plots | Images |
|---|---|---|
| Comparison with Poisson distribution Blue bars denote a histogram of data divided into 1 sec bins. Red curve is a Poisson curve with rate = median count rate of data. |
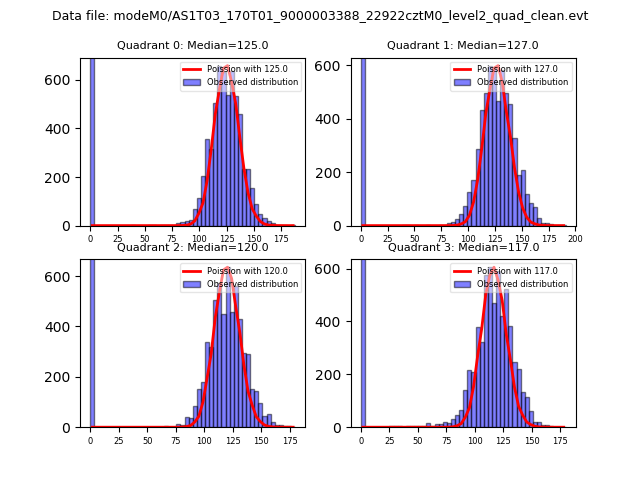 |
 |
| Quadrant-wise count rates Data is divided into 100 sec bins |
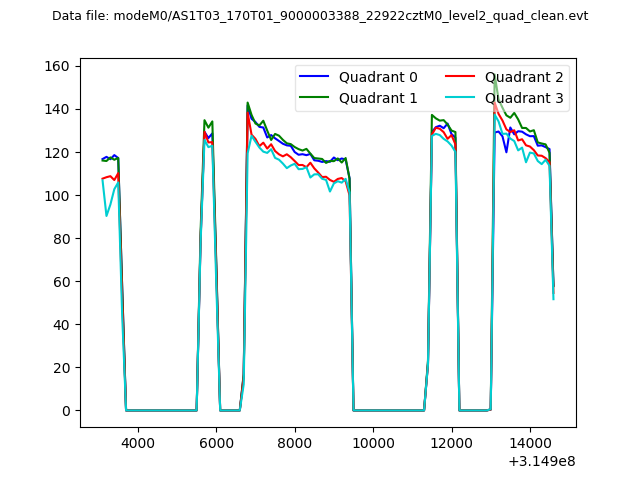 |
|
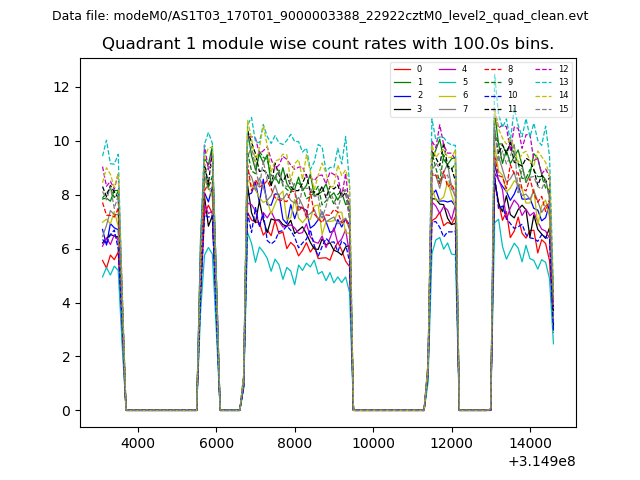
| Module-wise count rates for Quadrant A Data is divided into 100 sec bins |
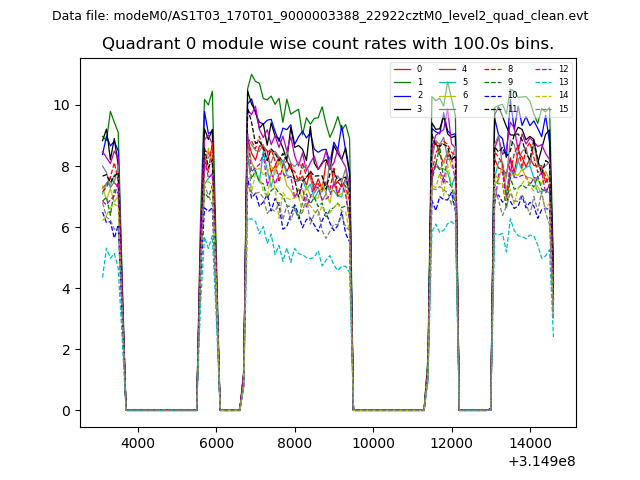 |
 |
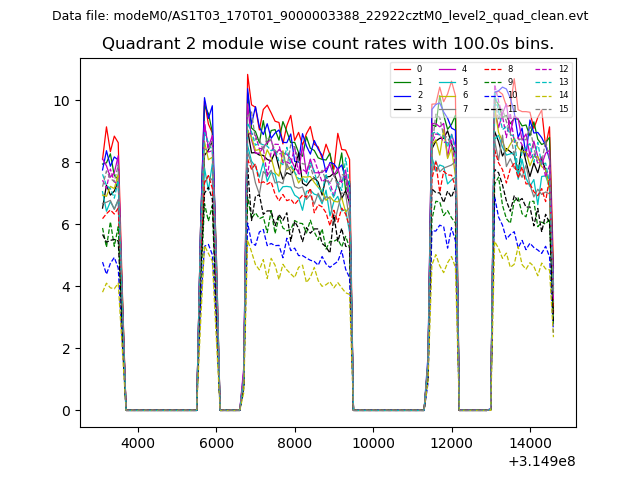
| Module-wise count rates for Quadrant B Data is divided into 100 sec bins |
 |
 |
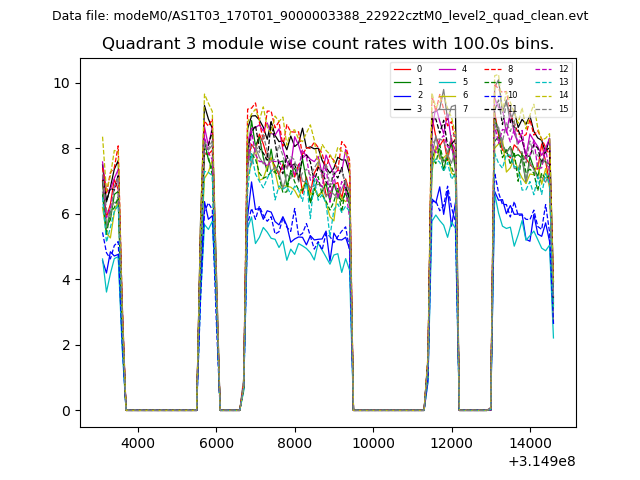
| Module-wise count rates for Quadrant C Data is divided into 100 sec bins |
 |
 |
| Module-wise count rates for Quadrant D Data is divided into 100 sec bins |
 |
 |
| Parameter | Plot |
|---|---|
| CZT HV Monitor | 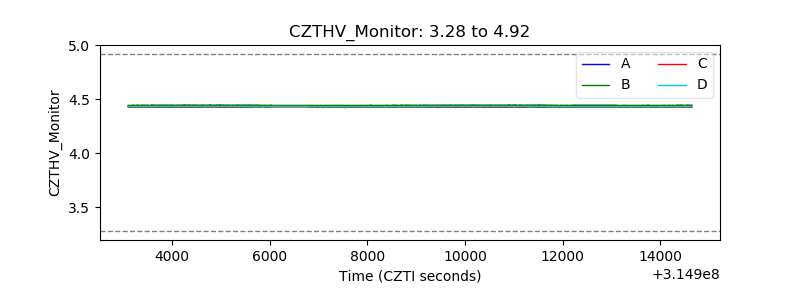 |
| D_VDD | 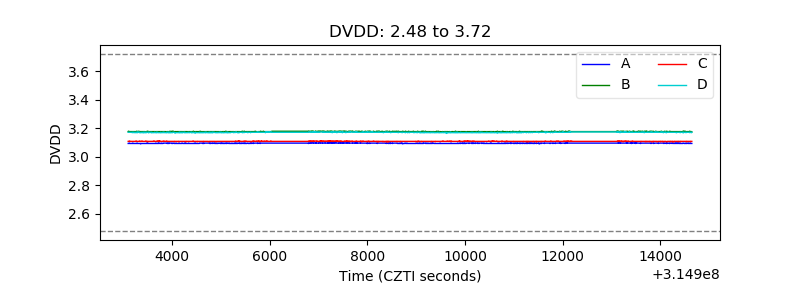 |
| Temperature 1 | 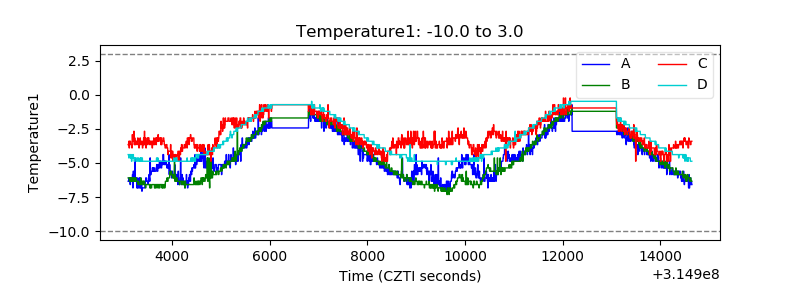 |
| Veto HV Monitor | 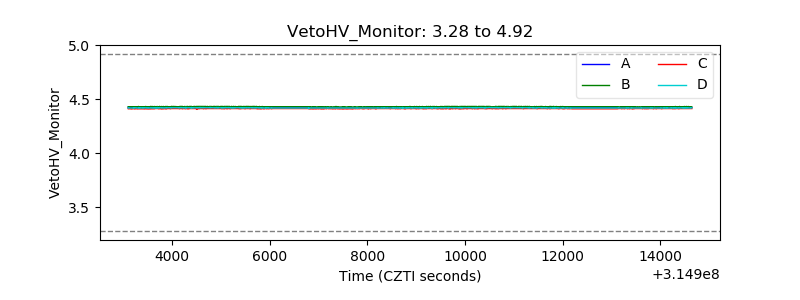 |
| Veto LLD | 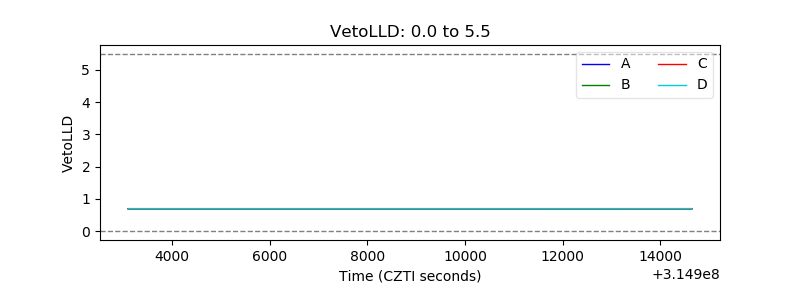 |
| Alpha Counter | 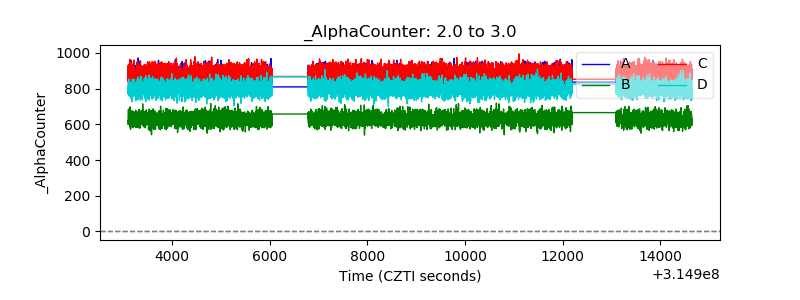 |
| _CPM_Rate | 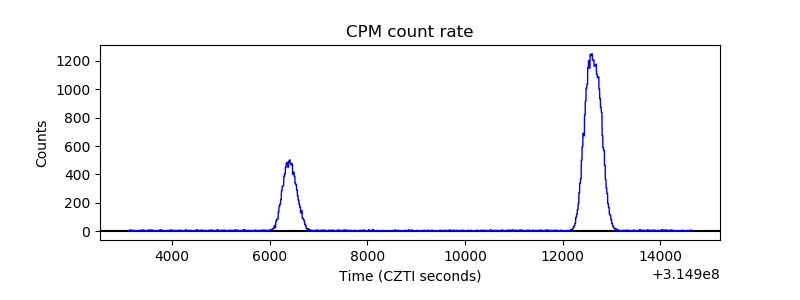 |
| CZT Counter | 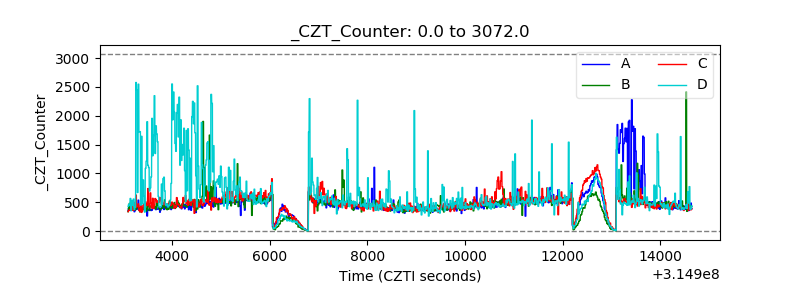 |
| +2.5 Volts monitor | 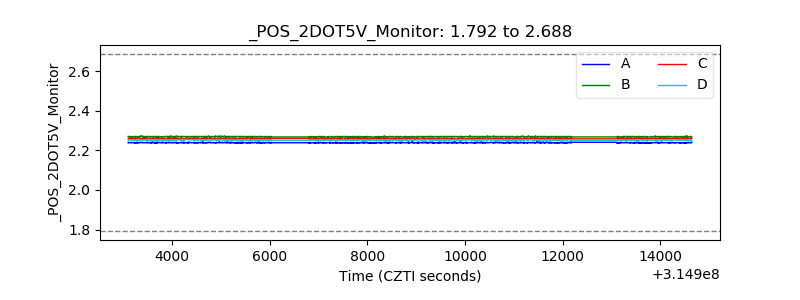 |
| +5 Volts monitor |  |
| _ROLL_ROT | 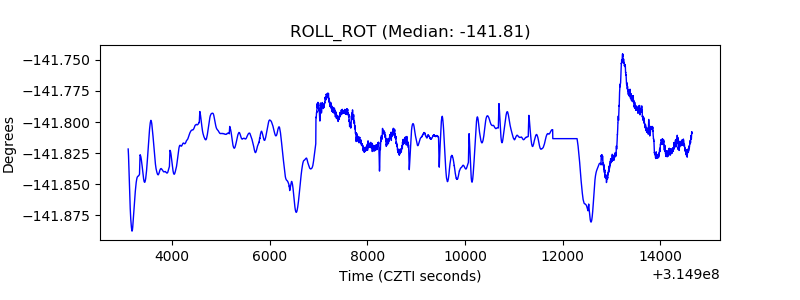 |
| _Roll_DEC | 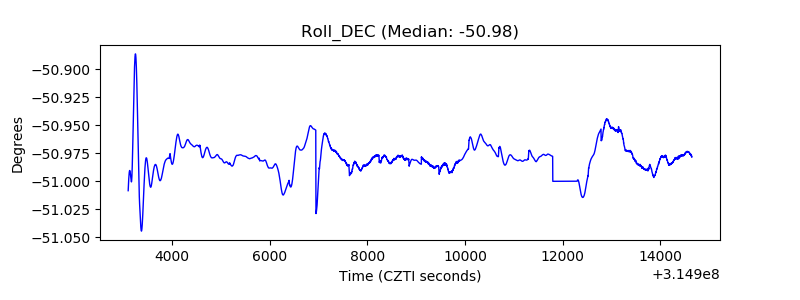 |
| _Roll_RA | 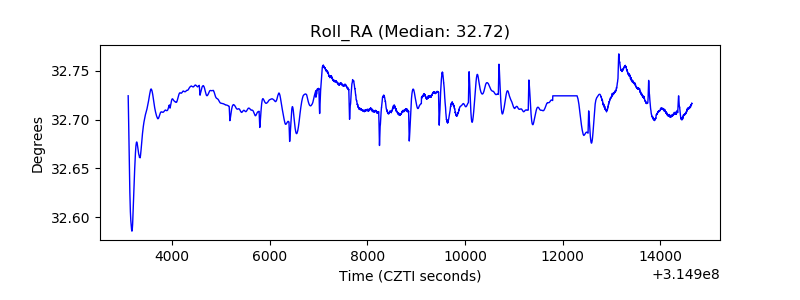 |
| Veto Counter | 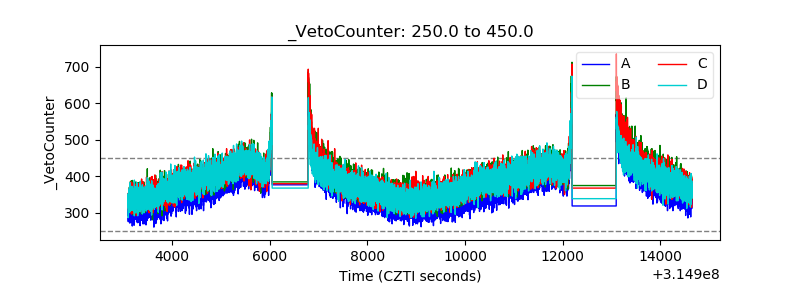 |