| Param | Original file | Final file |
|---|---|---|
| Filename | modeM0/AS1T03_170T01_9000003388_22923cztM0_level2.evt | modeM0/AS1T03_170T01_9000003388_22923cztM0_level2_quad_clean.evt |
| Size (bytes) | 497,442,240 | 93,942,720 |
| Size | 474.4 MB | 89.6 MB |
| Events in quadrant A | 3,601,934 | 608,725 |
| Events in quadrant B | 3,210,725 | 627,115 |
| Events in quadrant C | 3,230,633 | 594,600 |
| Events in quadrant D | 4,571,282 | 551,928 |
| Mode SS | |||
|---|---|---|---|
| Quadrant | BADHDUFLAG | Total packets | Discarded packets |
| A | 0 | 134 | 0 |
| B | 0 | 134 | 0 |
| C | 0 | 134 | 0 |
| D | 0 | 134 | 0 |
| Mode M9 | |||
|---|---|---|---|
| Quadrant | BADHDUFLAG | Total packets | Discarded packets |
| A | 0 | 10 | 0 |
| B | 0 | 11 | 0 |
| C | 0 | 11 | 0 |
| D | 0 | 11 | 0 |
| Mode M0 | |||
|---|---|---|---|
| Quadrant | BADHDUFLAG | Total packets | Discarded packets |
| A | 0 | 15158 | 2 |
| B | 0 | 13775 | 2 |
| C | 0 | 13666 | 2 |
| D | 0 | 18278 | 2 |
| Quadrant | Total seconds | Saturated seconds | Saturation percentage |
|---|---|---|---|
| A | 6634 | 122 | 1.839011% |
| B | 6634 | 32 | 0.482364% |
| C | 6634 | 41 | 0.618028% |
| D | 6634 | 504 | 7.597226% |
Noise dominated data is calculated using 1-second bins in cleaned event files. If a bin has >2000 counts, and if more than 50% of those come from <1% of pixels, then it is considered to be noise-dominated and hence unusable.
| Quadrant | # 1 sec bins | Bins with >0 counts | Bins with >2000 counts | High rate bins dominated by noise | Noise dominated (total time) | Noise dominated (detector-on time) | Marked lightcurve |
|---|---|---|---|---|---|---|---|
| A | 7684 | 6634 | 35 | 35 | 0.46% | 0.53% | 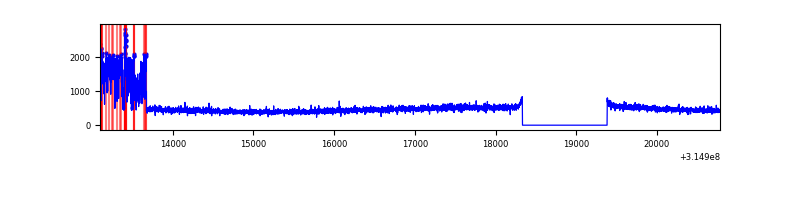 |
| B | 7684 | 6634 | 5 | 5 | 0.07% | 0.08% | 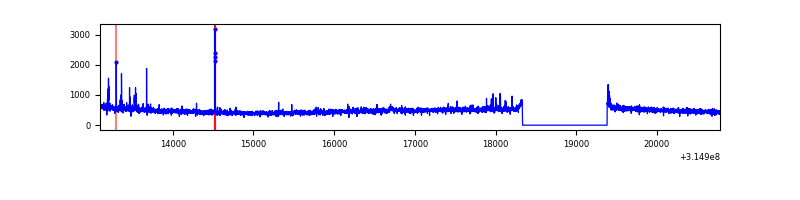 |
| C | 7684 | 6634 | 0 | 0 | 0.00% | 0.00% | 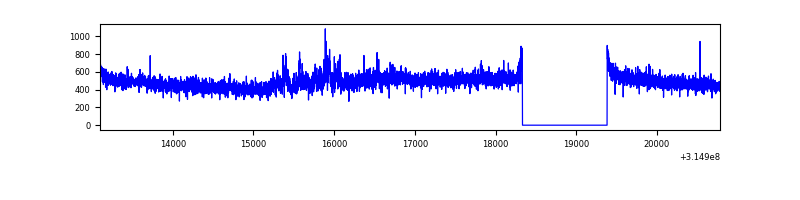 |
| D | 7684 | 6634 | 345 | 345 | 4.49% | 5.20% | 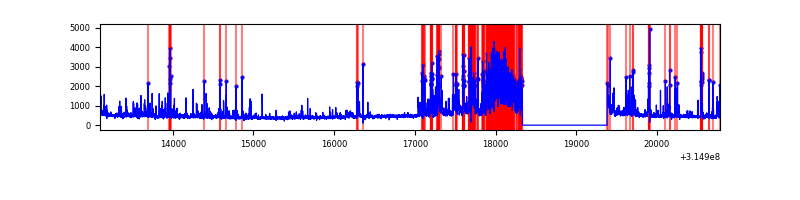 |
Top three noisy pixels from each quadrant. If the there are fewer than three noisy pixels in the level2.evt file, extra rows are filled as -1
| Pixel properties | Quadrant properties | ||||||
|---|---|---|---|---|---|---|---|
| Quadrant | DetID | PixID | Counts | Sigma | Mean | Median | Sigma |
| A | 0 | 23 | 527420 | 3288.14 | 789 | 772 | 160.2 |
| A | 0 | 226 | 38771 | 237.25 | 789 | 772 | 160.2 |
| A | 13 | 254 | 12087 | 70.65 | 789 | 772 | 160.2 |
| B | 0 | 190 | 33645 | 216.16 | 797 | 777 | 152.1 |
| B | 0 | 228 | 28530 | 182.52 | 797 | 777 | 152.1 |
| B | 12 | 111 | 18158 | 114.31 | 797 | 777 | 152.1 |
| C | 6 | 80 | 133828 | 754.17 | 759 | 765 | 176.4 |
| C | 14 | 238 | 119545 | 673.21 | 759 | 765 | 176.4 |
| C | 8 | 208 | 9014 | 46.75 | 759 | 765 | 176.4 |
| D | 1 | 52 | 802390 | 4495.52 | 737 | 716 | 178.3 |
| D | 12 | 233 | 695643 | 3896.92 | 737 | 716 | 178.3 |
| D | 13 | 153 | 186882 | 1043.96 | 737 | 716 | 178.3 |
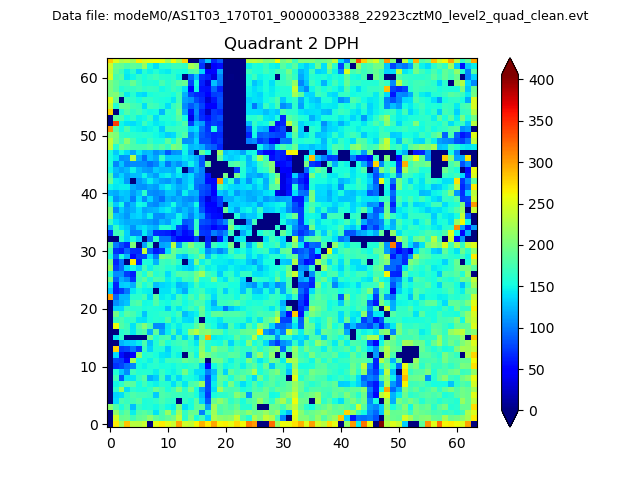
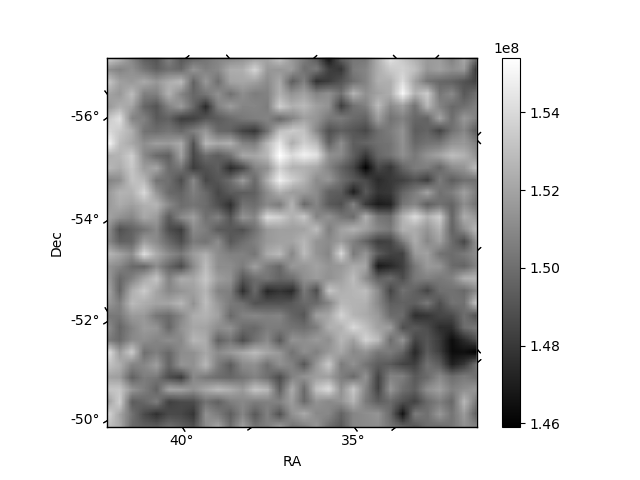
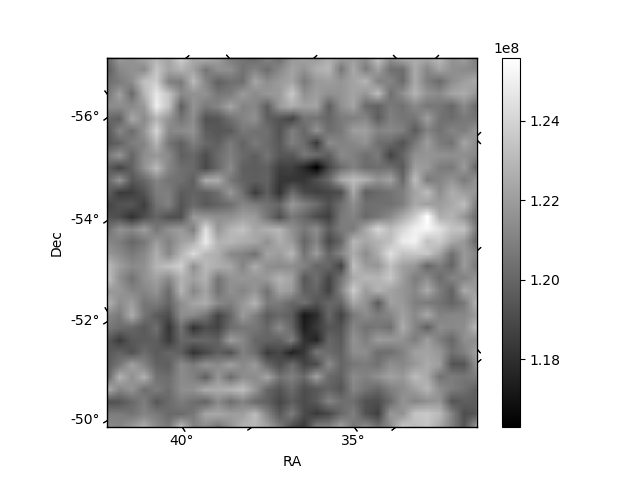
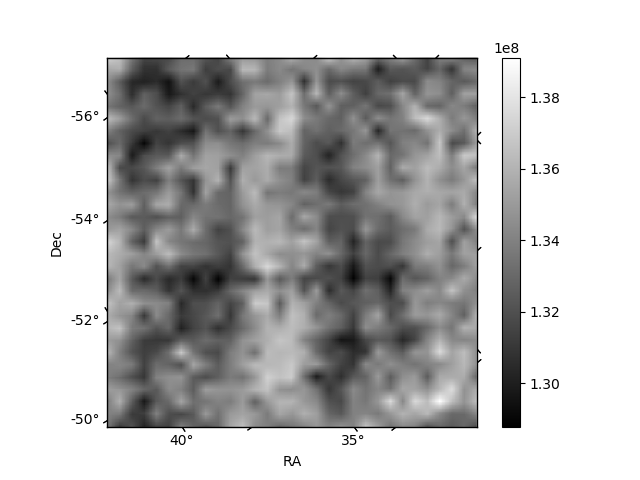
Histogram calculated using DETX and DETY for each event in the final _common_clean file
| Quadrant A | 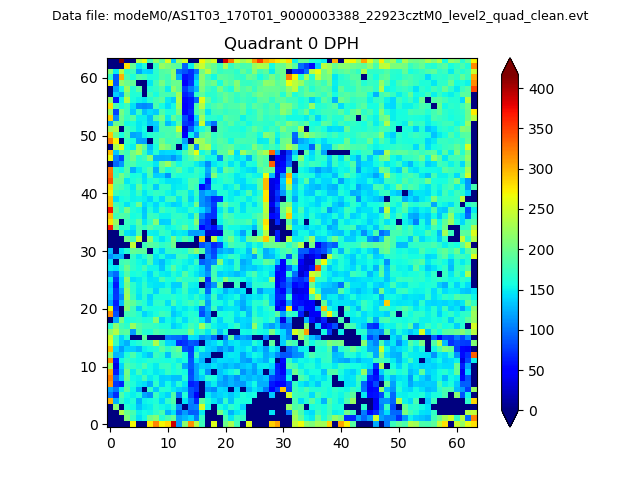 |
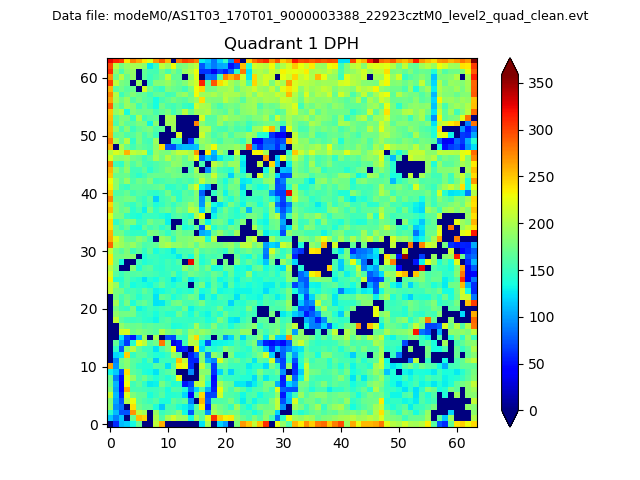 |
Quadrant B |
|---|---|---|---|
| Quadrant D | 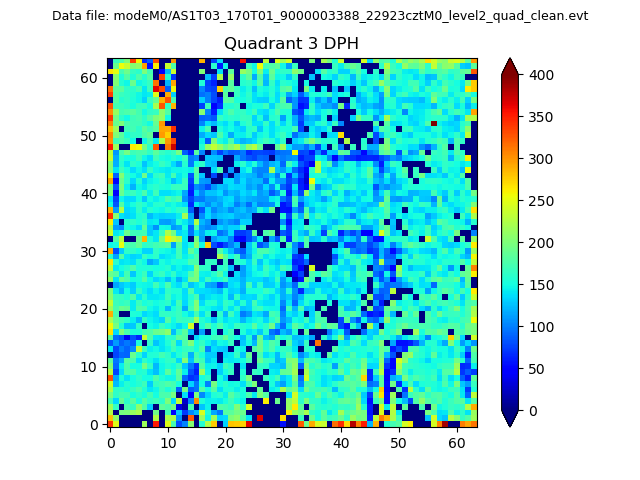 |
 |
Quadrant C |
| Plot type | Count rate plots | Images |
|---|---|---|
| Comparison with Poisson distribution Blue bars denote a histogram of data divided into 1 sec bins. Red curve is a Poisson curve with rate = median count rate of data. |
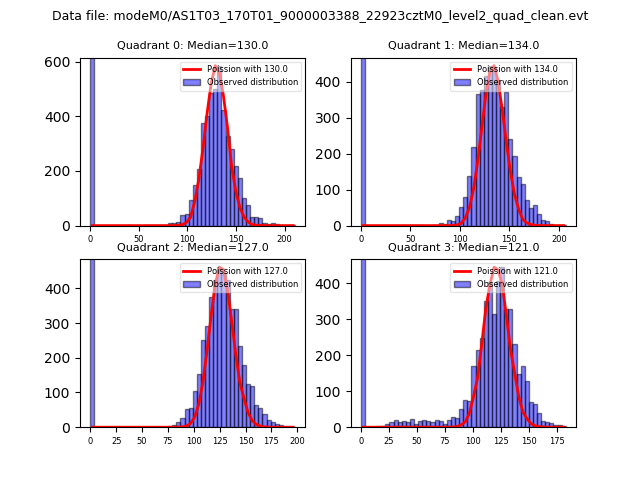 |
 |
| Quadrant-wise count rates Data is divided into 100 sec bins |
 |
|
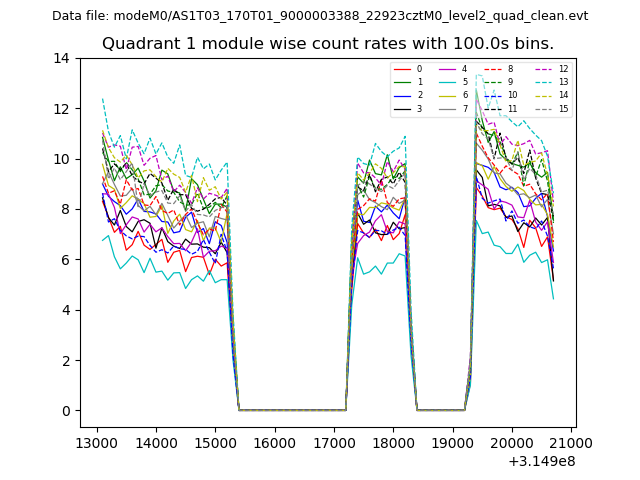
| Module-wise count rates for Quadrant A Data is divided into 100 sec bins |
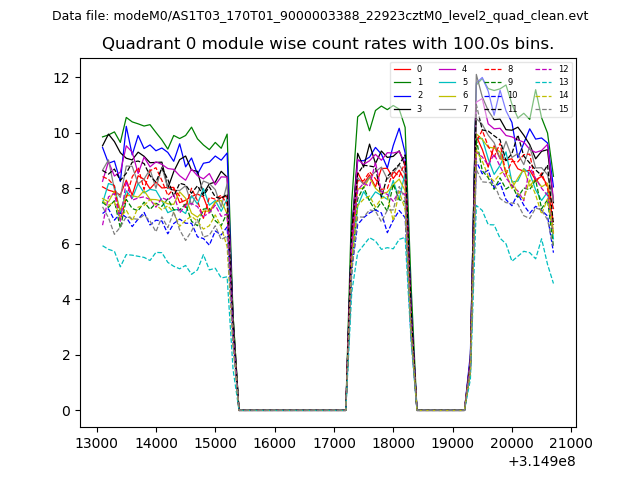 |
 |
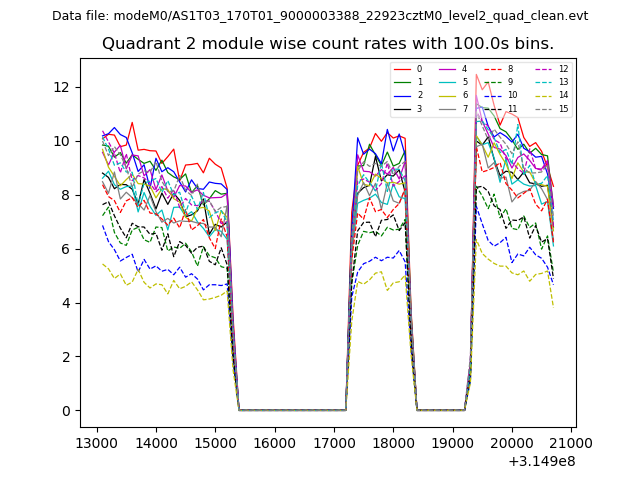
| Module-wise count rates for Quadrant B Data is divided into 100 sec bins |
 |
 |
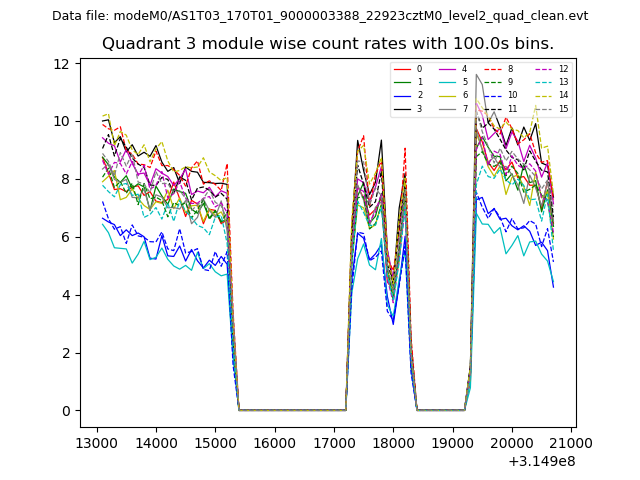
| Module-wise count rates for Quadrant C Data is divided into 100 sec bins |
 |
 |
| Module-wise count rates for Quadrant D Data is divided into 100 sec bins |
 |
 |
| Parameter | Plot |
|---|---|
| CZT HV Monitor | 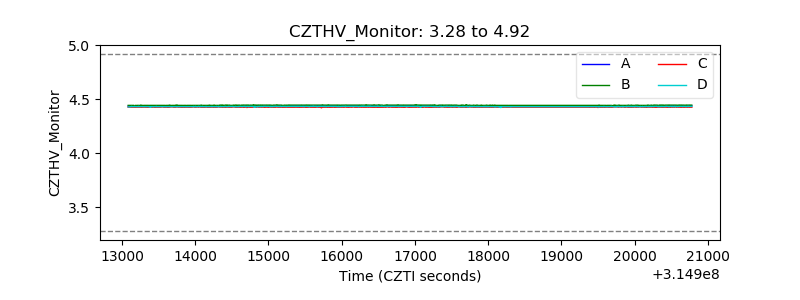 |
| D_VDD | 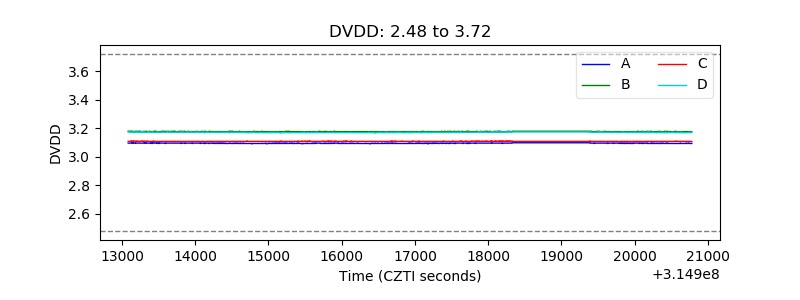 |
| Temperature 1 | 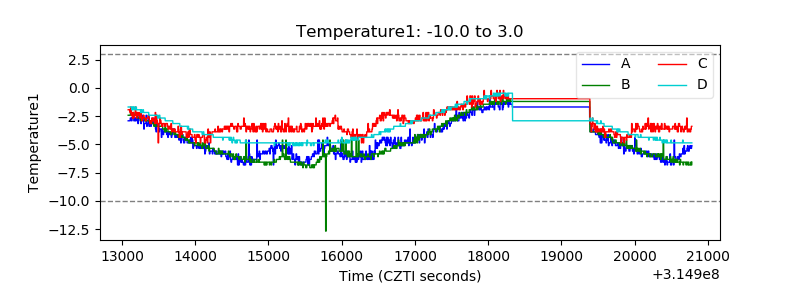 |
| Veto HV Monitor | 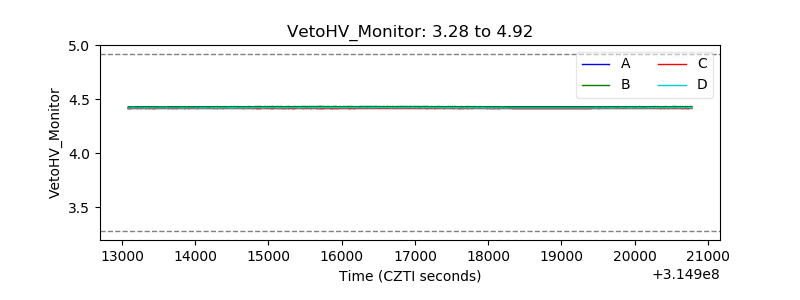 |
| Veto LLD | 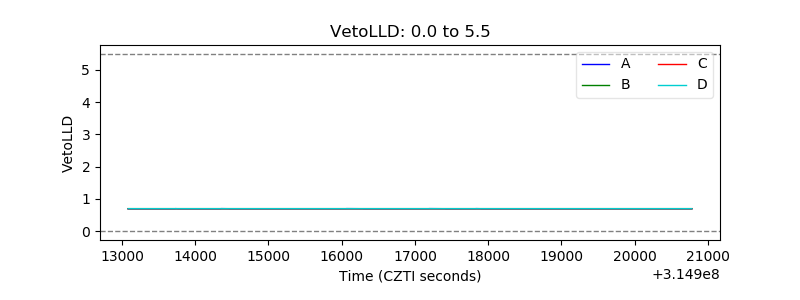 |
| Alpha Counter |  |
| _CPM_Rate |  |
| CZT Counter | 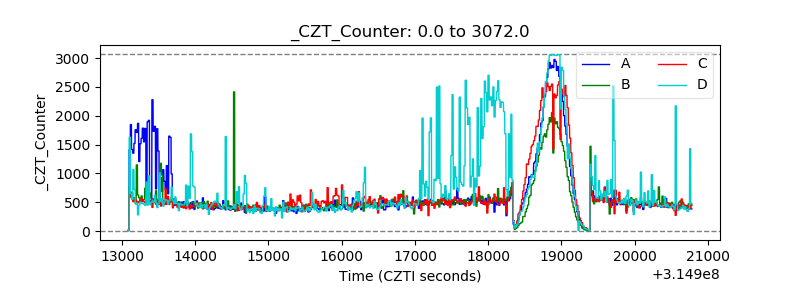 |
| +2.5 Volts monitor |  |
| +5 Volts monitor |  |
| _ROLL_ROT | 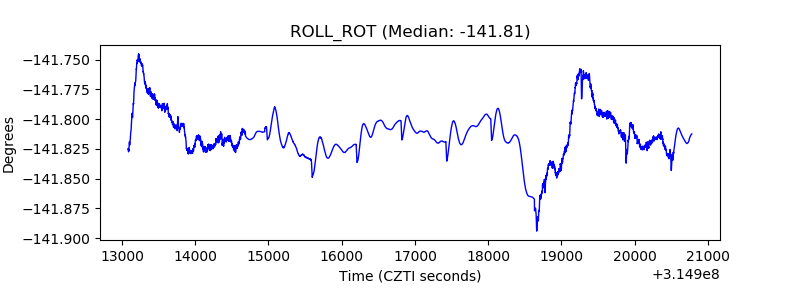 |
| _Roll_DEC | 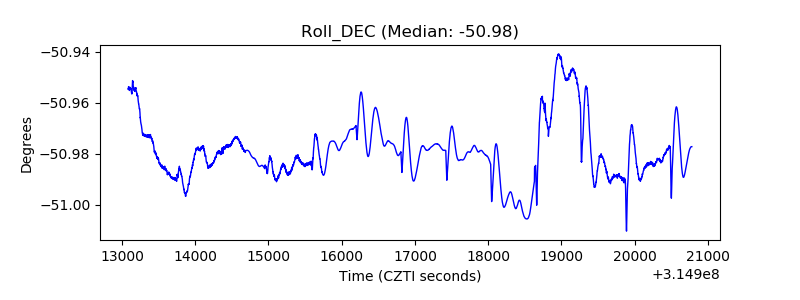 |
| _Roll_RA | 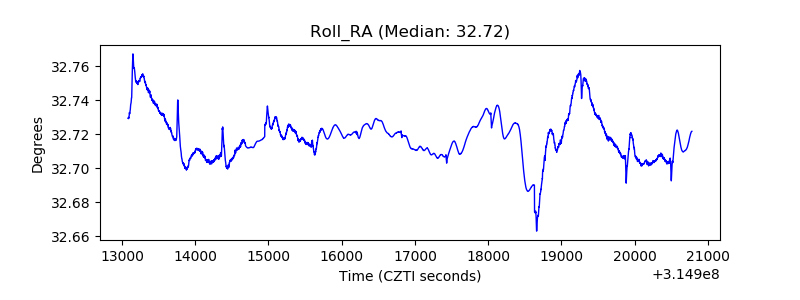 |
| Veto Counter | 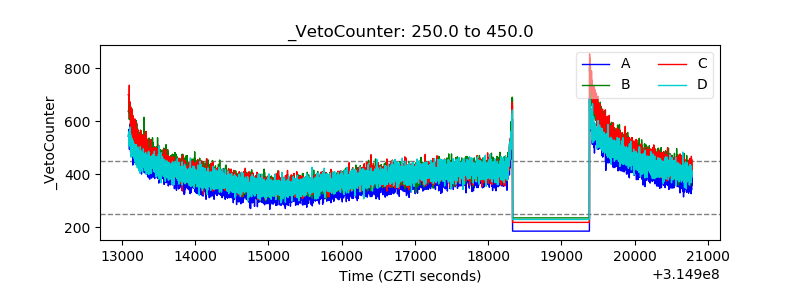 |