| Param | Original file | Final file |
|---|---|---|
| Filename | modeM0/AS1T03_170T01_9000003388_22925cztM0_level2.evt | modeM0/AS1T03_170T01_9000003388_22925cztM0_level2_quad_clean.evt |
| Size (bytes) | 475,404,480 | 98,375,040 |
| Size | 453.4 MB | 93.8 MB |
| Events in quadrant A | 3,119,864 | 640,713 |
| Events in quadrant B | 3,269,671 | 659,363 |
| Events in quadrant C | 3,285,195 | 626,146 |
| Events in quadrant D | 4,276,574 | 594,513 |
| Mode SS | |||
|---|---|---|---|
| Quadrant | BADHDUFLAG | Total packets | Discarded packets |
| A | 0 | 136 | 0 |
| B | 0 | 136 | 0 |
| C | 0 | 136 | 0 |
| D | 0 | 136 | 0 |
| Mode M9 | |||
|---|---|---|---|
| Quadrant | BADHDUFLAG | Total packets | Discarded packets |
| A | 0 | 14 | 0 |
| B | 0 | 15 | 0 |
| C | 0 | 15 | 0 |
| D | 0 | 15 | 0 |
| Mode M0 | |||
|---|---|---|---|
| Quadrant | BADHDUFLAG | Total packets | Discarded packets |
| A | 0 | 13451 | 2 |
| B | 0 | 13806 | 2 |
| C | 0 | 13755 | 4 |
| D | 0 | 17130 | 2 |
| Quadrant | Total seconds | Saturated seconds | Saturation percentage |
|---|---|---|---|
| A | 6565 | 14 | 0.213252% |
| B | 6565 | 24 | 0.365575% |
| C | 6564 | 53 | 0.807434% |
| D | 6564 | 194 | 2.955515% |
Noise dominated data is calculated using 1-second bins in cleaned event files. If a bin has >2000 counts, and if more than 50% of those come from <1% of pixels, then it is considered to be noise-dominated and hence unusable.
| Quadrant | # 1 sec bins | Bins with >0 counts | Bins with >2000 counts | High rate bins dominated by noise | Noise dominated (total time) | Noise dominated (detector-on time) | Marked lightcurve |
|---|---|---|---|---|---|---|---|
| A | 7729 | 6565 | 0 | 0 | 0.00% | 0.00% | 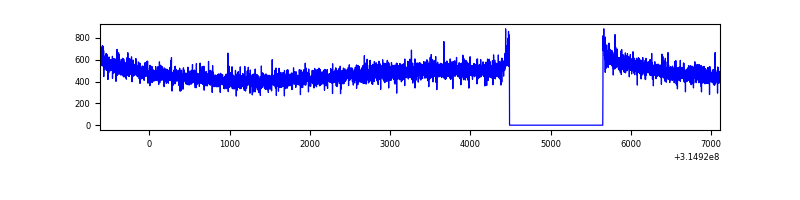 |
| B | 7729 | 6565 | 1 | 1 | 0.01% | 0.02% | 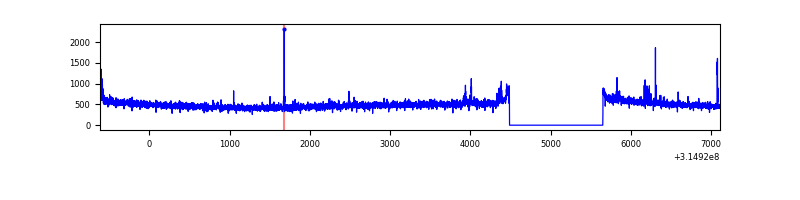 |
| C | 7728 | 6564 | 1 | 1 | 0.01% | 0.02% | 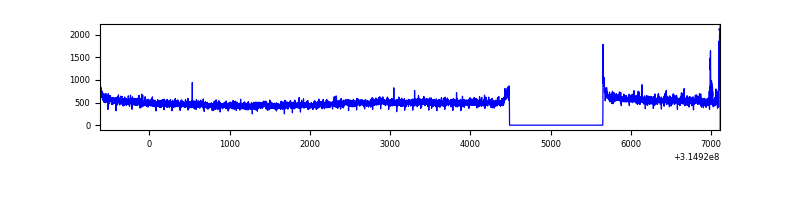 |
| D | 7728 | 6564 | 138 | 138 | 1.79% | 2.10% | 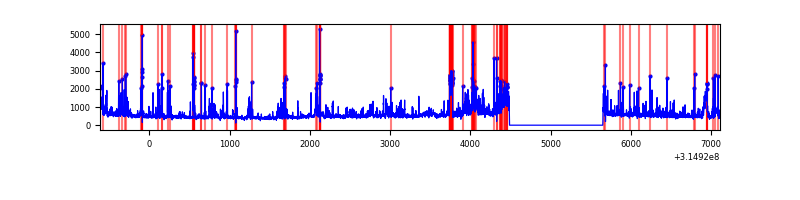 |
Top three noisy pixels from each quadrant. If the there are fewer than three noisy pixels in the level2.evt file, extra rows are filled as -1
| Pixel properties | Quadrant properties | ||||||
|---|---|---|---|---|---|---|---|
| Quadrant | DetID | PixID | Counts | Sigma | Mean | Median | Sigma |
| A | 13 | 254 | 11823 | 67.93 | 809 | 793 | 162.4 |
| A | 0 | 226 | 6963 | 38.0 | 809 | 793 | 162.4 |
| A | 3 | 137 | 6852 | 37.31 | 809 | 793 | 162.4 |
| B | 0 | 190 | 29717 | 187.93 | 816 | 795 | 153.9 |
| B | 12 | 111 | 18255 | 113.45 | 816 | 795 | 153.9 |
| B | 3 | 64 | 17719 | 109.97 | 816 | 795 | 153.9 |
| C | 14 | 238 | 125849 | 684.75 | 786 | 792 | 182.6 |
| C | 6 | 80 | 66802 | 361.44 | 786 | 792 | 182.6 |
| C | 8 | 208 | 11239 | 57.2 | 786 | 792 | 182.6 |
| D | 1 | 52 | 919177 | 4871.21 | 777 | 754 | 188.5 |
| D | 13 | 153 | 190900 | 1008.51 | 777 | 754 | 188.5 |
| D | 12 | 233 | 137016 | 722.72 | 777 | 754 | 188.5 |
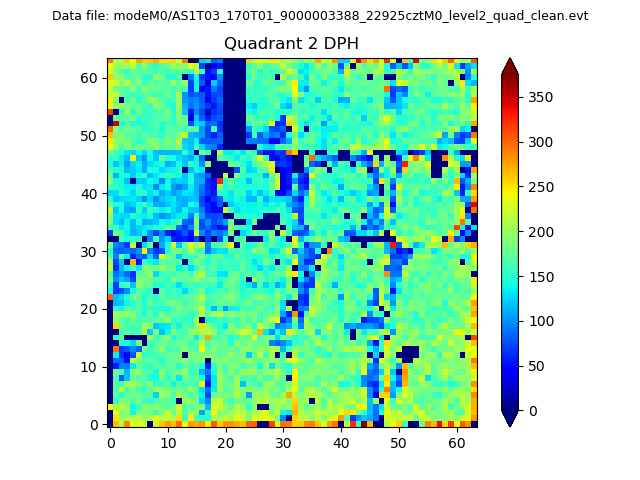
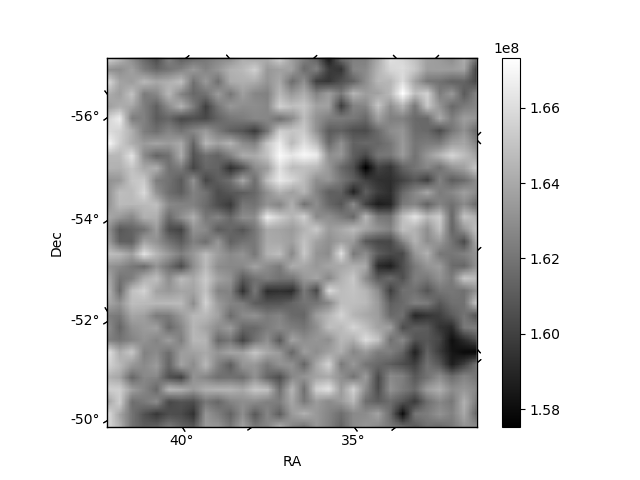
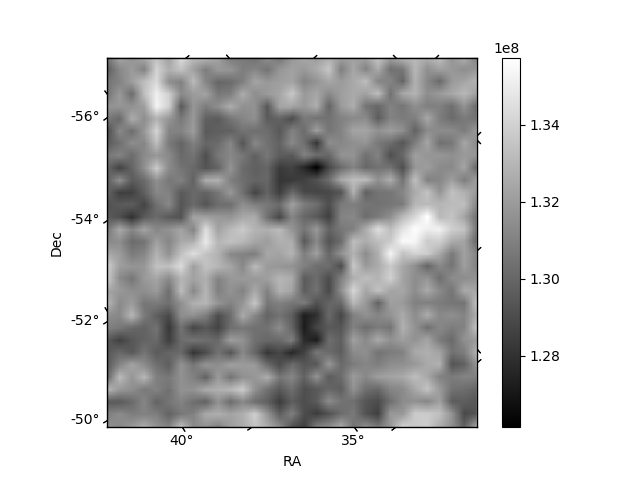
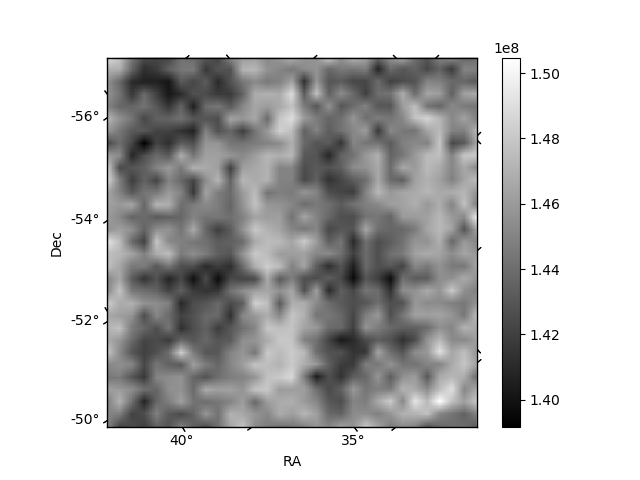
Histogram calculated using DETX and DETY for each event in the final _common_clean file
| Quadrant A | 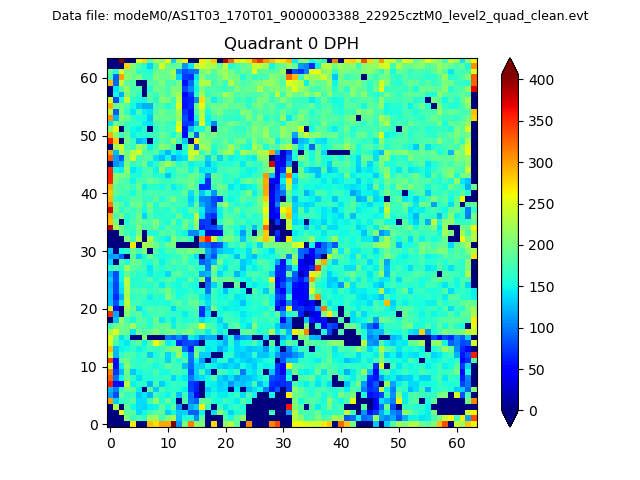 |
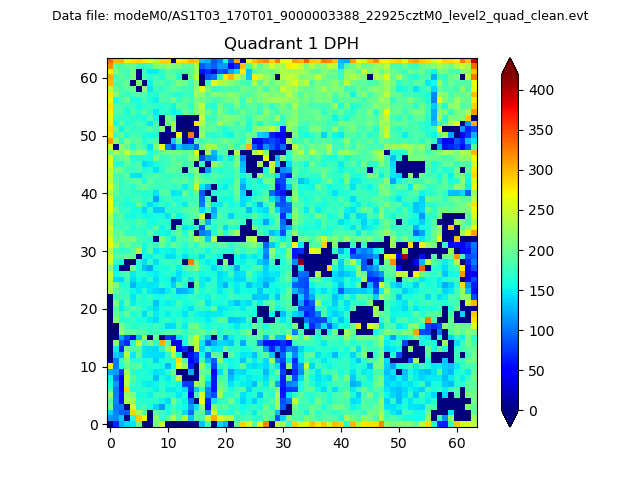 |
Quadrant B |
|---|---|---|---|
| Quadrant D | 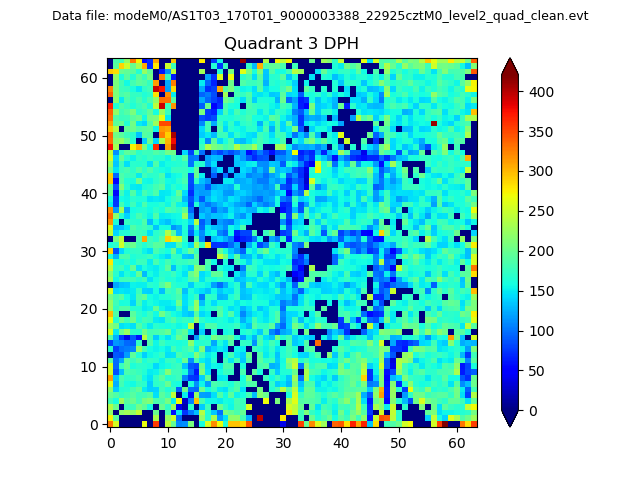 |
 |
Quadrant C |
| Plot type | Count rate plots | Images |
|---|---|---|
| Comparison with Poisson distribution Blue bars denote a histogram of data divided into 1 sec bins. Red curve is a Poisson curve with rate = median count rate of data. |
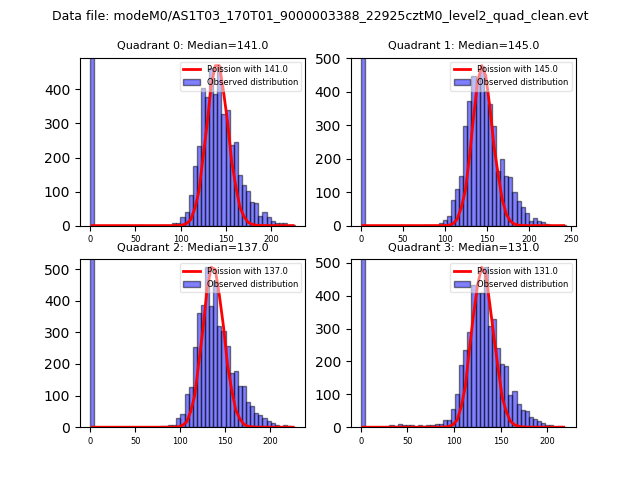 |
 |
| Quadrant-wise count rates Data is divided into 100 sec bins |
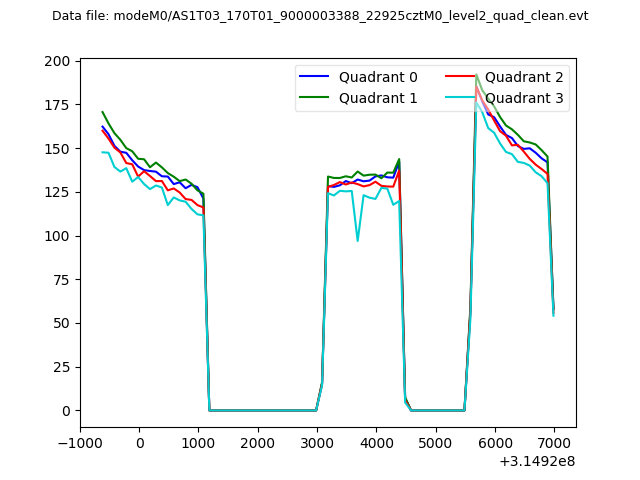 |
|
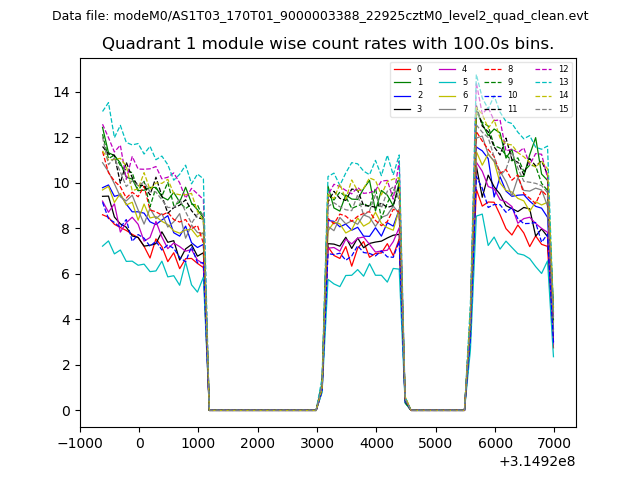
| Module-wise count rates for Quadrant A Data is divided into 100 sec bins |
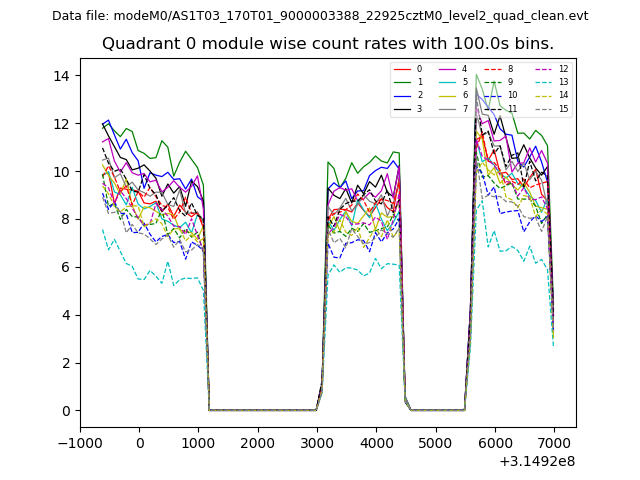 |
 |
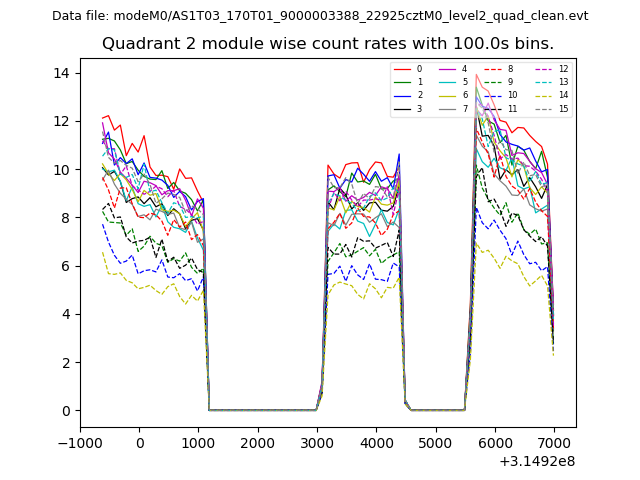
| Module-wise count rates for Quadrant B Data is divided into 100 sec bins |
 |
 |
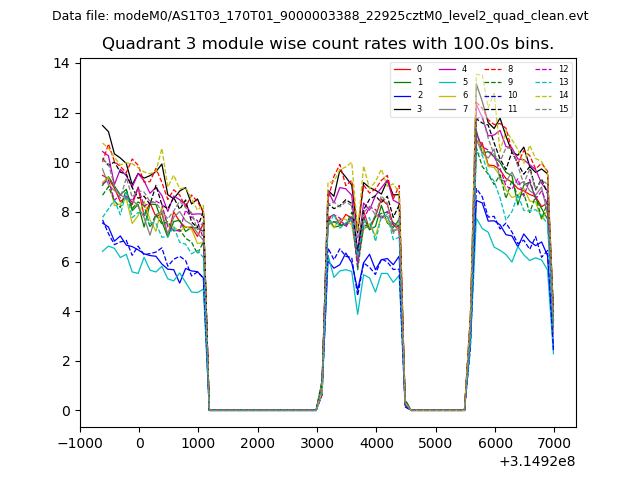
| Module-wise count rates for Quadrant C Data is divided into 100 sec bins |
 |
 |
| Module-wise count rates for Quadrant D Data is divided into 100 sec bins |
 |
 |
| Parameter | Plot |
|---|---|
| CZT HV Monitor | 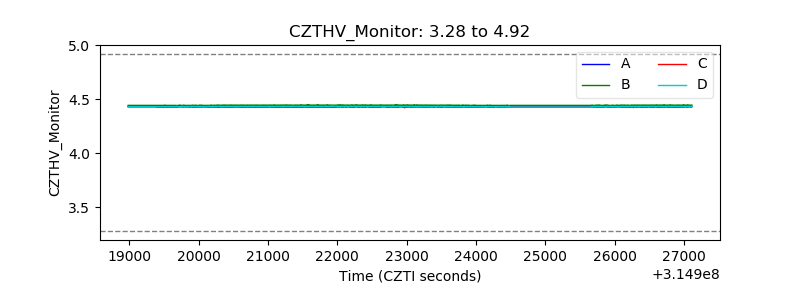 |
| D_VDD | 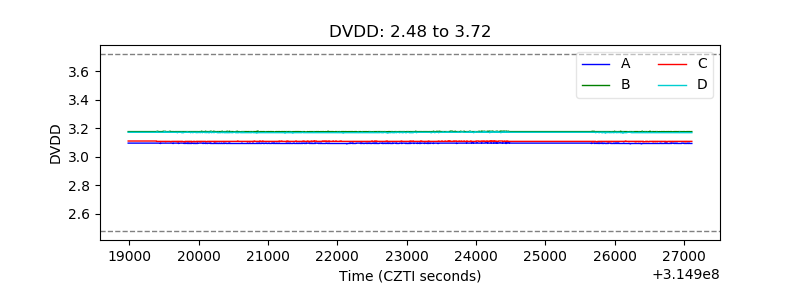 |
| Temperature 1 | 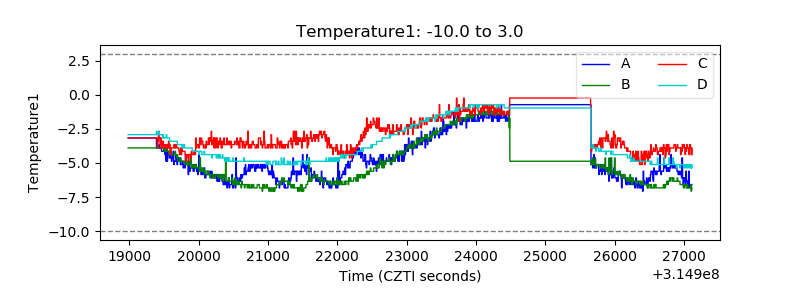 |
| Veto HV Monitor | 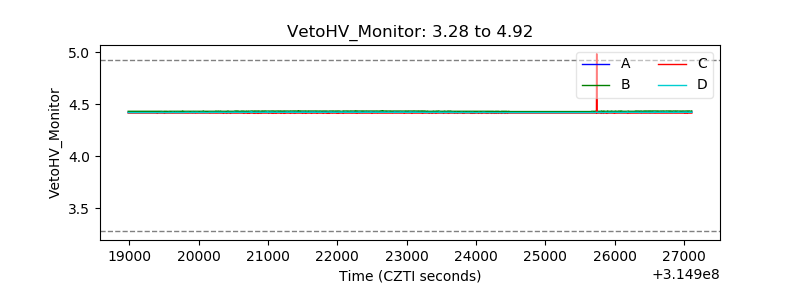 |
| Veto LLD | 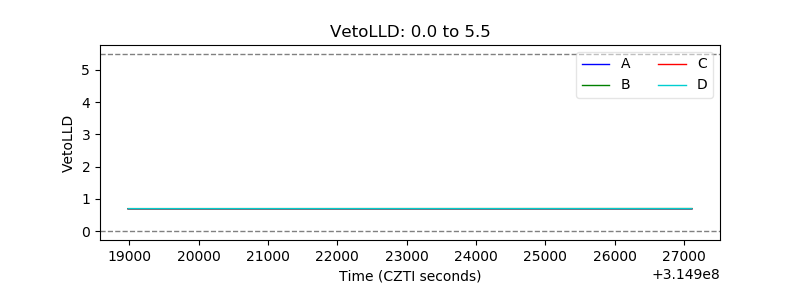 |
| Alpha Counter | 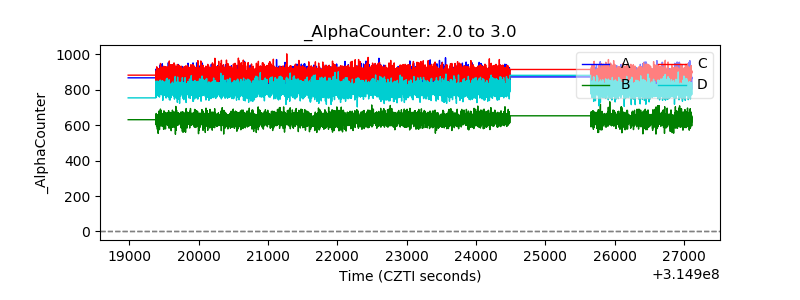 |
| _CPM_Rate | 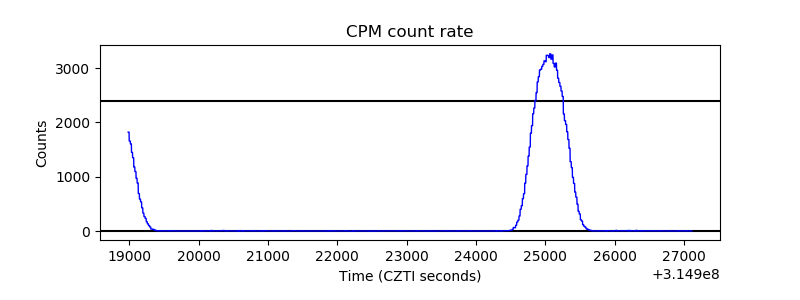 |
| CZT Counter |  |
| +2.5 Volts monitor |  |
| +5 Volts monitor |  |
| _ROLL_ROT | 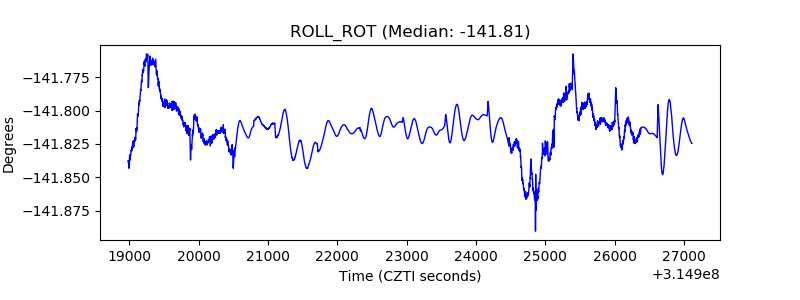 |
| _Roll_DEC | 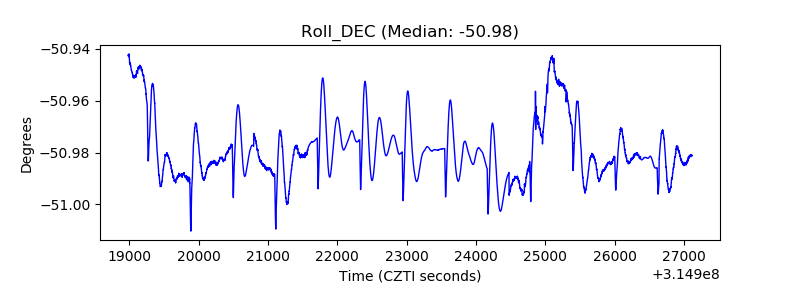 |
| _Roll_RA | 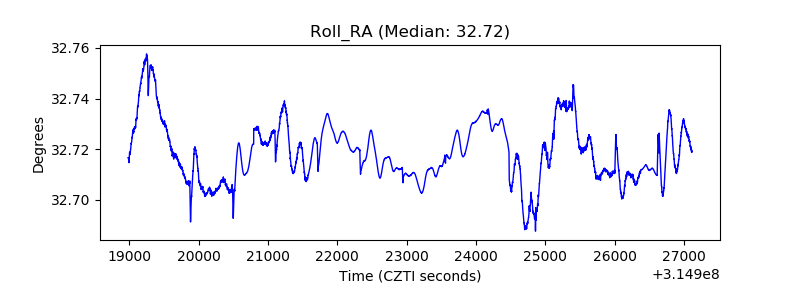 |
| Veto Counter | 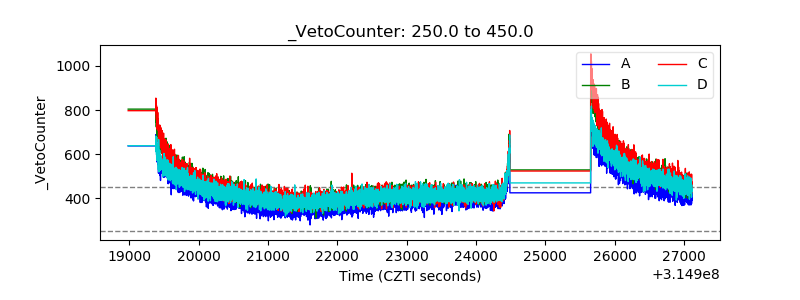 |