| Param | Original file | Final file |
|---|---|---|
| Filename | modeM0/AS1T03_170T01_9000003388_22926cztM0_level2.evt | modeM0/AS1T03_170T01_9000003388_22926cztM0_level2_quad_clean.evt |
| Size (bytes) | 527,060,160 | 93,660,480 |
| Size | 502.6 MB | 89.3 MB |
| Events in quadrant A | 3,198,473 | 610,018 |
| Events in quadrant B | 3,394,392 | 630,323 |
| Events in quadrant C | 4,006,723 | 602,660 |
| Events in quadrant D | 4,926,077 | 544,317 |
| Mode SS | |||
|---|---|---|---|
| Quadrant | BADHDUFLAG | Total packets | Discarded packets |
| A | 0 | 130 | 0 |
| B | 0 | 130 | 0 |
| C | 0 | 130 | 0 |
| D | 0 | 130 | 0 |
| Mode M9 | |||
|---|---|---|---|
| Quadrant | BADHDUFLAG | Total packets | Discarded packets |
| A | 0 | 20 | 0 |
| B | 0 | 21 | 0 |
| C | 0 | 21 | 0 |
| D | 0 | 21 | 0 |
| Mode M0 | |||
|---|---|---|---|
| Quadrant | BADHDUFLAG | Total packets | Discarded packets |
| A | 0 | 13411 | 2 |
| B | 0 | 13982 | 2 |
| C | 0 | 15973 | 2 |
| D | 0 | 18848 | 2 |
| Quadrant | Total seconds | Saturated seconds | Saturation percentage |
|---|---|---|---|
| A | 6439 | 17 | 0.264016% |
| B | 6438 | 25 | 0.388319% |
| C | 6438 | 68 | 1.056229% |
| D | 6438 | 449 | 6.974216% |
Noise dominated data is calculated using 1-second bins in cleaned event files. If a bin has >2000 counts, and if more than 50% of those come from <1% of pixels, then it is considered to be noise-dominated and hence unusable.
| Quadrant | # 1 sec bins | Bins with >0 counts | Bins with >2000 counts | High rate bins dominated by noise | Noise dominated (total time) | Noise dominated (detector-on time) | Marked lightcurve |
|---|---|---|---|---|---|---|---|
| A | 7705 | 6440 | 0 | 0 | 0.00% | 0.00% | 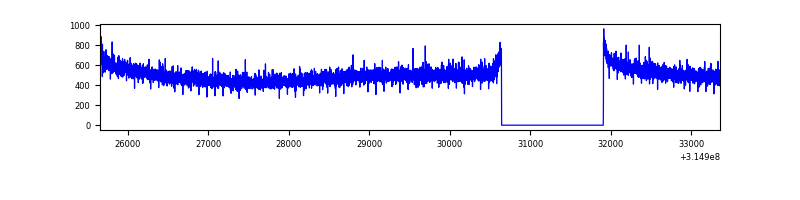 |
| B | 7704 | 6439 | 0 | 0 | 0.00% | 0.00% | 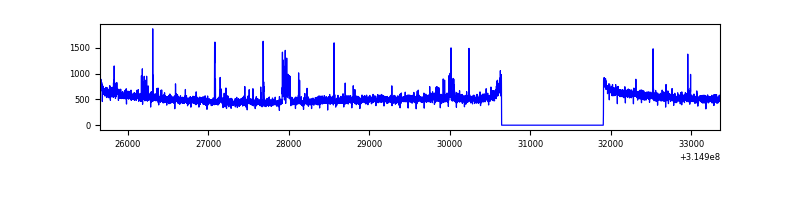 |
| C | 7704 | 6439 | 1 | 1 | 0.01% | 0.02% | 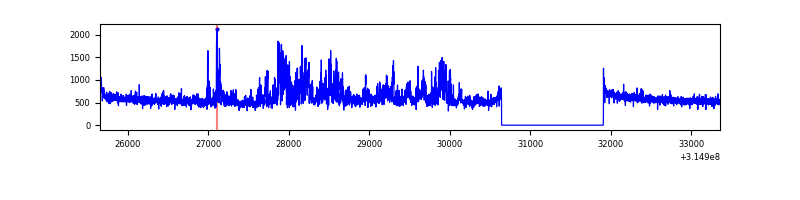 |
| D | 7704 | 6439 | 330 | 330 | 4.28% | 5.13% | 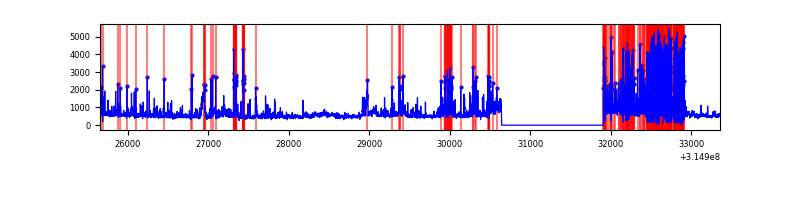 |
Top three noisy pixels from each quadrant. If the there are fewer than three noisy pixels in the level2.evt file, extra rows are filled as -1
| Pixel properties | Quadrant properties | ||||||
|---|---|---|---|---|---|---|---|
| Quadrant | DetID | PixID | Counts | Sigma | Mean | Median | Sigma |
| A | 13 | 254 | 10925 | 61.33 | 830 | 817 | 164.8 |
| A | 0 | 226 | 7052 | 37.83 | 830 | 817 | 164.8 |
| A | 3 | 137 | 6677 | 35.56 | 830 | 817 | 164.8 |
| B | 4 | 173 | 34471 | 217.39 | 838 | 819 | 154.8 |
| B | 3 | 64 | 19665 | 121.74 | 838 | 819 | 154.8 |
| B | 0 | 189 | 19529 | 120.86 | 838 | 819 | 154.8 |
| C | 6 | 80 | 665216 | 3568.86 | 815 | 823 | 186.2 |
| C | 14 | 238 | 130371 | 695.88 | 815 | 823 | 186.2 |
| C | 7 | 247 | 16446 | 83.92 | 815 | 823 | 186.2 |
| D | 1 | 52 | 1635082 | 8642.77 | 783 | 762 | 189.1 |
| D | 13 | 153 | 197860 | 1042.31 | 783 | 762 | 189.1 |
| D | 12 | 233 | 81485 | 426.89 | 783 | 762 | 189.1 |
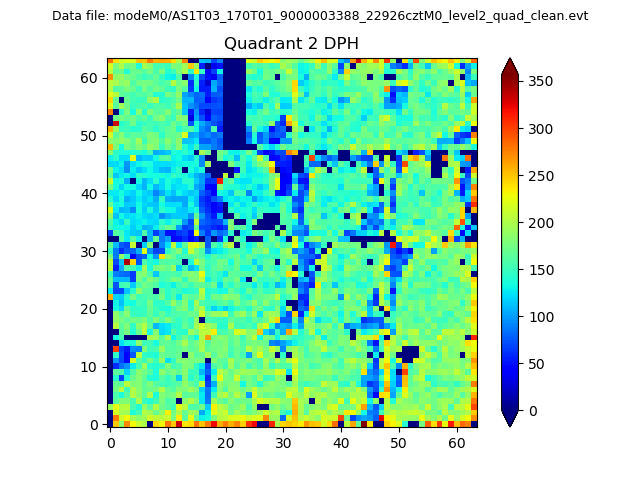
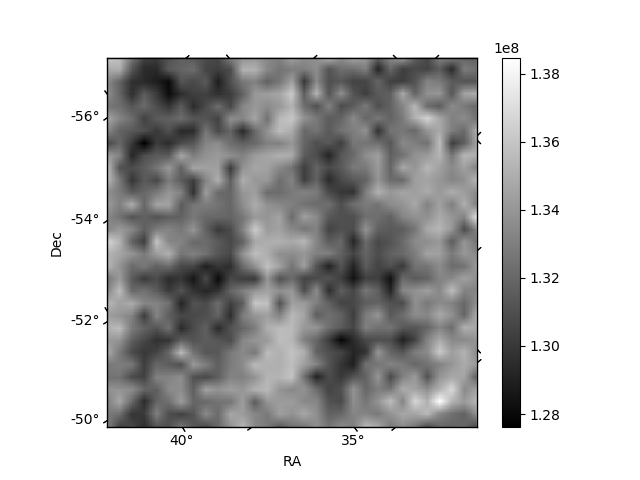
Histogram calculated using DETX and DETY for each event in the final _common_clean file
| Quadrant A | 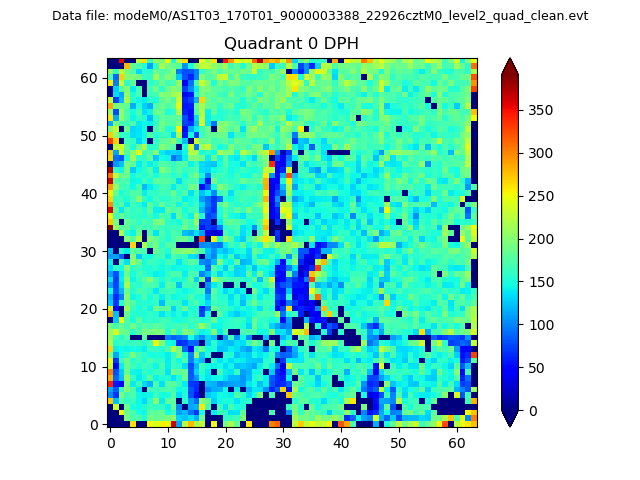 |
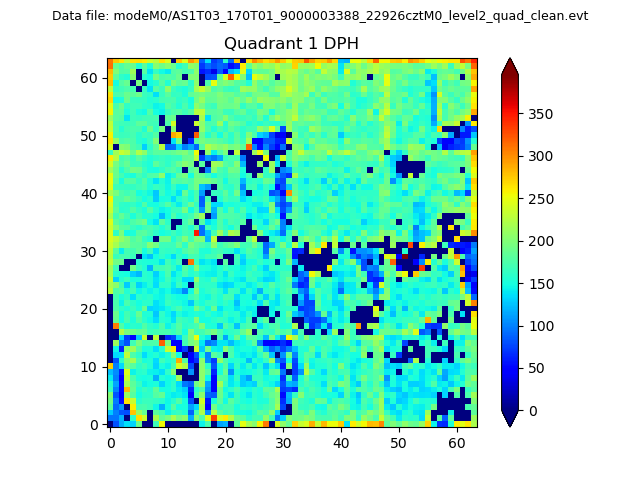 |
Quadrant B |
|---|---|---|---|
| Quadrant D | 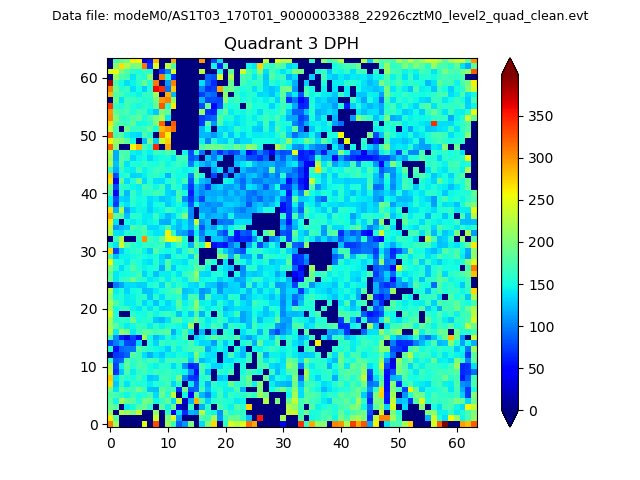 |
 |
Quadrant C |
| Plot type | Count rate plots | Images |
|---|---|---|
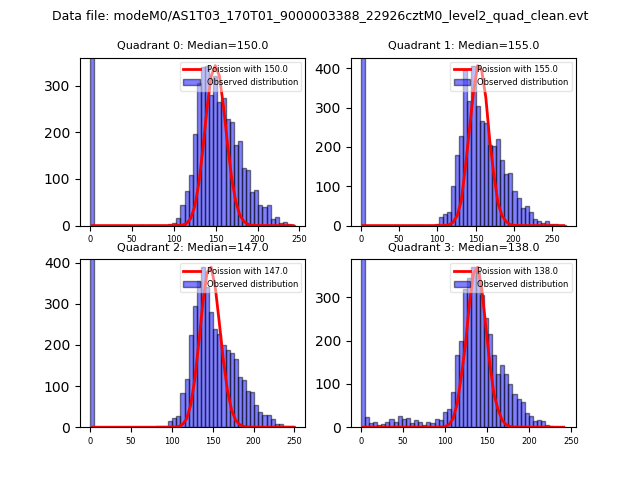
| Comparison with Poisson distribution Blue bars denote a histogram of data divided into 1 sec bins. Red curve is a Poisson curve with rate = median count rate of data. |
 |
 |
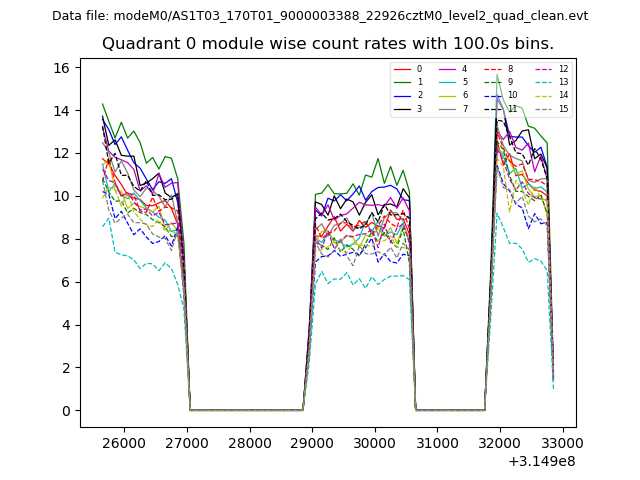
| Quadrant-wise count rates Data is divided into 100 sec bins |
 |
|
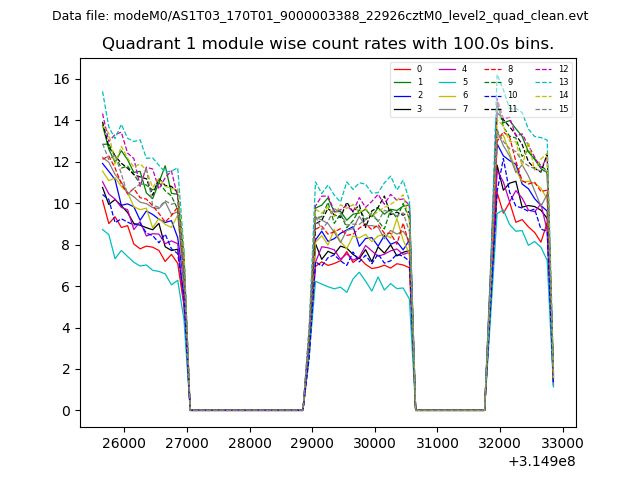
| Module-wise count rates for Quadrant A Data is divided into 100 sec bins |
 |
 |
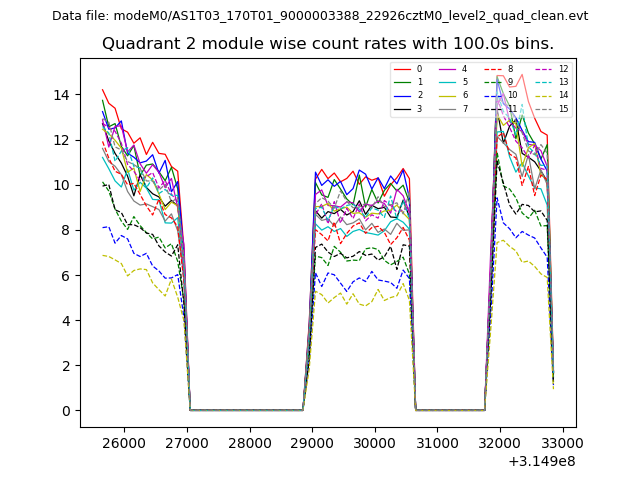
| Module-wise count rates for Quadrant B Data is divided into 100 sec bins |
 |
 |
| Module-wise count rates for Quadrant C Data is divided into 100 sec bins |
 |
 |
| Module-wise count rates for Quadrant D Data is divided into 100 sec bins |
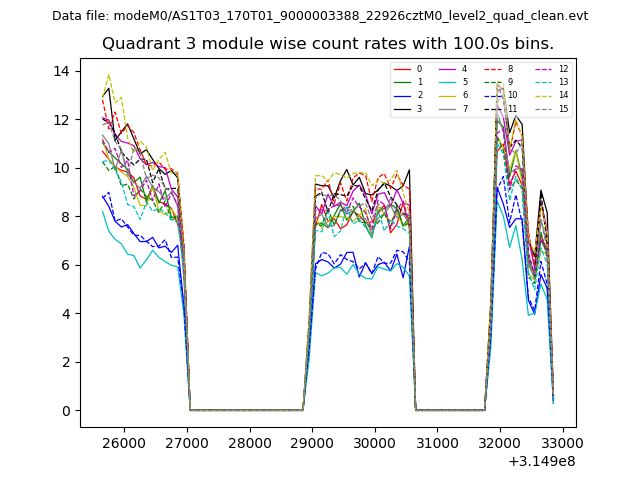 |
 |
| Parameter | Plot |
|---|---|
| CZT HV Monitor | 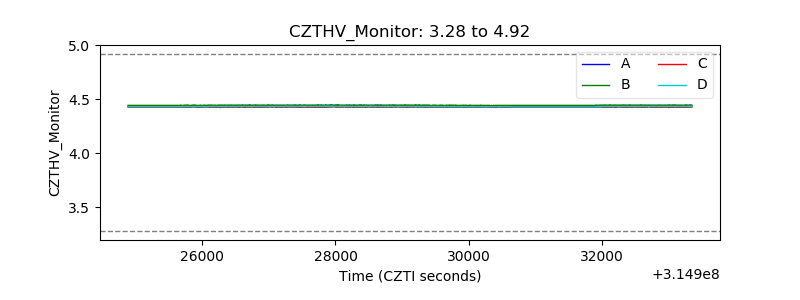 |
| D_VDD |  |
| Temperature 1 | 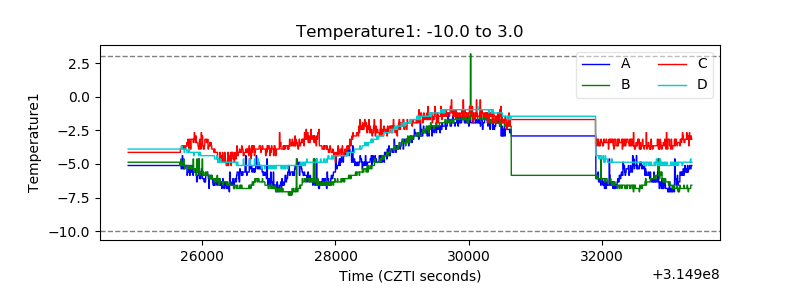 |
| Veto HV Monitor |  |
| Veto LLD | 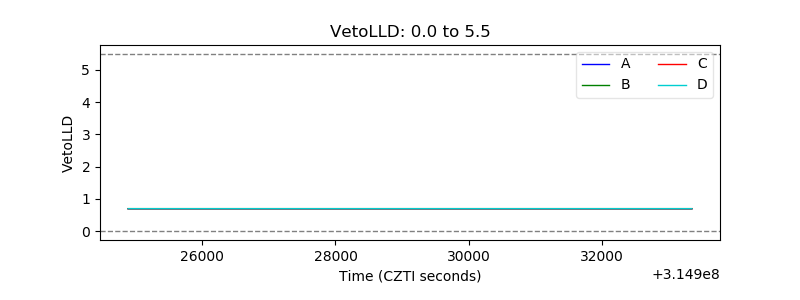 |
| Alpha Counter | 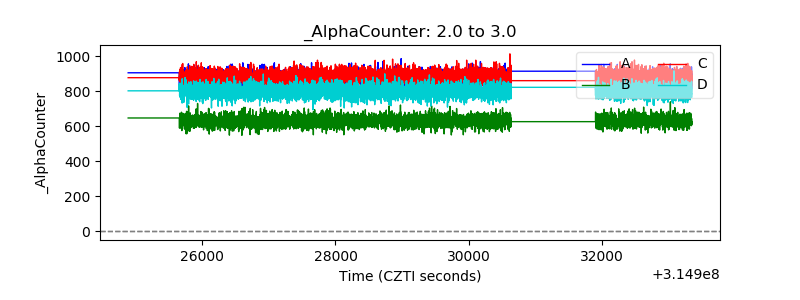 |
| _CPM_Rate |  |
| CZT Counter | 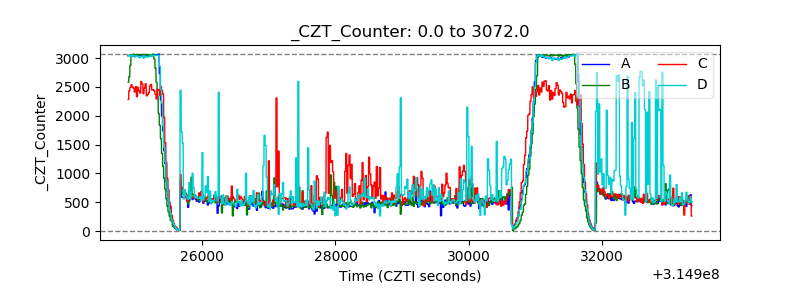 |
| +2.5 Volts monitor |  |
| +5 Volts monitor |  |
| _ROLL_ROT | 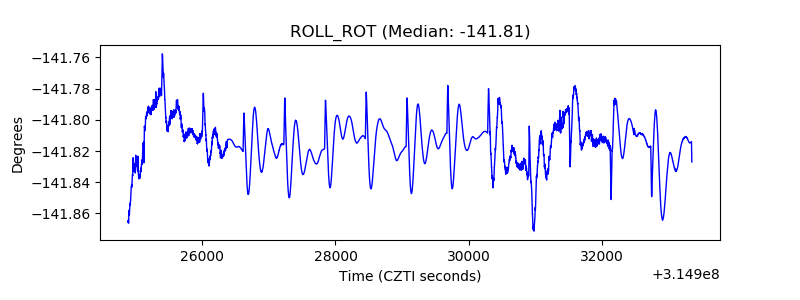 |
| _Roll_DEC | 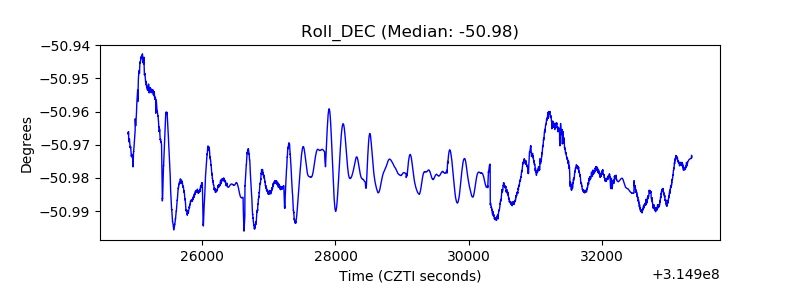 |
| _Roll_RA | 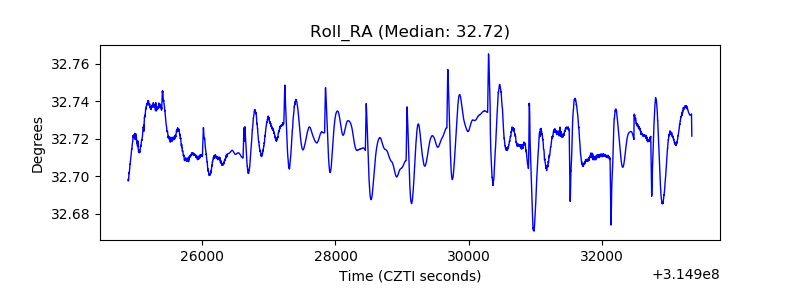 |
| Veto Counter | 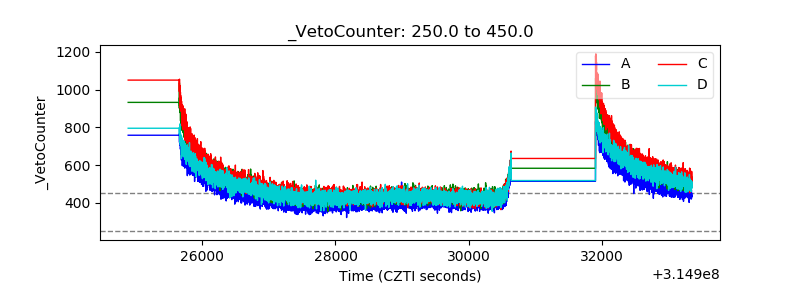 |