| Param | Original file | Final file |
|---|---|---|
| Filename | modeM0/AS1T03_170T01_9000003388_22928cztM0_level2.evt | modeM0/AS1T03_170T01_9000003388_22928cztM0_level2_quad_clean.evt |
| Size (bytes) | 525,625,920 | 78,431,040 |
| Size | 501.3 MB | 74.8 MB |
| Events in quadrant A | 3,362,910 | 487,183 |
| Events in quadrant B | 3,469,547 | 501,213 |
| Events in quadrant C | 3,493,403 | 483,061 |
| Events in quadrant D | 5,160,604 | 458,449 |
| Mode SS | |||
|---|---|---|---|
| Quadrant | BADHDUFLAG | Total packets | Discarded packets |
| A | 0 | 130 | 0 |
| B | 0 | 130 | 0 |
| C | 0 | 130 | 0 |
| D | 0 | 130 | 0 |
| Mode M9 | |||
|---|---|---|---|
| Quadrant | BADHDUFLAG | Total packets | Discarded packets |
| A | 0 | 20 | 0 |
| B | 0 | 21 | 0 |
| C | 0 | 21 | 0 |
| D | 0 | 21 | 0 |
| Mode M0 | |||
|---|---|---|---|
| Quadrant | BADHDUFLAG | Total packets | Discarded packets |
| A | 0 | 13601 | 2 |
| B | 0 | 13992 | 2 |
| C | 0 | 14120 | 2 |
| D | 0 | 19455 | 2 |
| Quadrant | Total seconds | Saturated seconds | Saturation percentage |
|---|---|---|---|
| A | 6373 | 86 | 1.349443% |
| B | 6373 | 107 | 1.678958% |
| C | 6373 | 139 | 2.181076% |
| D | 6373 | 311 | 4.879962% |
Noise dominated data is calculated using 1-second bins in cleaned event files. If a bin has >2000 counts, and if more than 50% of those come from <1% of pixels, then it is considered to be noise-dominated and hence unusable.
| Quadrant | # 1 sec bins | Bins with >0 counts | Bins with >2000 counts | High rate bins dominated by noise | Noise dominated (total time) | Noise dominated (detector-on time) | Marked lightcurve |
|---|---|---|---|---|---|---|---|
| A | 7663 | 6374 | 0 | 0 | 0.00% | 0.00% | 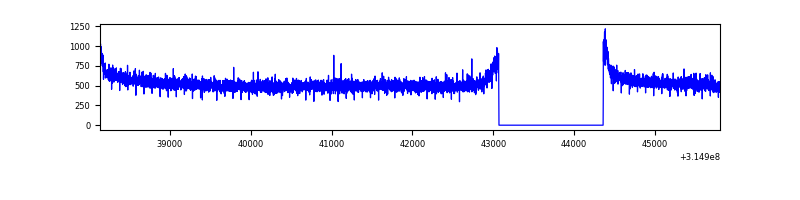 |
| B | 7663 | 6374 | 0 | 0 | 0.00% | 0.00% | 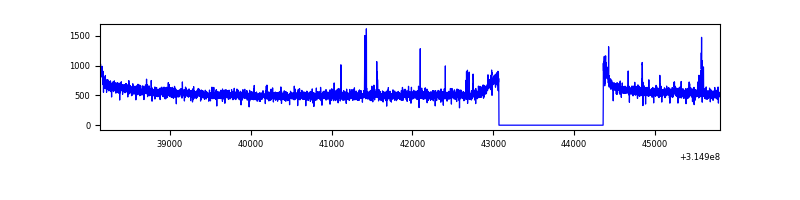 |
| C | 7663 | 6374 | 0 | 0 | 0.00% | 0.00% | 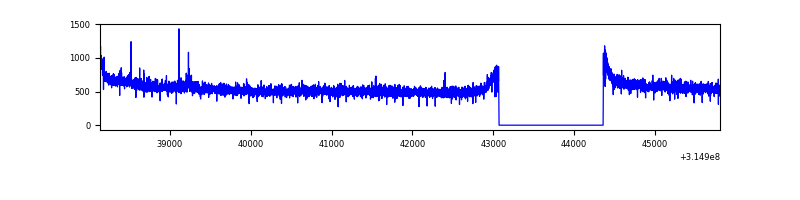 |
| D | 7663 | 6374 | 206 | 206 | 2.69% | 3.23% | 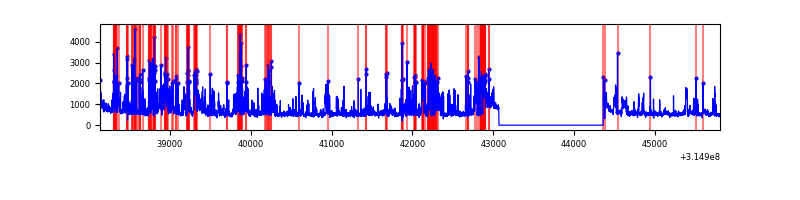 |
Top three noisy pixels from each quadrant. If the there are fewer than three noisy pixels in the level2.evt file, extra rows are filled as -1
| Pixel properties | Quadrant properties | ||||||
|---|---|---|---|---|---|---|---|
| Quadrant | DetID | PixID | Counts | Sigma | Mean | Median | Sigma |
| A | 13 | 254 | 10466 | 56.25 | 872 | 857 | 170.8 |
| A | 0 | 226 | 7539 | 39.12 | 872 | 857 | 170.8 |
| A | 3 | 137 | 6719 | 34.32 | 872 | 857 | 170.8 |
| B | 12 | 111 | 18311 | 108.19 | 876 | 857 | 161.3 |
| B | 0 | 190 | 17132 | 100.88 | 876 | 857 | 161.3 |
| B | 11 | 111 | 15997 | 93.84 | 876 | 857 | 161.3 |
| C | 14 | 238 | 137865 | 702.85 | 854 | 862 | 194.9 |
| C | 7 | 247 | 20705 | 101.8 | 854 | 862 | 194.9 |
| C | 13 | 61 | 6047 | 26.6 | 854 | 862 | 194.9 |
| D | 1 | 52 | 1695013 | 8322.91 | 852 | 832 | 203.6 |
| D | 13 | 153 | 194299 | 950.43 | 852 | 832 | 203.6 |
| D | 12 | 227 | 26415 | 125.68 | 852 | 832 | 203.6 |
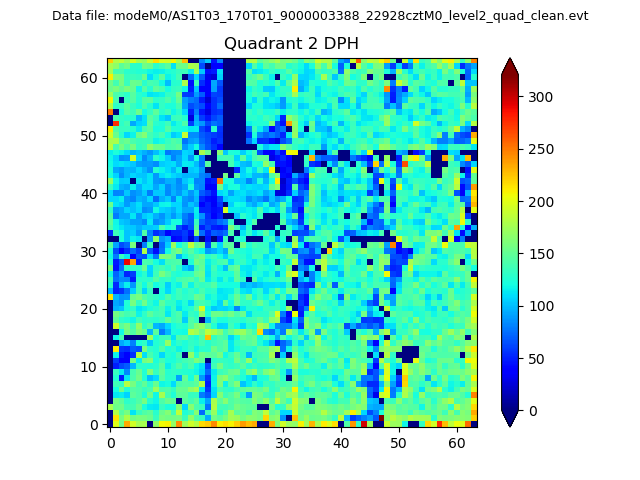
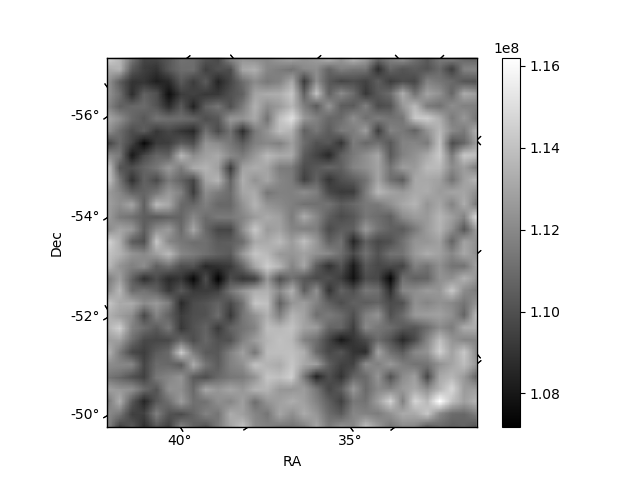
Histogram calculated using DETX and DETY for each event in the final _common_clean file
| Quadrant A |  |
 |
Quadrant B |
|---|---|---|---|
| Quadrant D | 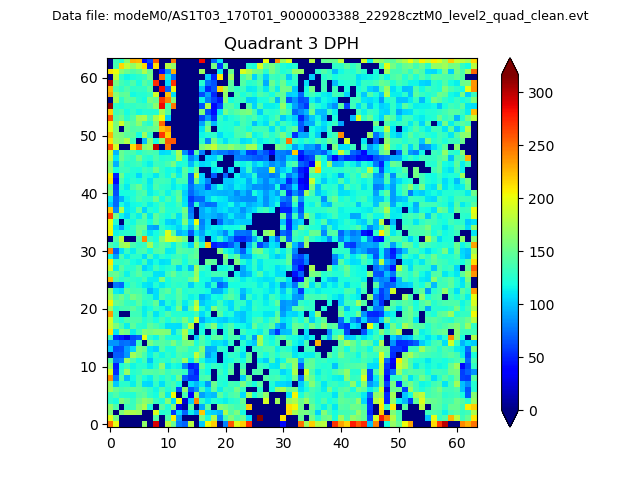 |
 |
Quadrant C |
| Plot type | Count rate plots | Images |
|---|---|---|
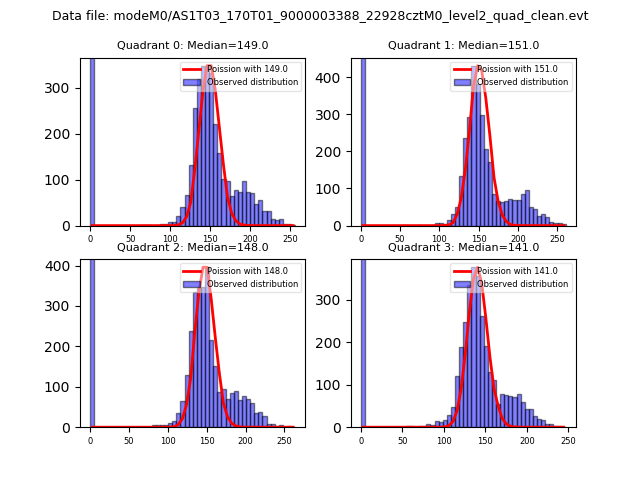
| Comparison with Poisson distribution Blue bars denote a histogram of data divided into 1 sec bins. Red curve is a Poisson curve with rate = median count rate of data. |
 |
 |
| Quadrant-wise count rates Data is divided into 100 sec bins |
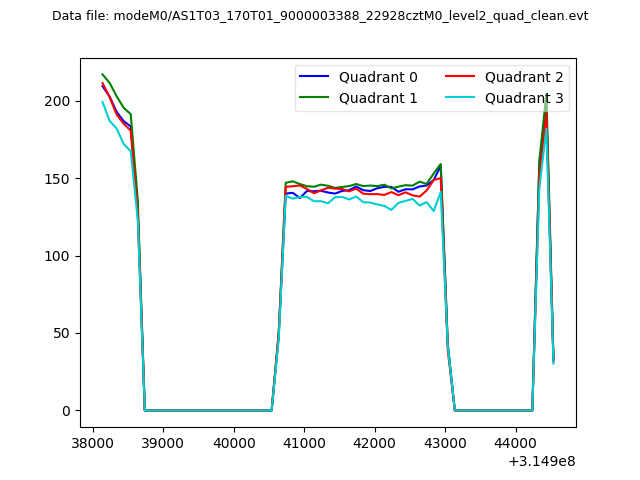 |
|
| Module-wise count rates for Quadrant A Data is divided into 100 sec bins |
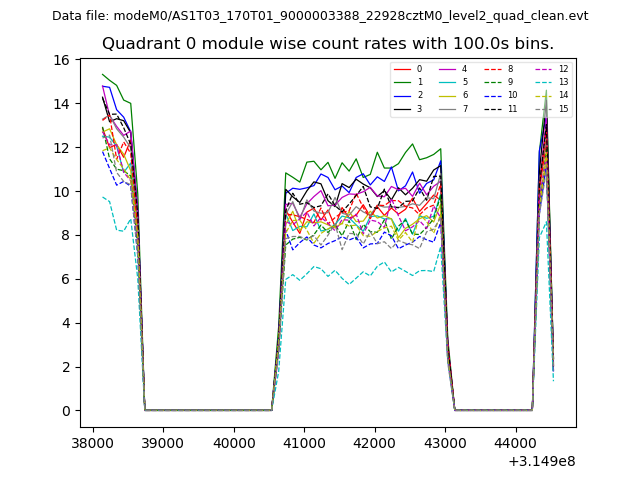 |
 |
| Module-wise count rates for Quadrant B Data is divided into 100 sec bins |
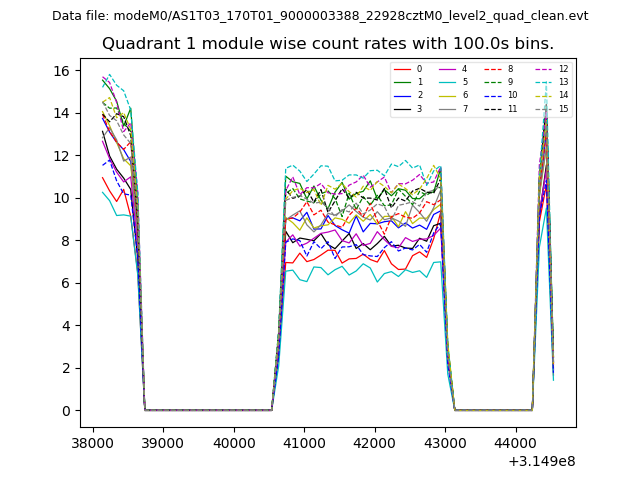 |
 |
| Module-wise count rates for Quadrant C Data is divided into 100 sec bins |
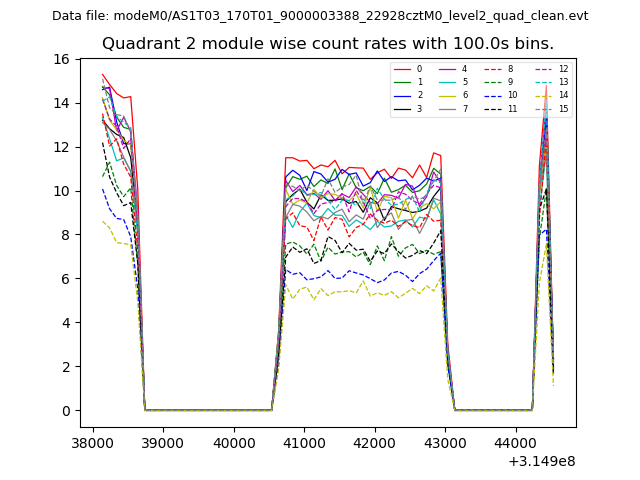 |
 |
| Module-wise count rates for Quadrant D Data is divided into 100 sec bins |
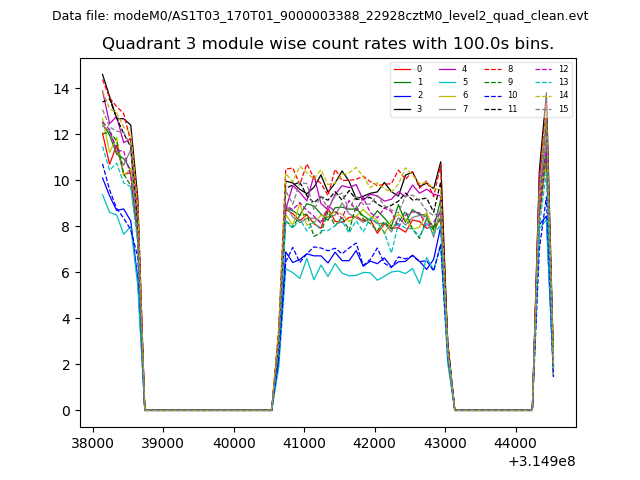 |
 |
| Parameter | Plot |
|---|---|
| CZT HV Monitor | 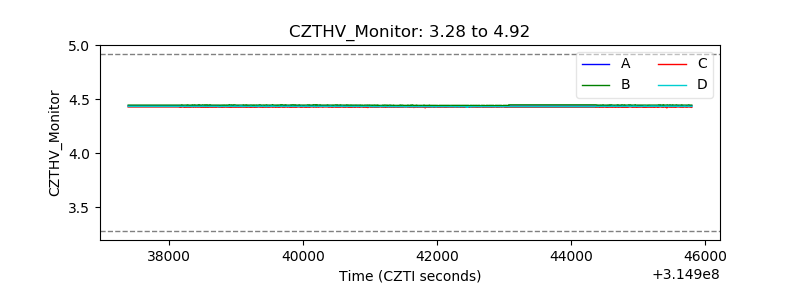 |
| D_VDD | 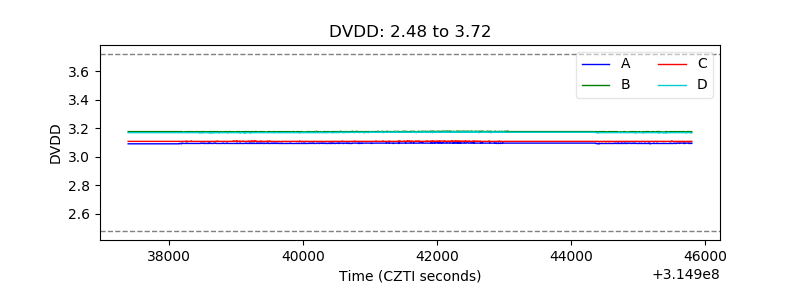 |
| Temperature 1 | 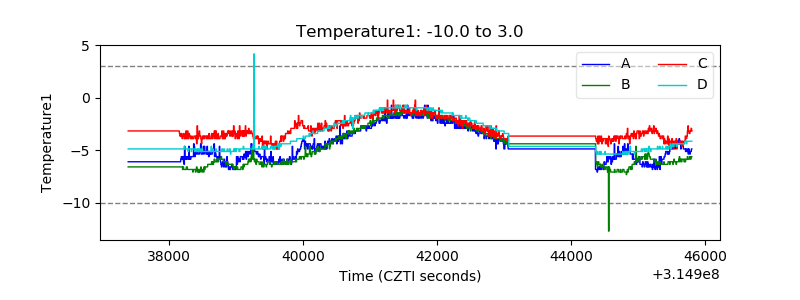 |
| Veto HV Monitor |  |
| Veto LLD | 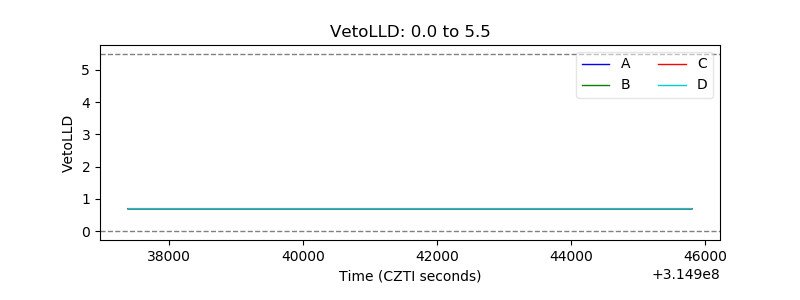 |
| Alpha Counter | 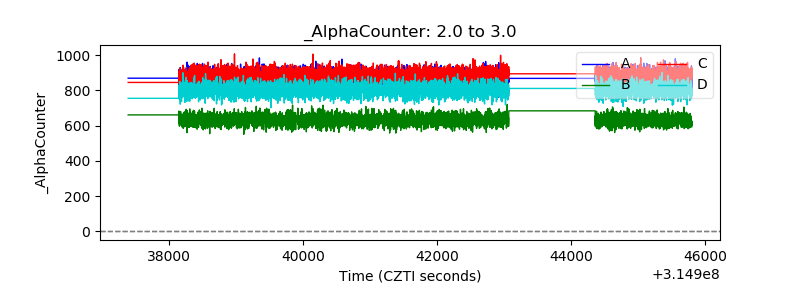 |
| _CPM_Rate |  |
| CZT Counter | 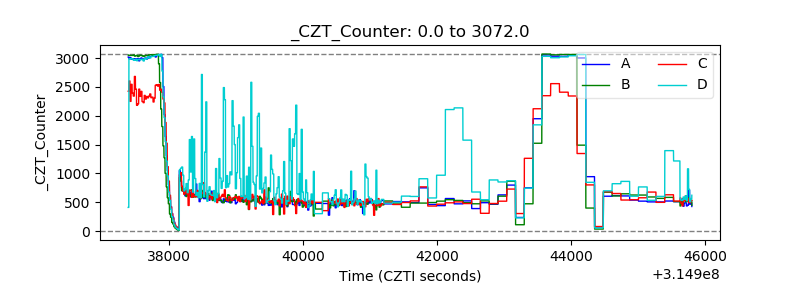 |
| +2.5 Volts monitor | 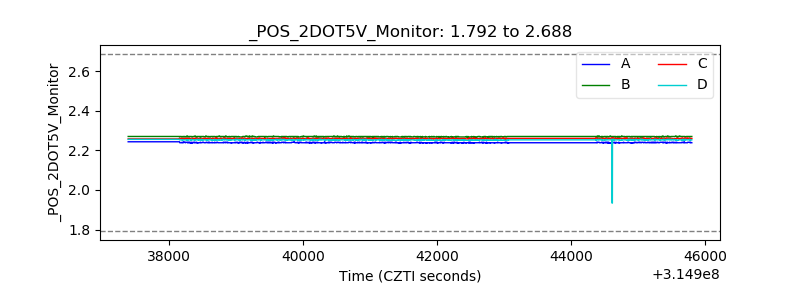 |
| +5 Volts monitor |  |
| _ROLL_ROT | 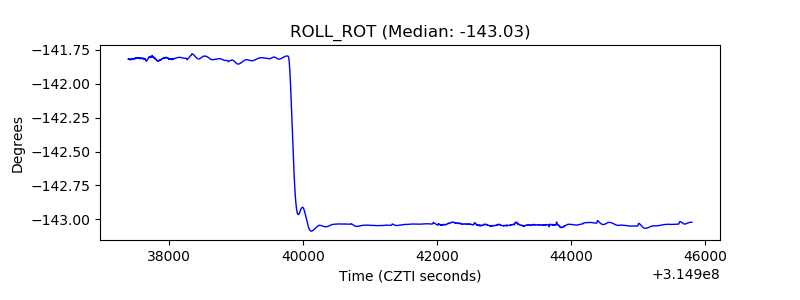 |
| _Roll_DEC |  |
| _Roll_RA | 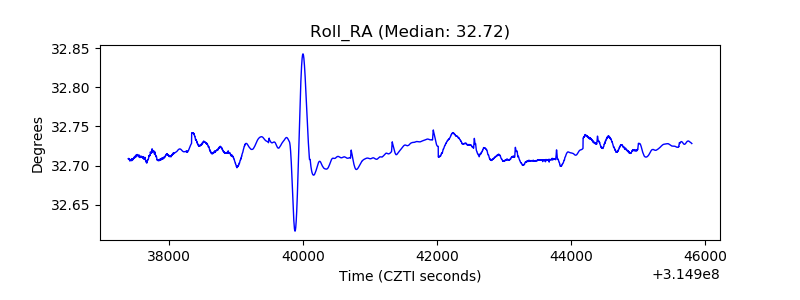 |
| Veto Counter | 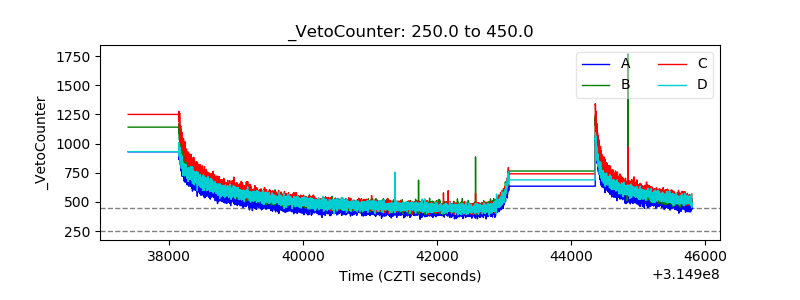 |