| Param | Original file | Final file |
|---|---|---|
| Filename | modeM0/AS1T03_170T01_9000003388_22929cztM0_level2.evt | modeM0/AS1T03_170T01_9000003388_22929cztM0_level2_quad_clean.evt |
| Size (bytes) | 476,881,920 | 71,994,240 |
| Size | 454.8 MB | 68.7 MB |
| Events in quadrant A | 3,258,494 | 441,284 |
| Events in quadrant B | 3,374,440 | 447,950 |
| Events in quadrant C | 3,350,888 | 432,971 |
| Events in quadrant D | 4,031,589 | 418,760 |
| Mode SS | |||
|---|---|---|---|
| Quadrant | BADHDUFLAG | Total packets | Discarded packets |
| A | 0 | 126 | 0 |
| B | 0 | 126 | 0 |
| C | 0 | 126 | 0 |
| D | 0 | 126 | 0 |
| Mode M9 | |||
|---|---|---|---|
| Quadrant | BADHDUFLAG | Total packets | Discarded packets |
| A | 0 | 15 | 0 |
| B | 0 | 16 | 0 |
| C | 0 | 16 | 0 |
| D | 0 | 16 | 0 |
| Mode M0 | |||
|---|---|---|---|
| Quadrant | BADHDUFLAG | Total packets | Discarded packets |
| A | 0 | 13292 | 2 |
| B | 0 | 13601 | 2 |
| C | 0 | 13607 | 2 |
| D | 0 | 15834 | 2 |
| Quadrant | Total seconds | Saturated seconds | Saturation percentage |
|---|---|---|---|
| A | 6287 | 102 | 1.622395% |
| B | 6287 | 134 | 2.131382% |
| C | 6287 | 172 | 2.735804% |
| D | 6287 | 143 | 2.274535% |
Noise dominated data is calculated using 1-second bins in cleaned event files. If a bin has >2000 counts, and if more than 50% of those come from <1% of pixels, then it is considered to be noise-dominated and hence unusable.
| Quadrant | # 1 sec bins | Bins with >0 counts | Bins with >2000 counts | High rate bins dominated by noise | Noise dominated (total time) | Noise dominated (detector-on time) | Marked lightcurve |
|---|---|---|---|---|---|---|---|
| A | 7517 | 6288 | 0 | 0 | 0.00% | 0.00% | 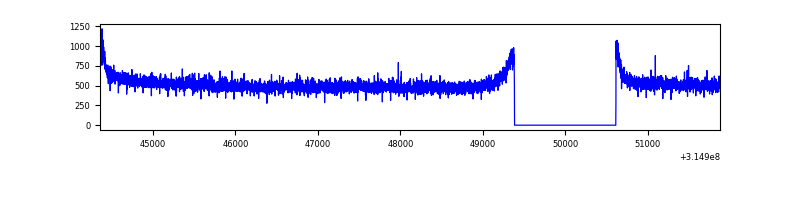 |
| B | 7517 | 6288 | 1 | 1 | 0.01% | 0.02% | 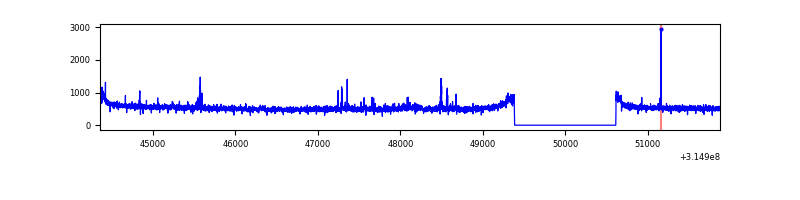 |
| C | 7517 | 6288 | 0 | 0 | 0.00% | 0.00% | 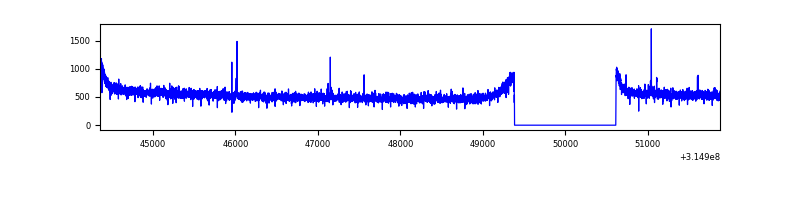 |
| D | 7517 | 6288 | 33 | 33 | 0.44% | 0.52% | 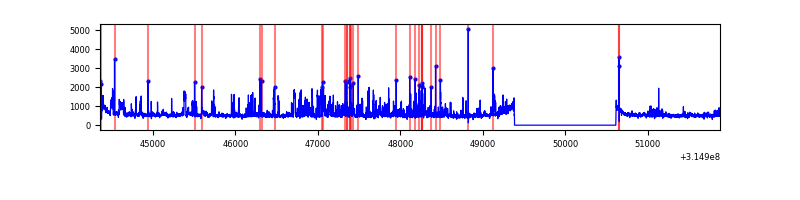 |
Top three noisy pixels from each quadrant. If the there are fewer than three noisy pixels in the level2.evt file, extra rows are filled as -1
| Pixel properties | Quadrant properties | ||||||
|---|---|---|---|---|---|---|---|
| Quadrant | DetID | PixID | Counts | Sigma | Mean | Median | Sigma |
| A | 13 | 254 | 10195 | 56.09 | 845 | 829 | 167.0 |
| A | 0 | 226 | 7278 | 38.62 | 845 | 829 | 167.0 |
| A | 3 | 137 | 6801 | 35.76 | 845 | 829 | 167.0 |
| B | 0 | 190 | 51356 | 321.25 | 842 | 823 | 157.3 |
| B | 12 | 111 | 18178 | 110.33 | 842 | 823 | 157.3 |
| B | 11 | 111 | 15811 | 95.28 | 842 | 823 | 157.3 |
| C | 14 | 238 | 130714 | 696.61 | 820 | 827 | 186.5 |
| C | 7 | 247 | 18517 | 94.87 | 820 | 827 | 186.5 |
| C | 13 | 61 | 5683 | 26.04 | 820 | 827 | 186.5 |
| D | 1 | 52 | 697463 | 3529.11 | 827 | 805 | 197.4 |
| D | 13 | 153 | 71612 | 358.69 | 827 | 805 | 197.4 |
| D | 12 | 233 | 38633 | 191.63 | 827 | 805 | 197.4 |
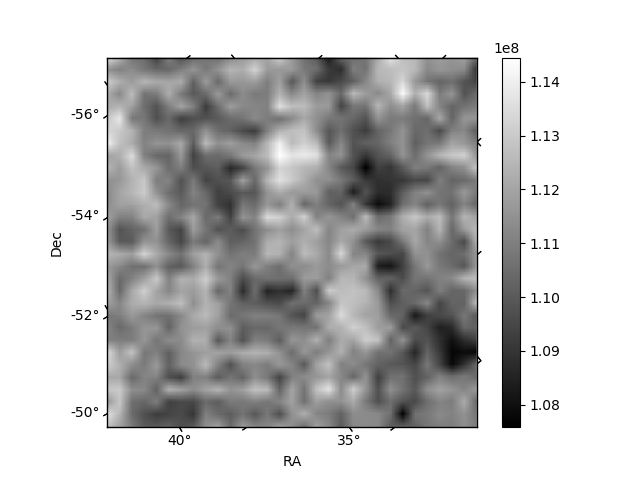
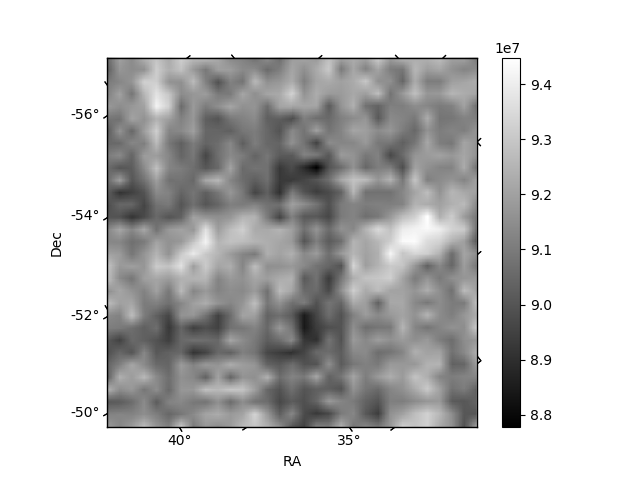
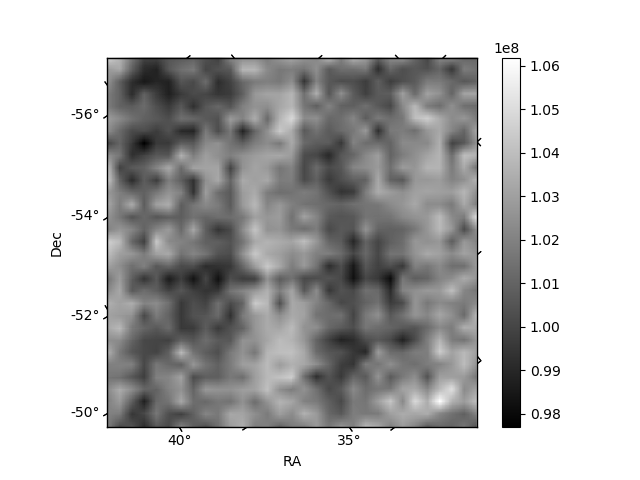
Histogram calculated using DETX and DETY for each event in the final _common_clean file
| Quadrant A | 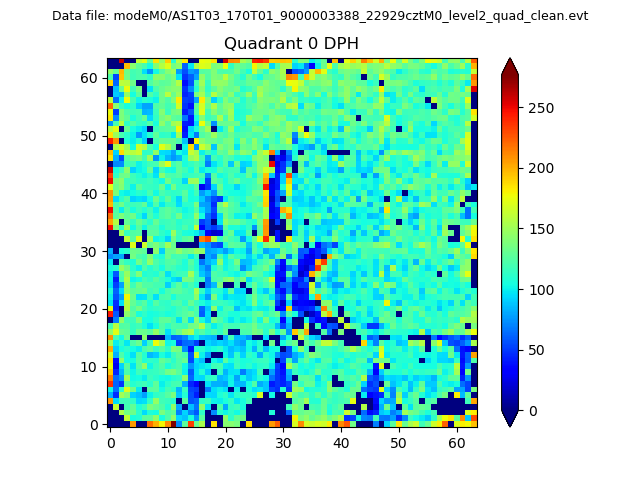 |
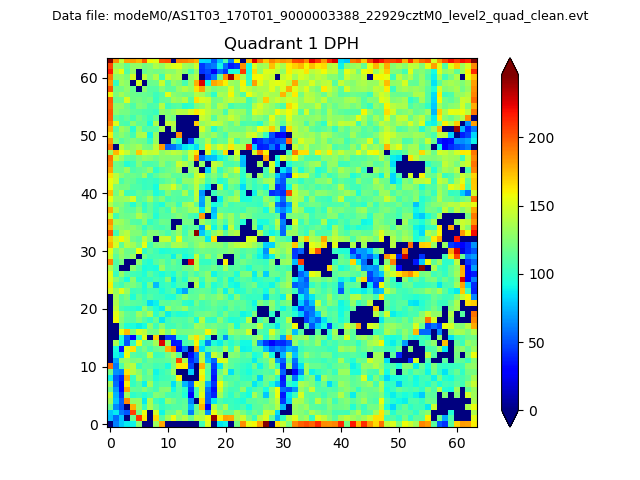 |
Quadrant B |
|---|---|---|---|
| Quadrant D |  |
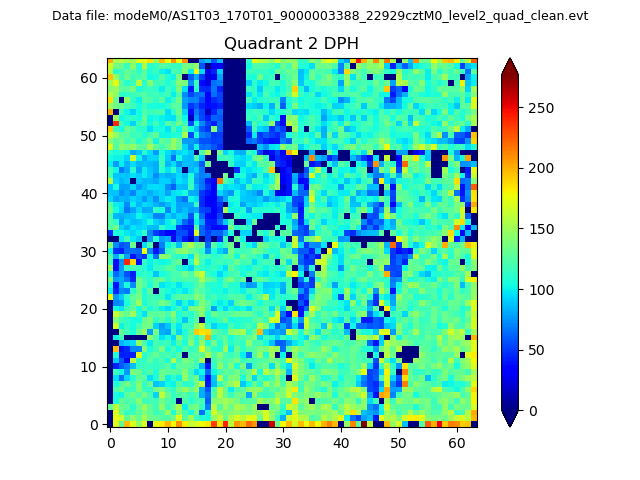 |
Quadrant C |
| Plot type | Count rate plots | Images |
|---|---|---|
| Comparison with Poisson distribution Blue bars denote a histogram of data divided into 1 sec bins. Red curve is a Poisson curve with rate = median count rate of data. |
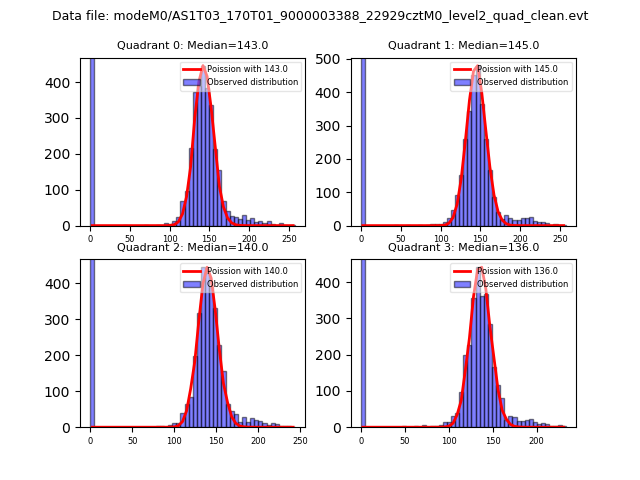 |
 |
| Quadrant-wise count rates Data is divided into 100 sec bins |
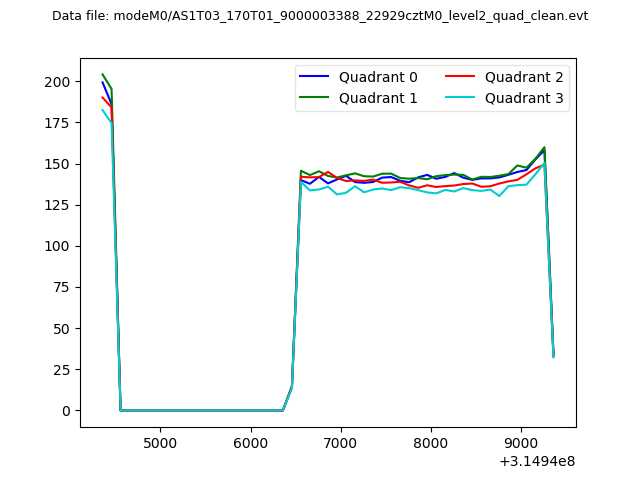 |
|
| Module-wise count rates for Quadrant A Data is divided into 100 sec bins |
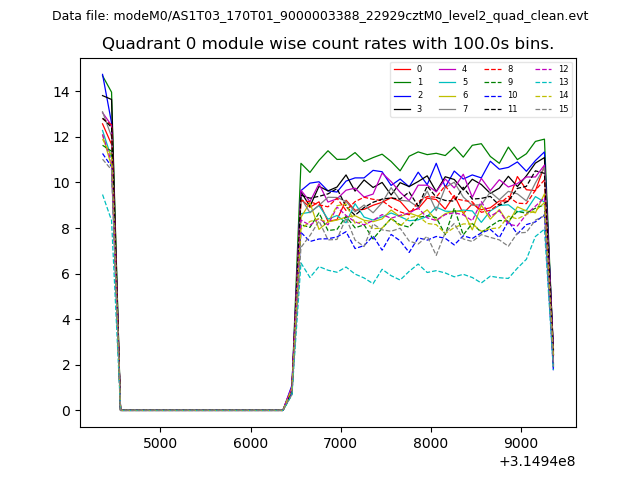 |
 |
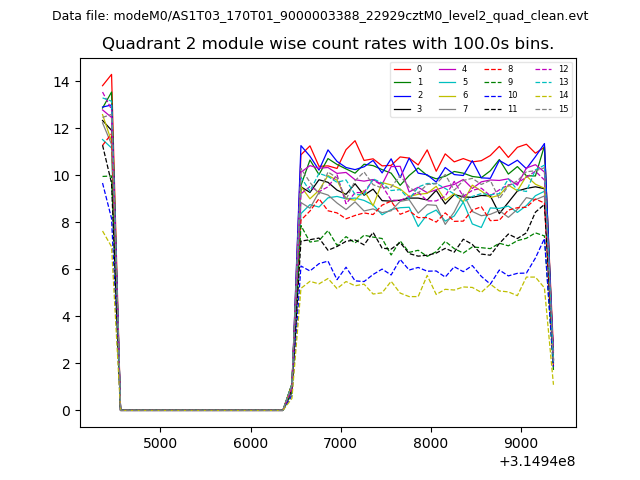
| Module-wise count rates for Quadrant B Data is divided into 100 sec bins |
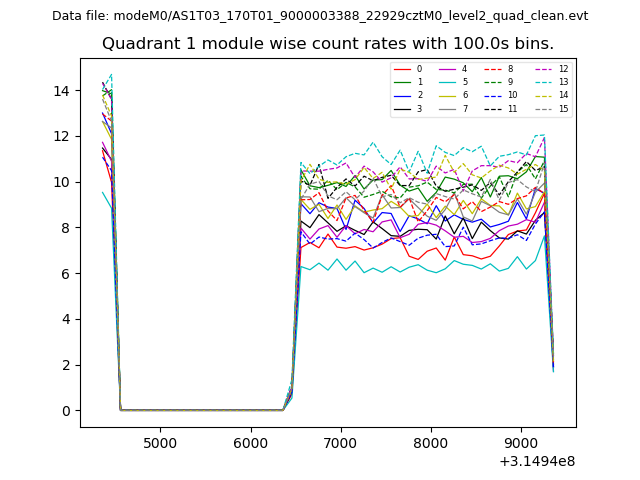 |
 |
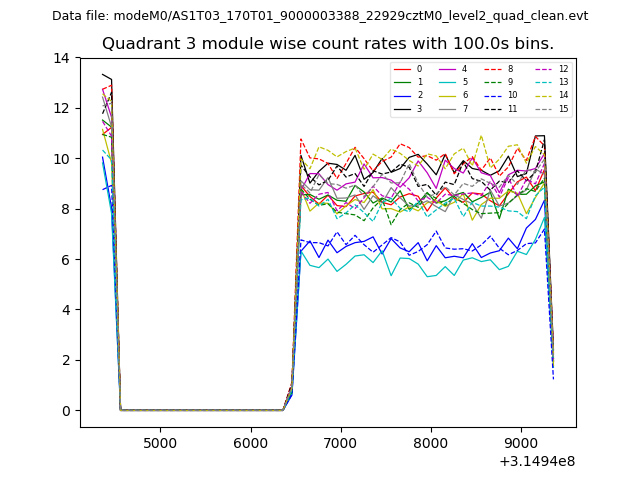
| Module-wise count rates for Quadrant C Data is divided into 100 sec bins |
 |
 |
| Module-wise count rates for Quadrant D Data is divided into 100 sec bins |
 |
 |
| Parameter | Plot |
|---|---|
| CZT HV Monitor | 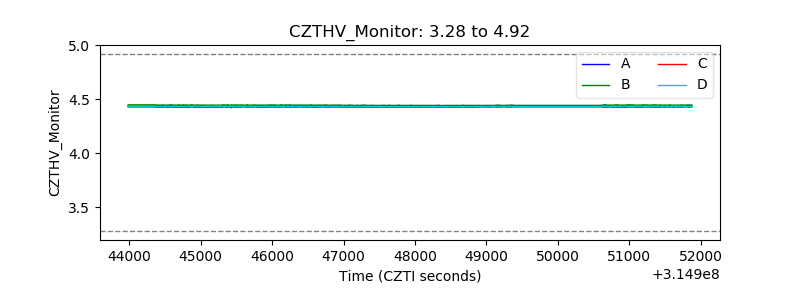 |
| D_VDD | 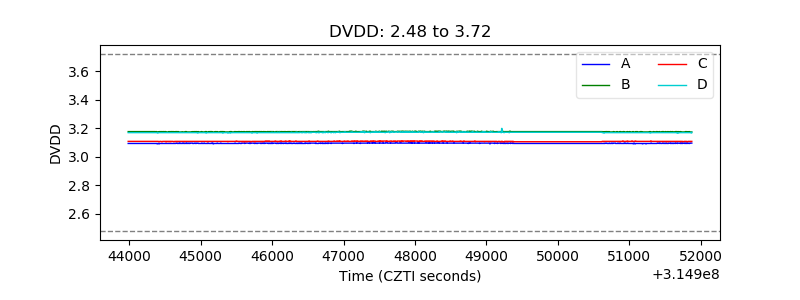 |
| Temperature 1 | 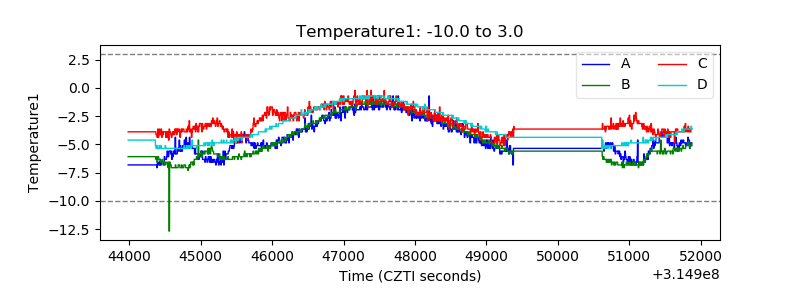 |
| Veto HV Monitor | 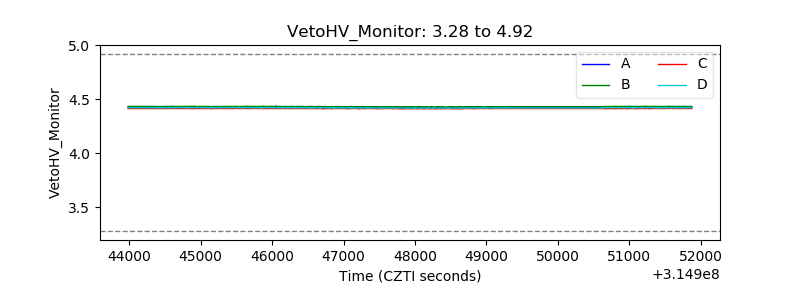 |
| Veto LLD | 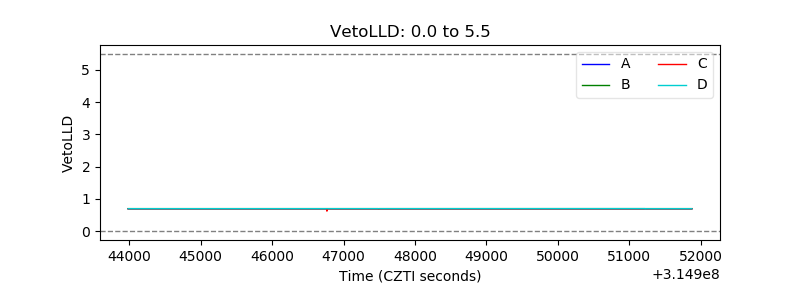 |
| Alpha Counter | 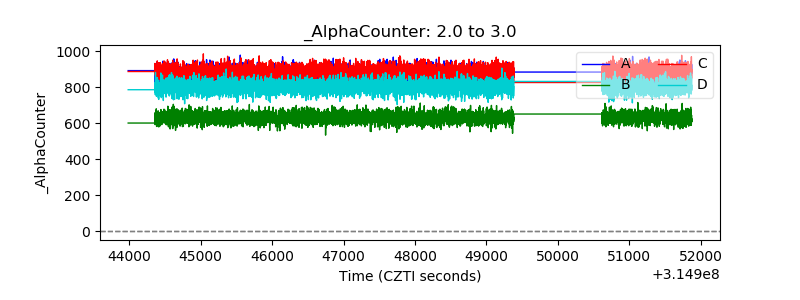 |
| _CPM_Rate | 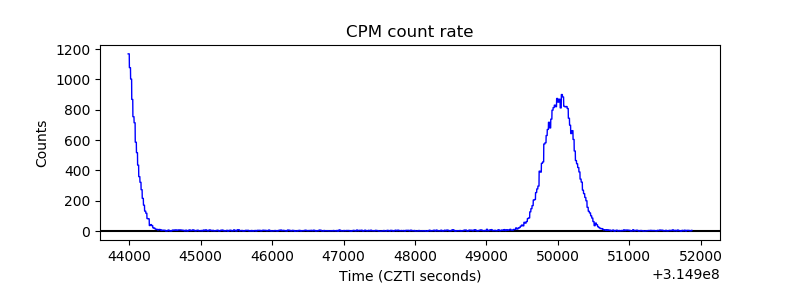 |
| CZT Counter |  |
| +2.5 Volts monitor |  |
| +5 Volts monitor |  |
| _ROLL_ROT | 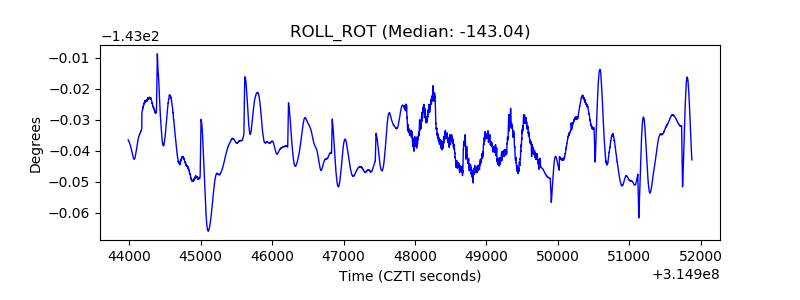 |
| _Roll_DEC |  |
| _Roll_RA | 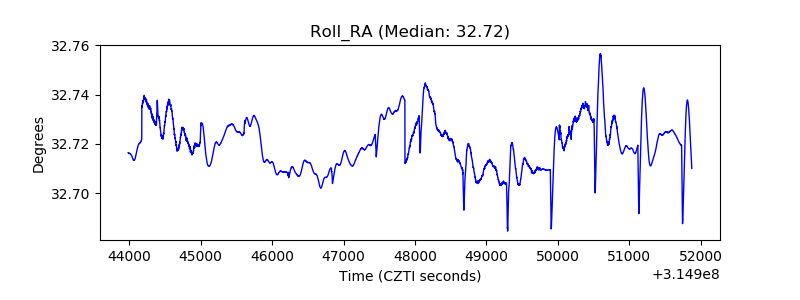 |
| Veto Counter | 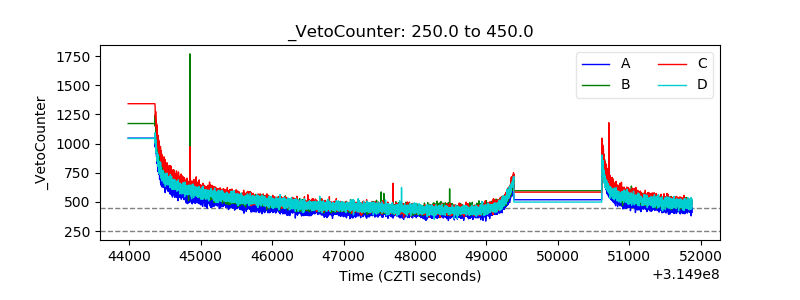 |