| Param | Original file | Final file |
|---|---|---|
| Filename | modeM0/AS1T03_170T01_9000003388_22930cztM0_level2.evt | modeM0/AS1T03_170T01_9000003388_22930cztM0_level2_quad_clean.evt |
| Size (bytes) | 521,317,440 | 77,129,280 |
| Size | 497.2 MB | 73.6 MB |
| Events in quadrant A | 3,289,833 | 477,922 |
| Events in quadrant B | 3,453,827 | 483,518 |
| Events in quadrant C | 3,362,729 | 469,115 |
| Events in quadrant D | 5,228,983 | 439,646 |
| Mode SS | |||
|---|---|---|---|
| Quadrant | BADHDUFLAG | Total packets | Discarded packets |
| A | 0 | 136 | 0 |
| B | 0 | 136 | 0 |
| C | 0 | 136 | 0 |
| D | 0 | 136 | 0 |
| Mode M9 | |||
|---|---|---|---|
| Quadrant | BADHDUFLAG | Total packets | Discarded packets |
| A | 0 | 16 | 0 |
| B | 0 | 17 | 0 |
| C | 0 | 17 | 0 |
| D | 0 | 17 | 0 |
| Mode M0 | |||
|---|---|---|---|
| Quadrant | BADHDUFLAG | Total packets | Discarded packets |
| A | 0 | 13806 | 2 |
| B | 0 | 14135 | 2 |
| C | 0 | 13959 | 2 |
| D | 0 | 19906 | 2 |
| Quadrant | Total seconds | Saturated seconds | Saturation percentage |
|---|---|---|---|
| A | 6669 | 106 | 1.589444% |
| B | 6669 | 136 | 2.039286% |
| C | 6669 | 167 | 2.504124% |
| D | 6669 | 400 | 5.997901% |
Noise dominated data is calculated using 1-second bins in cleaned event files. If a bin has >2000 counts, and if more than 50% of those come from <1% of pixels, then it is considered to be noise-dominated and hence unusable.
| Quadrant | # 1 sec bins | Bins with >0 counts | Bins with >2000 counts | High rate bins dominated by noise | Noise dominated (total time) | Noise dominated (detector-on time) | Marked lightcurve |
|---|---|---|---|---|---|---|---|
| A | 7634 | 6670 | 0 | 0 | 0.00% | 0.00% | 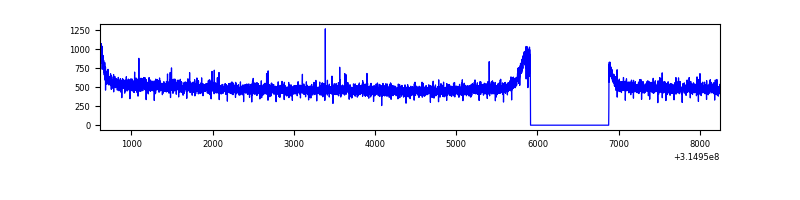 |
| B | 7634 | 6670 | 4 | 4 | 0.05% | 0.06% | 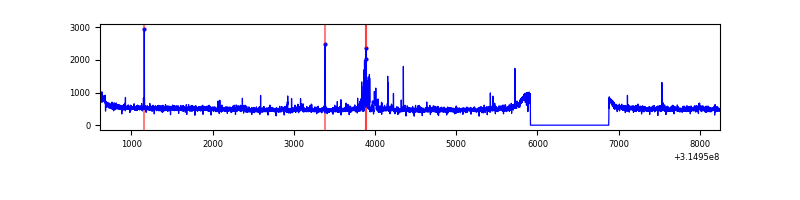 |
| C | 7634 | 6670 | 0 | 0 | 0.00% | 0.00% | 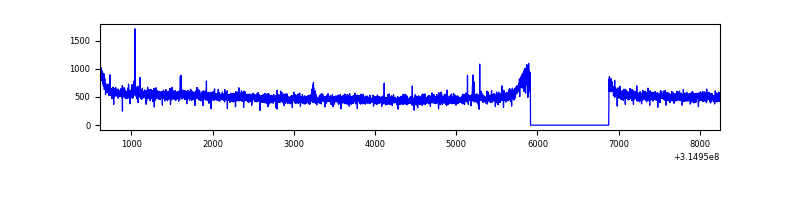 |
| D | 7634 | 6670 | 246 | 246 | 3.22% | 3.69% | 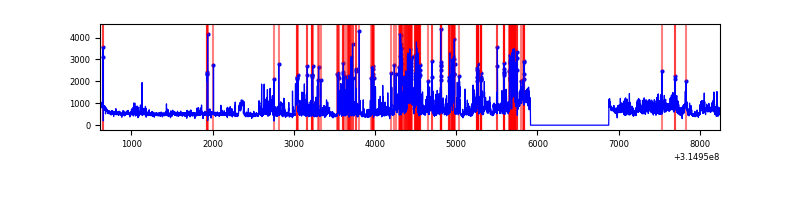 |
Top three noisy pixels from each quadrant. If the there are fewer than three noisy pixels in the level2.evt file, extra rows are filled as -1
| Pixel properties | Quadrant properties | ||||||
|---|---|---|---|---|---|---|---|
| Quadrant | DetID | PixID | Counts | Sigma | Mean | Median | Sigma |
| A | 13 | 254 | 11102 | 60.31 | 853 | 834 | 170.3 |
| A | 0 | 226 | 7338 | 38.2 | 853 | 834 | 170.3 |
| A | 3 | 137 | 6998 | 36.2 | 853 | 834 | 170.3 |
| B | 0 | 190 | 80346 | 493.77 | 849 | 827 | 161.0 |
| B | 12 | 111 | 19138 | 113.7 | 849 | 827 | 161.0 |
| B | 0 | 189 | 16995 | 100.39 | 849 | 827 | 161.0 |
| C | 14 | 238 | 131038 | 681.71 | 824 | 828 | 191.0 |
| C | 7 | 247 | 18071 | 90.28 | 824 | 828 | 191.0 |
| C | 13 | 61 | 5726 | 25.64 | 824 | 828 | 191.0 |
| D | 7 | 238 | 688037 | 3462.82 | 821 | 799 | 198.5 |
| D | 1 | 52 | 656774 | 3305.3 | 821 | 799 | 198.5 |
| D | 13 | 153 | 497488 | 2502.69 | 821 | 799 | 198.5 |
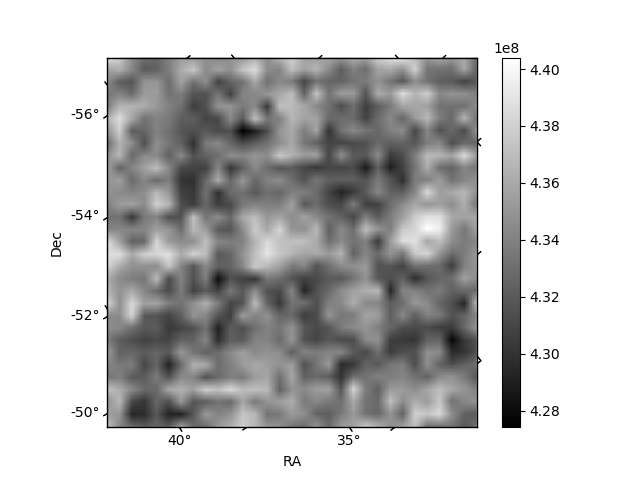
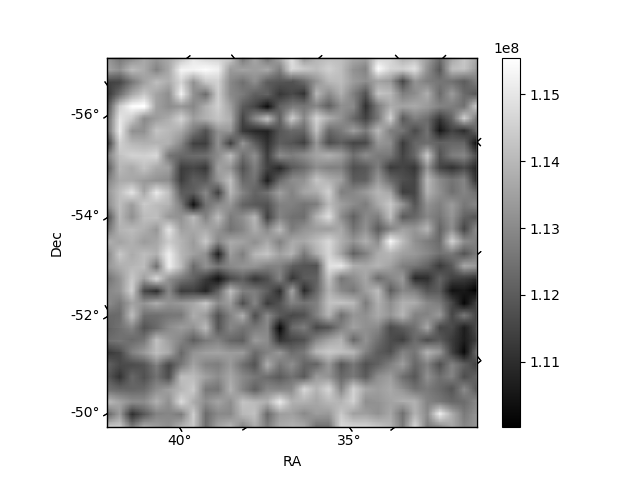
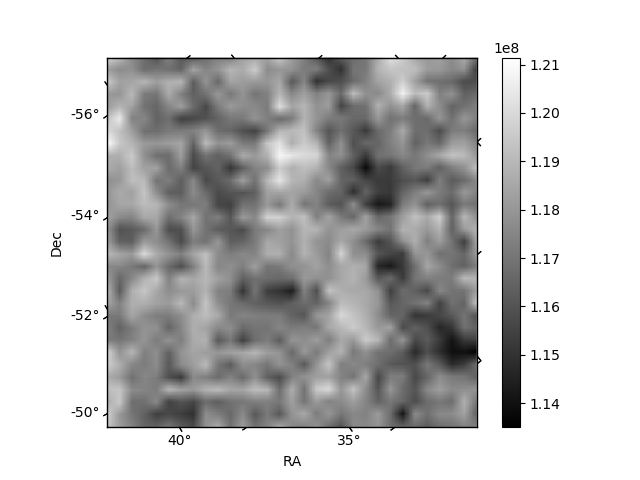
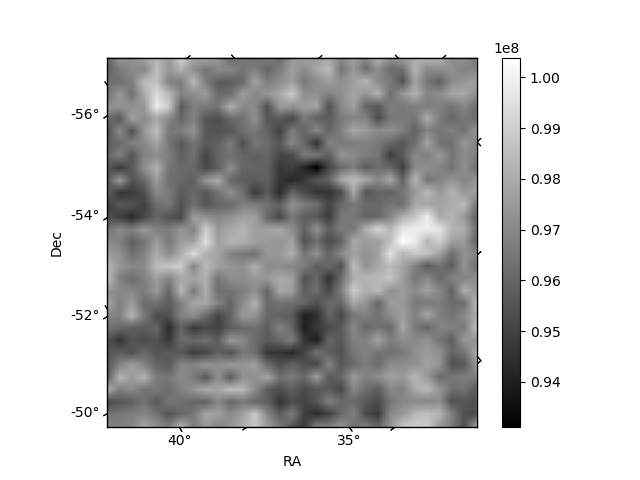
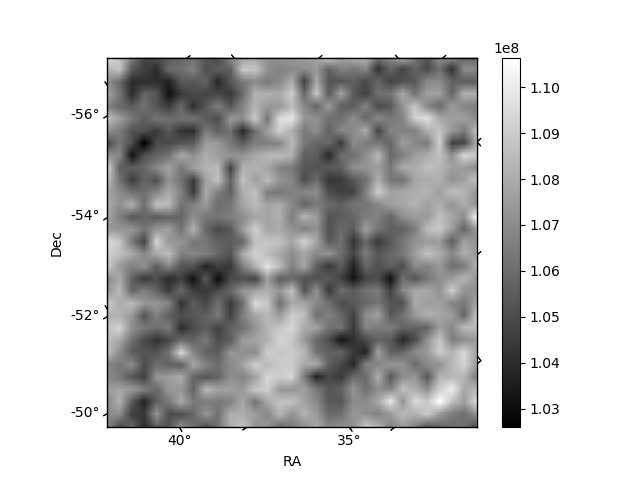
Histogram calculated using DETX and DETY for each event in the final _common_clean file
| Quadrant A | 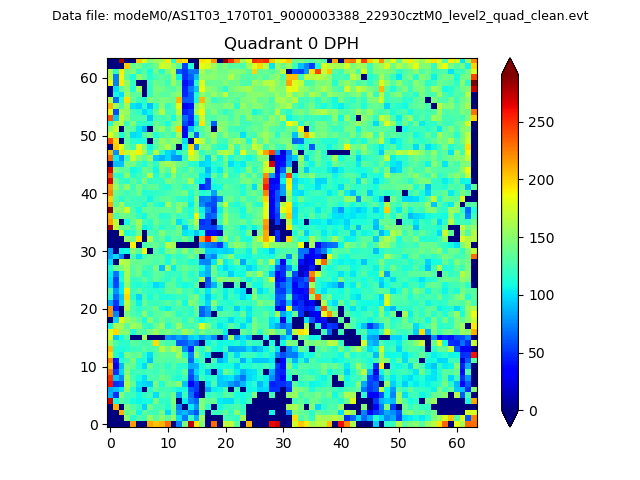 |
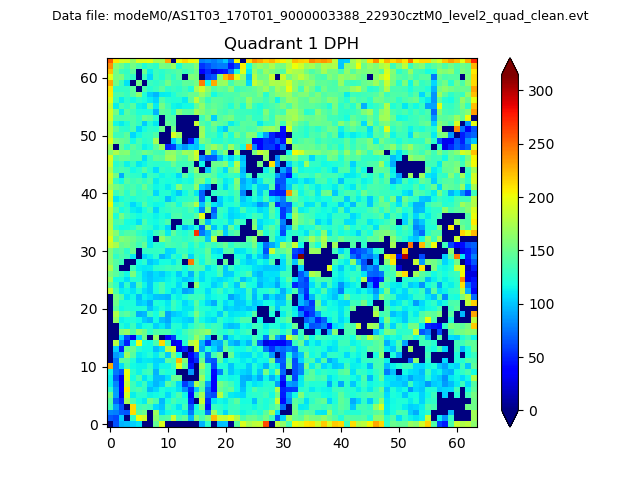 |
Quadrant B |
|---|---|---|---|
| Quadrant D | 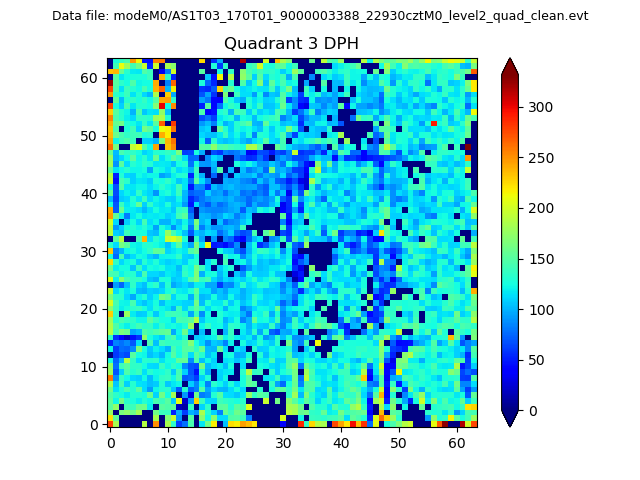 |
 |
Quadrant C |
| Plot type | Count rate plots | Images |
|---|---|---|
| Comparison with Poisson distribution Blue bars denote a histogram of data divided into 1 sec bins. Red curve is a Poisson curve with rate = median count rate of data. |
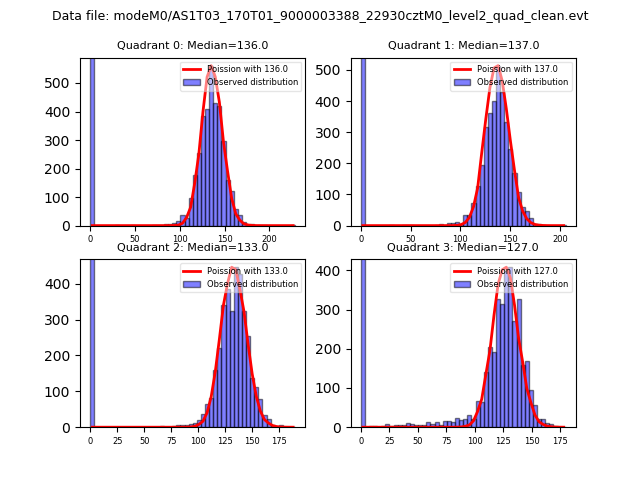 |
 |
| Quadrant-wise count rates Data is divided into 100 sec bins |
 |
|
| Module-wise count rates for Quadrant A Data is divided into 100 sec bins |
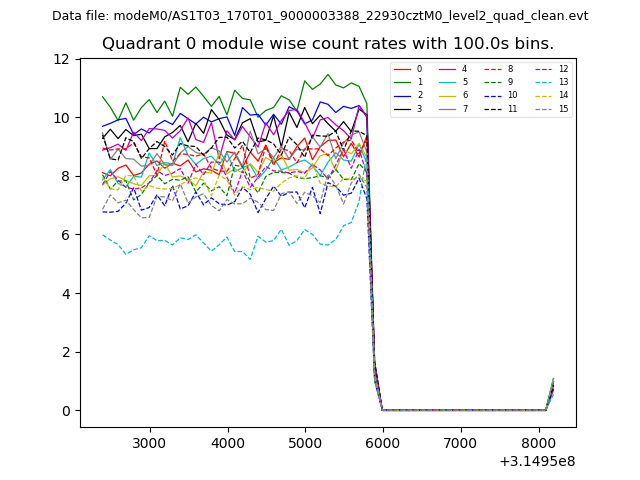 |
 |
| Module-wise count rates for Quadrant B Data is divided into 100 sec bins |
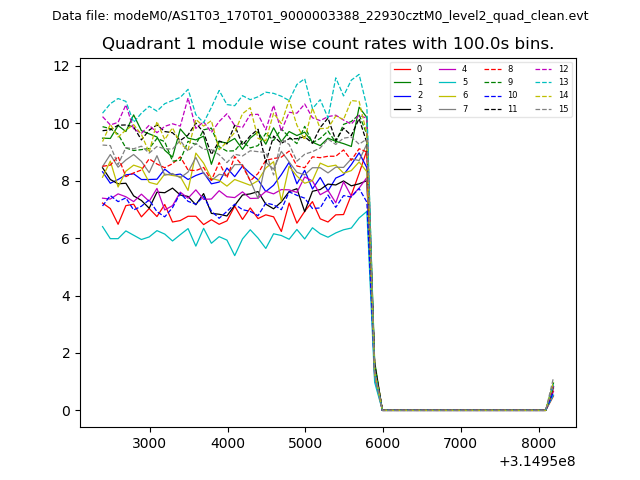 |
 |
| Module-wise count rates for Quadrant C Data is divided into 100 sec bins |
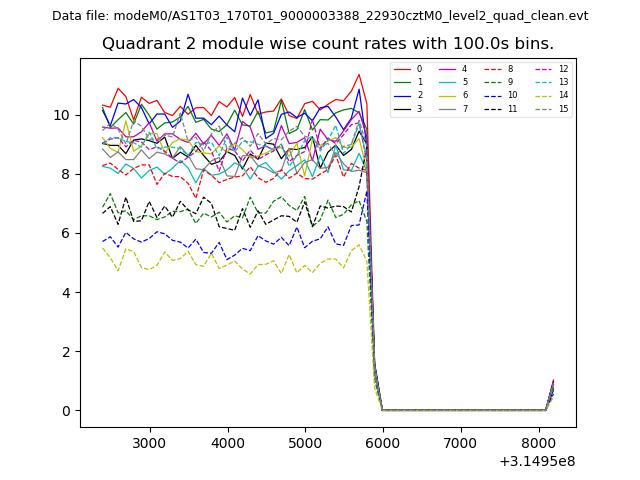 |
 |
| Module-wise count rates for Quadrant D Data is divided into 100 sec bins |
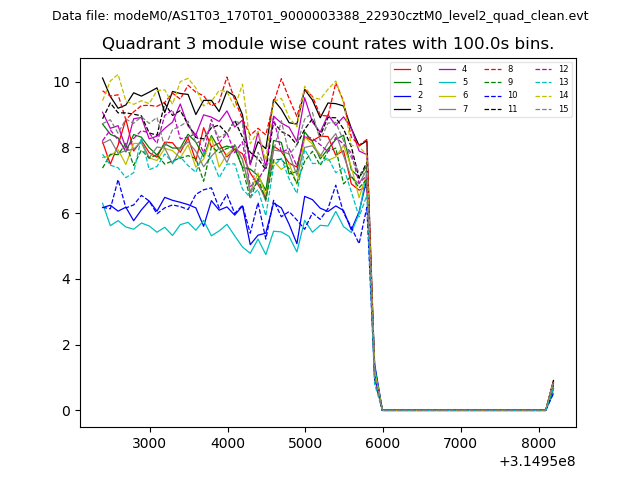 |
 |
| Parameter | Plot |
|---|---|
| CZT HV Monitor | 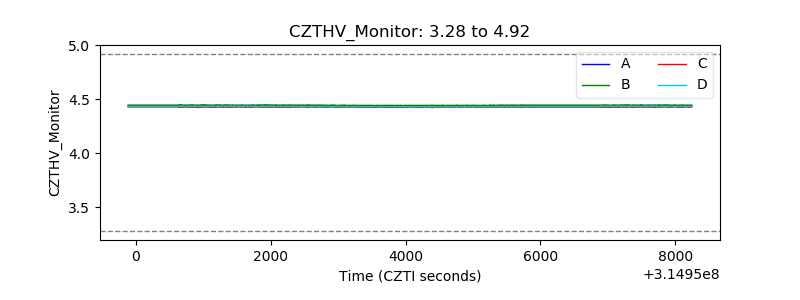 |
| D_VDD | 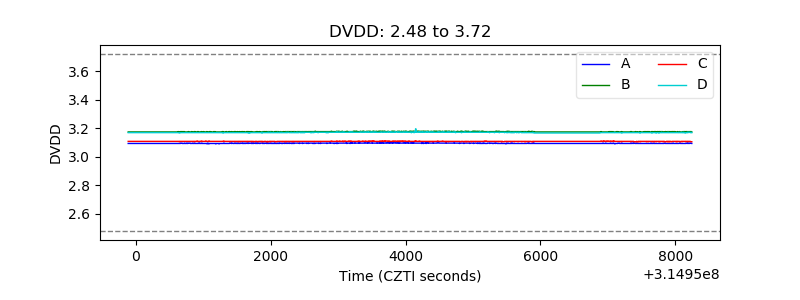 |
| Temperature 1 | 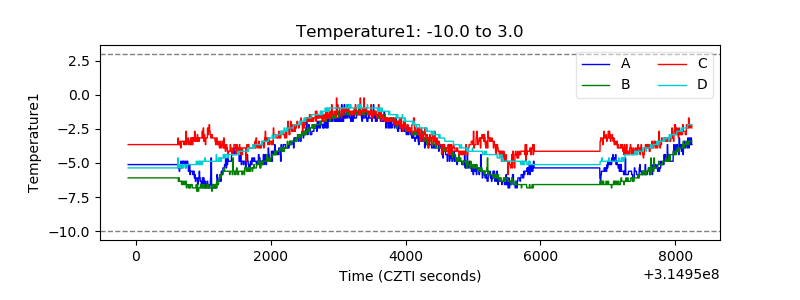 |
| Veto HV Monitor |  |
| Veto LLD | 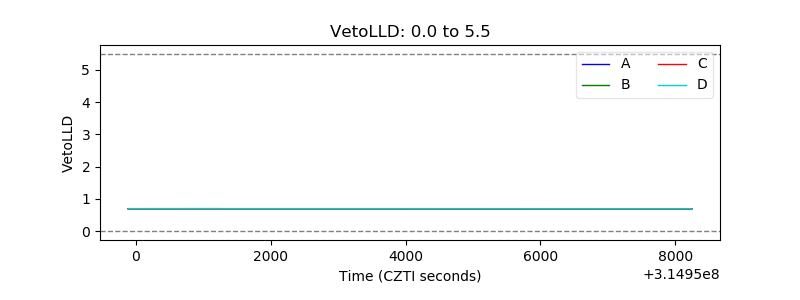 |
| Alpha Counter | 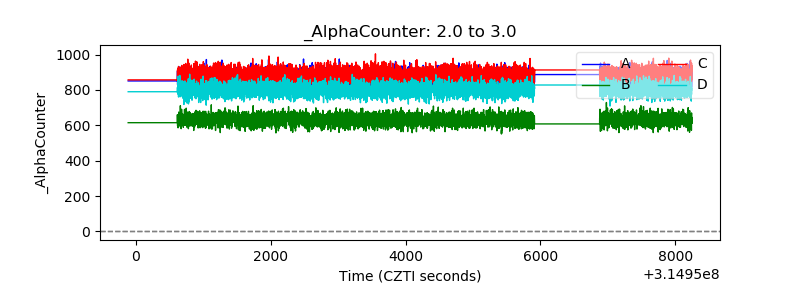 |
| _CPM_Rate |  |
| CZT Counter |  |
| +2.5 Volts monitor | 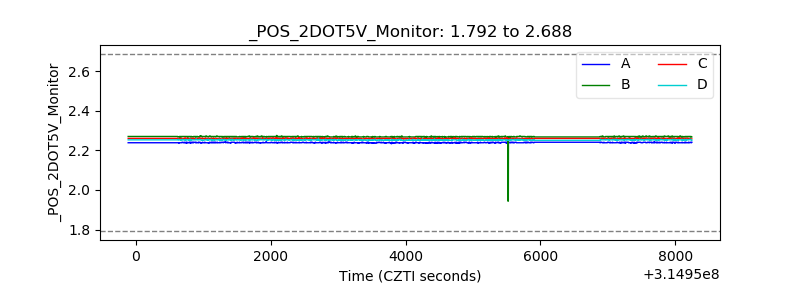 |
| +5 Volts monitor |  |
| _ROLL_ROT | 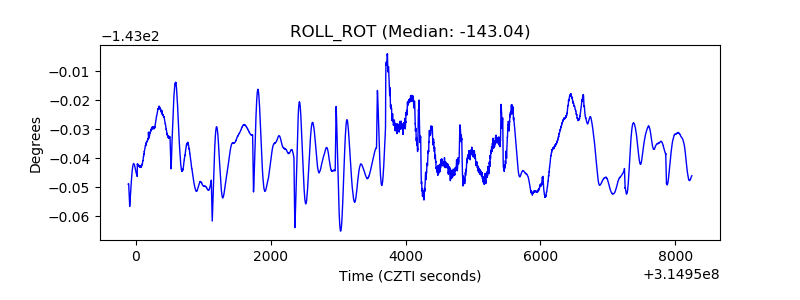 |
| _Roll_DEC | 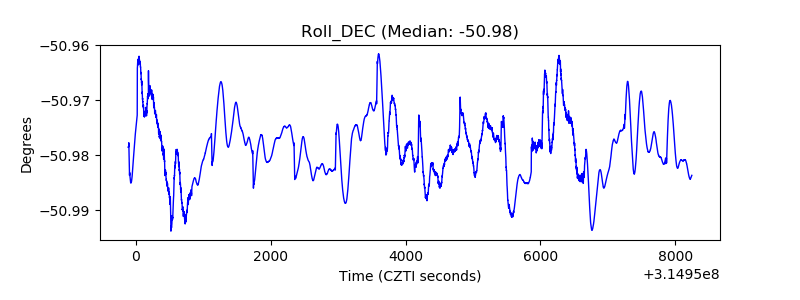 |
| _Roll_RA | 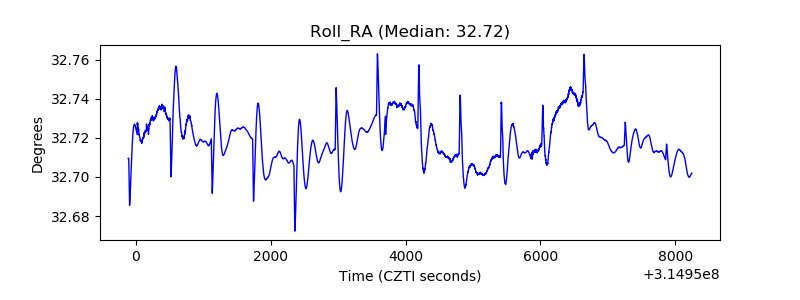 |
| Veto Counter | 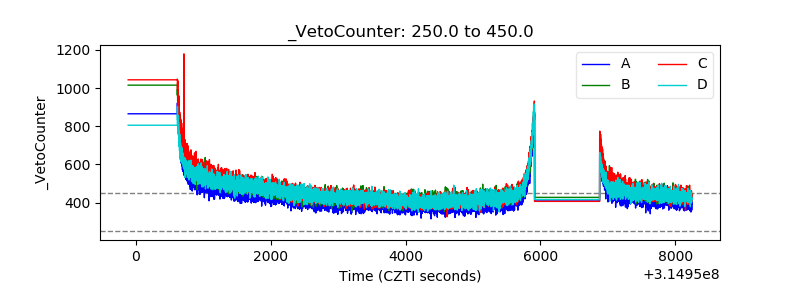 |