| Param | Original file | Final file |
|---|---|---|
| Filename | modeM0/AS1T03_170T01_9000003388_22931cztM0_level2.evt | modeM0/AS1T03_170T01_9000003388_22931cztM0_level2_quad_clean.evt |
| Size (bytes) | 561,648,960 | 98,760,960 |
| Size | 535.6 MB | 94.2 MB |
| Events in quadrant A | 3,684,884 | 627,223 |
| Events in quadrant B | 3,815,358 | 633,811 |
| Events in quadrant C | 3,746,658 | 612,813 |
| Events in quadrant D | 5,245,804 | 587,206 |
| Mode SS | |||
|---|---|---|---|
| Quadrant | BADHDUFLAG | Total packets | Discarded packets |
| A | 0 | 156 | 0 |
| B | 0 | 156 | 0 |
| C | 0 | 156 | 0 |
| D | 0 | 156 | 0 |
| Mode M9 | |||
|---|---|---|---|
| Quadrant | BADHDUFLAG | Total packets | Discarded packets |
| A | 0 | 15 | 0 |
| B | 0 | 15 | 0 |
| C | 0 | 15 | 0 |
| D | 0 | 15 | 0 |
| Mode M0 | |||
|---|---|---|---|
| Quadrant | BADHDUFLAG | Total packets | Discarded packets |
| A | 0 | 15784 | 2 |
| B | 0 | 15979 | 2 |
| C | 0 | 15880 | 2 |
| D | 0 | 20752 | 2 |
| Quadrant | Total seconds | Saturated seconds | Saturation percentage |
|---|---|---|---|
| A | 7616 | 205 | 2.691702% |
| B | 7617 | 244 | 3.203361% |
| C | 7617 | 273 | 3.584088% |
| D | 7617 | 398 | 5.225154% |
Noise dominated data is calculated using 1-second bins in cleaned event files. If a bin has >2000 counts, and if more than 50% of those come from <1% of pixels, then it is considered to be noise-dominated and hence unusable.
| Quadrant | # 1 sec bins | Bins with >0 counts | Bins with >2000 counts | High rate bins dominated by noise | Noise dominated (total time) | Noise dominated (detector-on time) | Marked lightcurve |
|---|---|---|---|---|---|---|---|
| A | 9141 | 7618 | 0 | 0 | 0.00% | 0.00% | 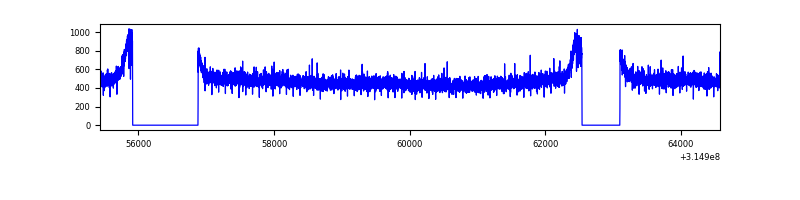 |
| B | 9142 | 7619 | 1 | 1 | 0.01% | 0.01% | 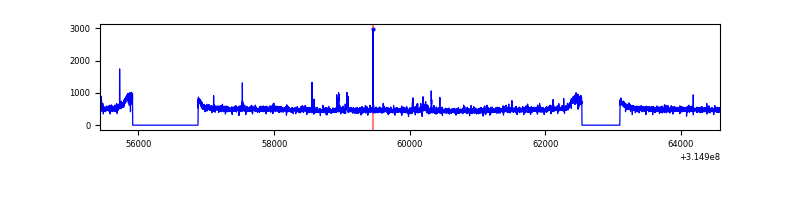 |
| C | 9142 | 7619 | 0 | 0 | 0.00% | 0.00% | 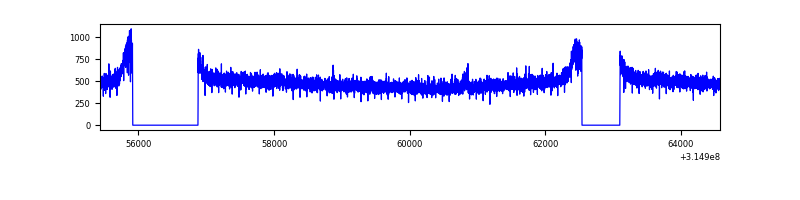 |
| D | 9142 | 7619 | 157 | 157 | 1.72% | 2.06% | 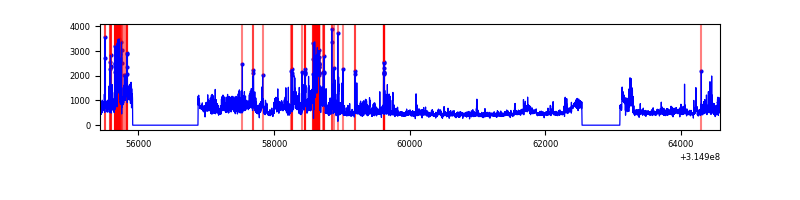 |
Top three noisy pixels from each quadrant. If the there are fewer than three noisy pixels in the level2.evt file, extra rows are filled as -1
| Pixel properties | Quadrant properties | ||||||
|---|---|---|---|---|---|---|---|
| Quadrant | DetID | PixID | Counts | Sigma | Mean | Median | Sigma |
| A | 13 | 254 | 12497 | 59.9 | 955 | 932 | 193.1 |
| A | 3 | 137 | 8385 | 38.6 | 955 | 932 | 193.1 |
| A | 0 | 226 | 8187 | 37.57 | 955 | 932 | 193.1 |
| B | 0 | 190 | 34852 | 185.22 | 951 | 927 | 183.2 |
| B | 12 | 111 | 22084 | 115.51 | 951 | 927 | 183.2 |
| B | 11 | 111 | 19612 | 102.01 | 951 | 927 | 183.2 |
| C | 14 | 238 | 142684 | 664.8 | 921 | 926 | 213.2 |
| C | 7 | 247 | 10934 | 46.93 | 921 | 926 | 213.2 |
| C | 13 | 61 | 6421 | 25.77 | 921 | 926 | 213.2 |
| D | 7 | 238 | 847166 | 3754.02 | 926 | 898 | 225.4 |
| D | 1 | 52 | 531074 | 2351.84 | 926 | 898 | 225.4 |
| D | 1 | 239 | 151310 | 667.22 | 926 | 898 | 225.4 |
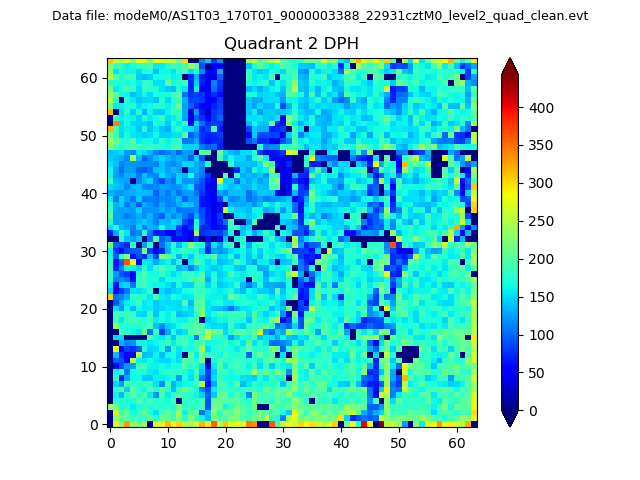
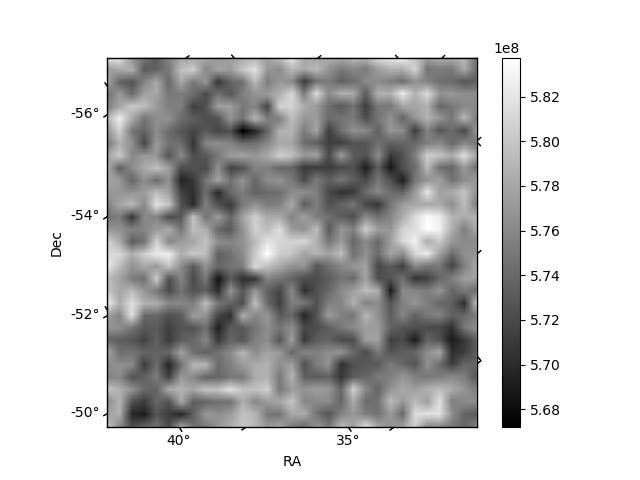
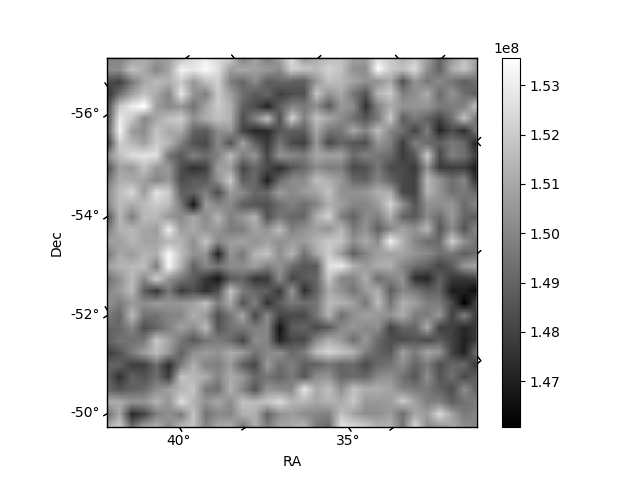
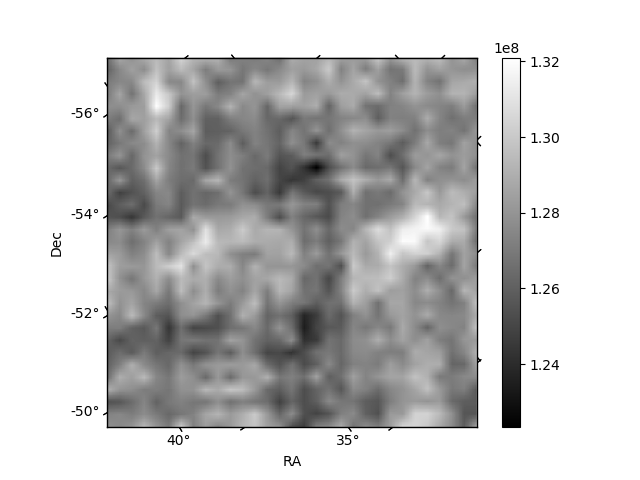
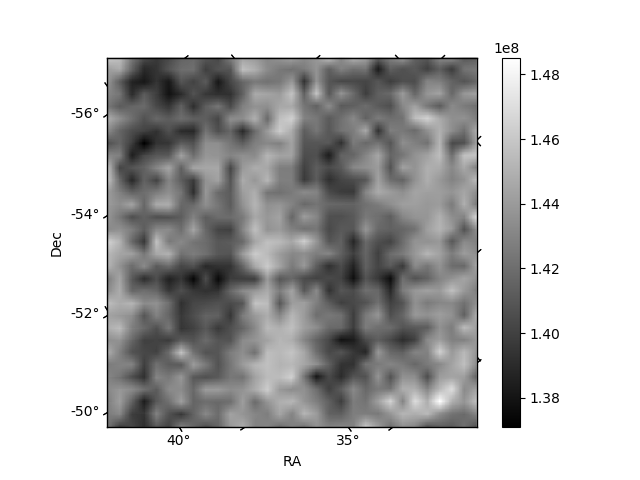
Histogram calculated using DETX and DETY for each event in the final _common_clean file
| Quadrant A | 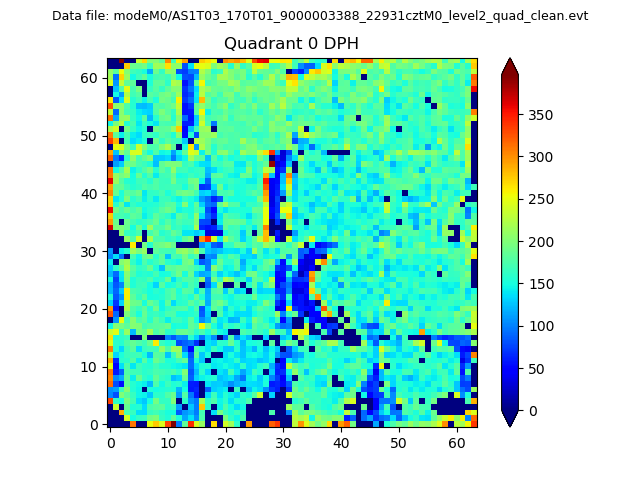 |
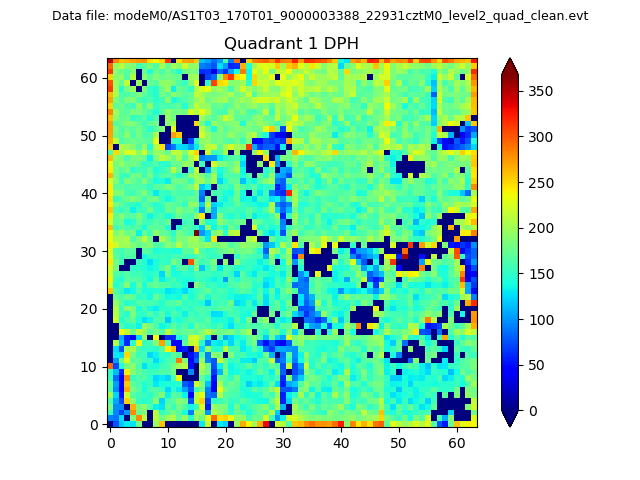 |
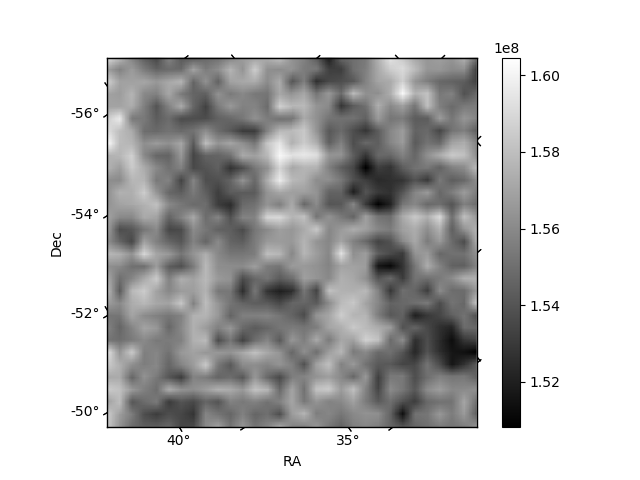
Quadrant B |
|---|---|---|---|
| Quadrant D | 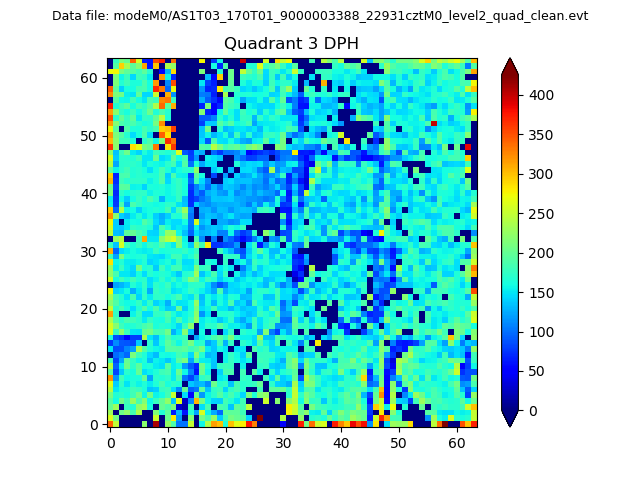 |
 |
Quadrant C |
| Plot type | Count rate plots | Images |
|---|---|---|
| Comparison with Poisson distribution Blue bars denote a histogram of data divided into 1 sec bins. Red curve is a Poisson curve with rate = median count rate of data. |
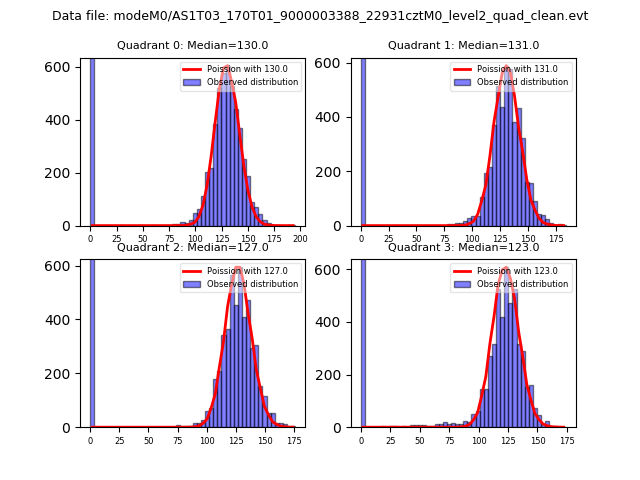 |
 |
| Quadrant-wise count rates Data is divided into 100 sec bins |
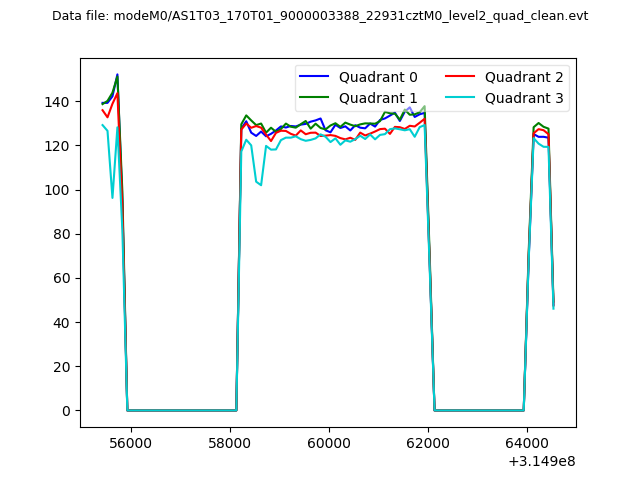 |
|
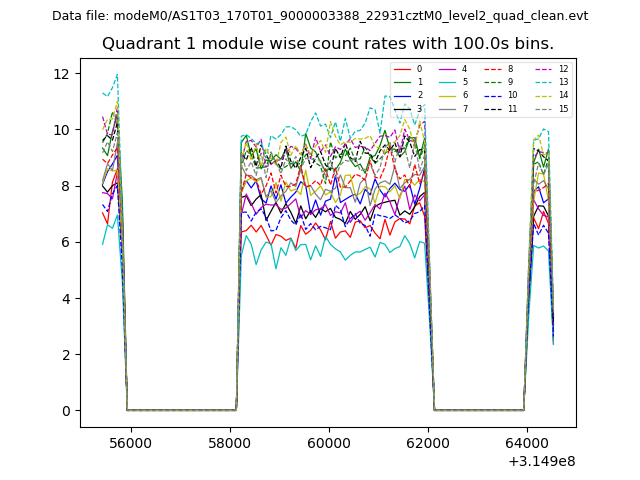
| Module-wise count rates for Quadrant A Data is divided into 100 sec bins |
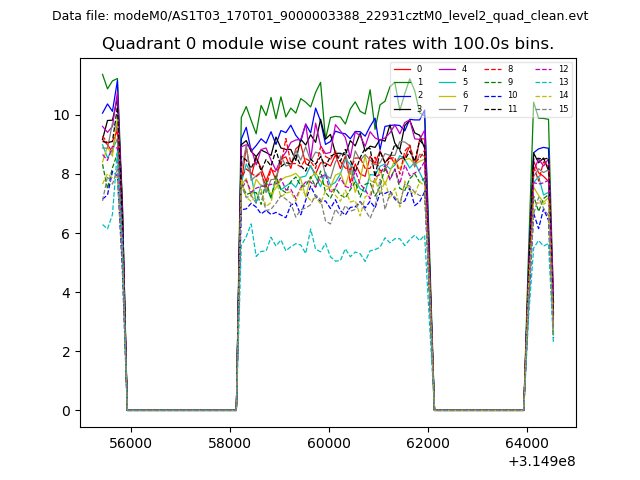 |
 |
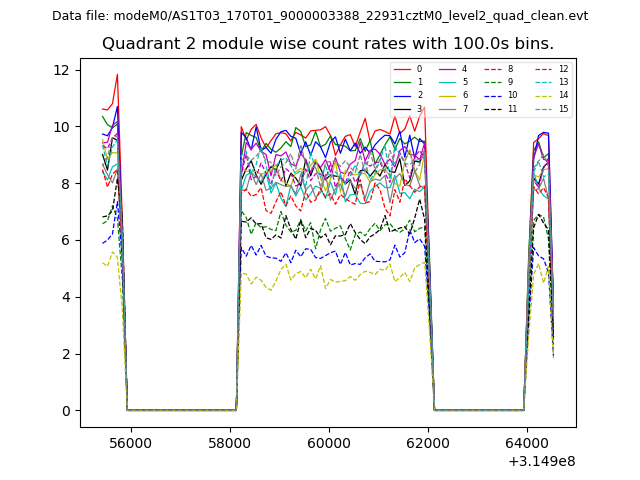
| Module-wise count rates for Quadrant B Data is divided into 100 sec bins |
 |
 |
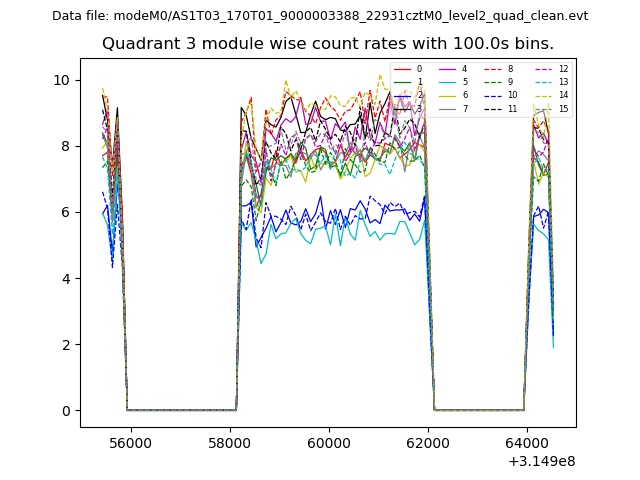
| Module-wise count rates for Quadrant C Data is divided into 100 sec bins |
 |
 |
| Module-wise count rates for Quadrant D Data is divided into 100 sec bins |
 |
 |
| Parameter | Plot |
|---|---|
| CZT HV Monitor | 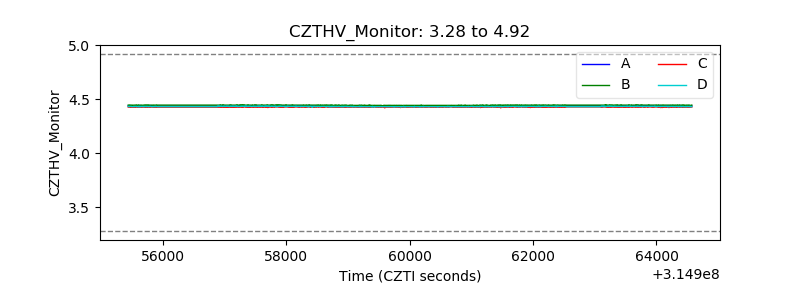 |
| D_VDD | 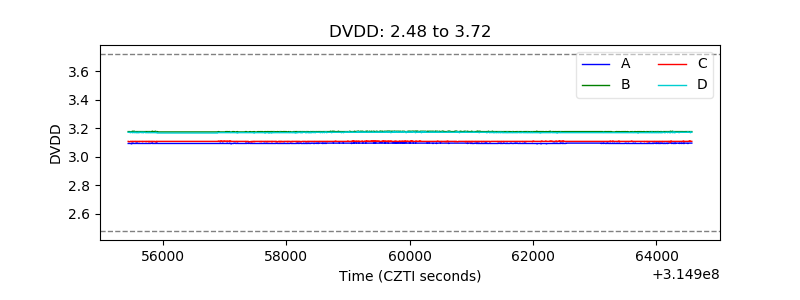 |
| Temperature 1 | 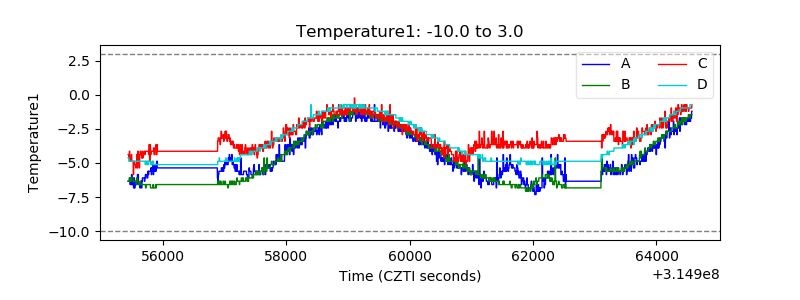 |
| Veto HV Monitor | 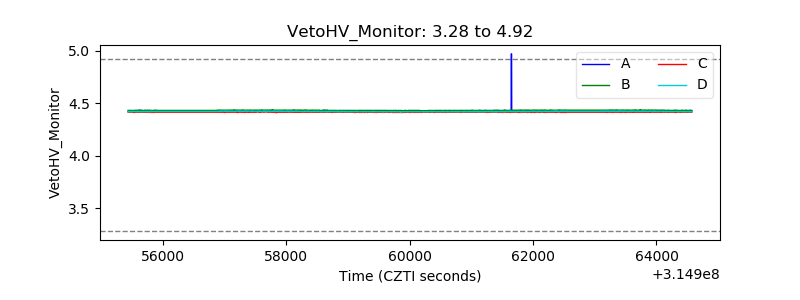 |
| Veto LLD | 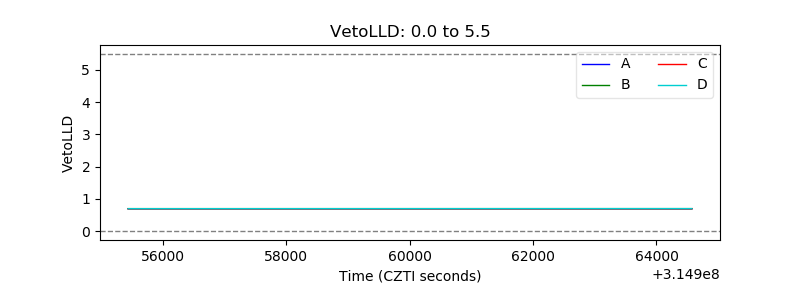 |
| Alpha Counter | 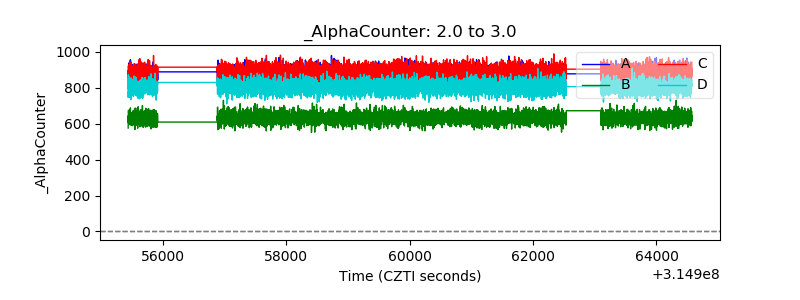 |
| _CPM_Rate | 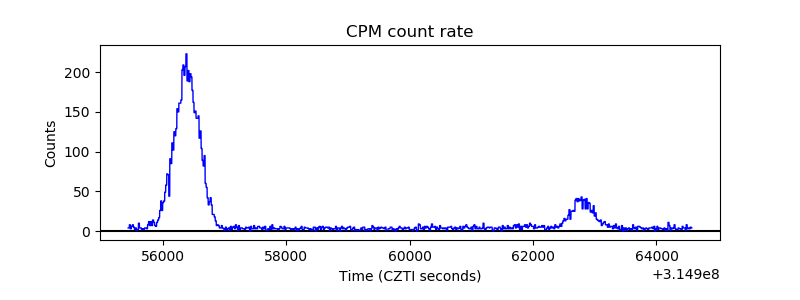 |
| CZT Counter | 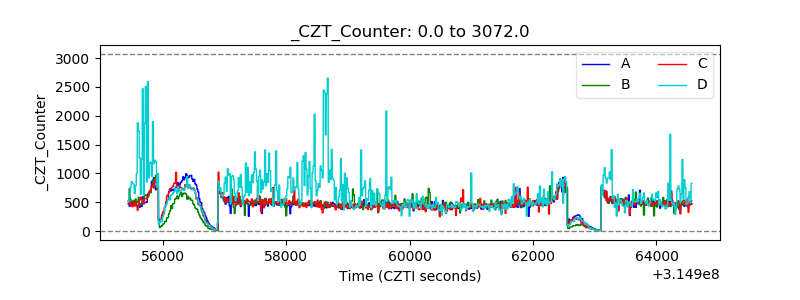 |
| +2.5 Volts monitor | 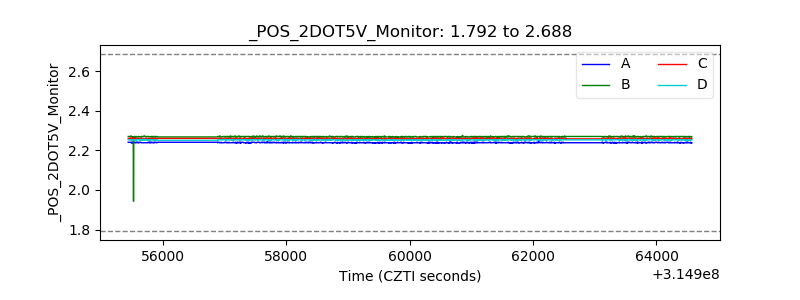 |
| +5 Volts monitor | 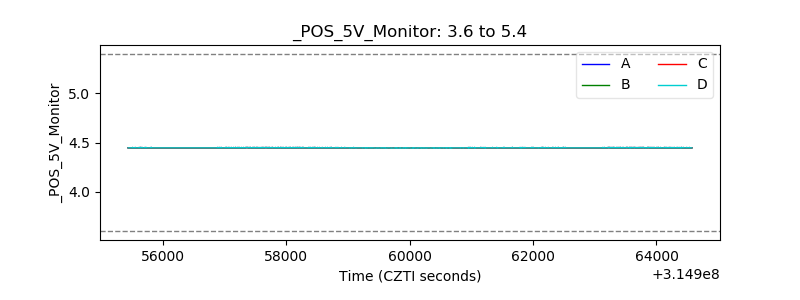 |
| _ROLL_ROT | 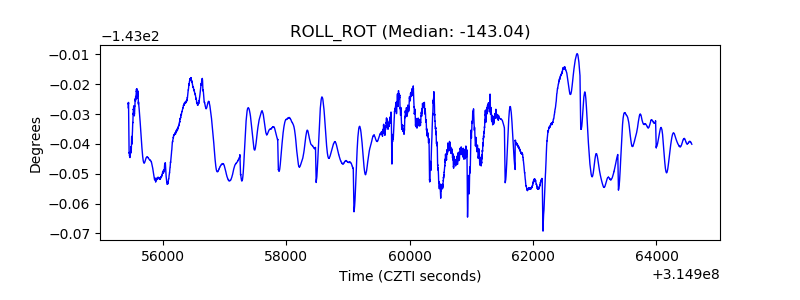 |
| _Roll_DEC | 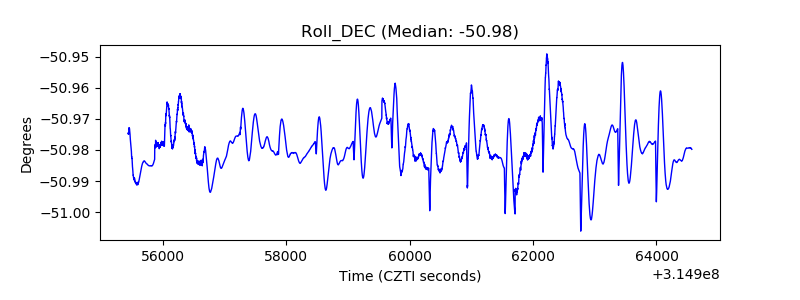 |
| _Roll_RA | 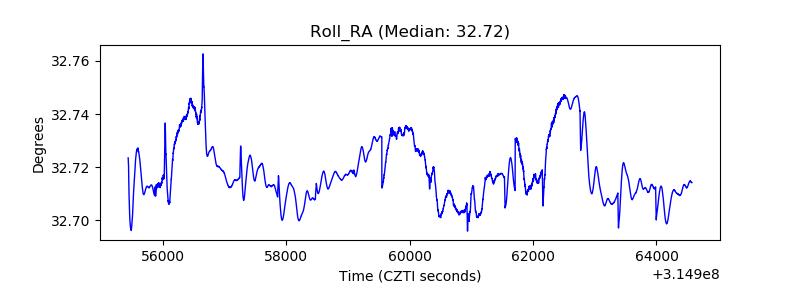 |
| Veto Counter | 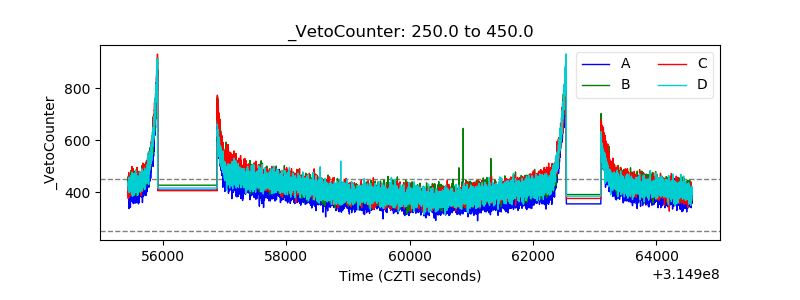 |