| Param | Original file | Final file |
|---|---|---|
| Filename | modeM0/AS1T03_170T01_9000003388_22933cztM0_level2.evt | modeM0/AS1T03_170T01_9000003388_22933cztM0_level2_quad_clean.evt |
| Size (bytes) | 544,374,720 | 95,955,840 |
| Size | 519.2 MB | 91.5 MB |
| Events in quadrant A | 3,193,068 | 627,507 |
| Events in quadrant B | 3,322,540 | 633,905 |
| Events in quadrant C | 3,439,184 | 606,445 |
| Events in quadrant D | 6,071,871 | 565,550 |
| Mode SS | |||
|---|---|---|---|
| Quadrant | BADHDUFLAG | Total packets | Discarded packets |
| A | 0 | 136 | 0 |
| B | 0 | 136 | 0 |
| C | 0 | 136 | 0 |
| D | 0 | 136 | 0 |
| Mode M9 | |||
|---|---|---|---|
| Quadrant | BADHDUFLAG | Total packets | Discarded packets |
| A | 0 | 3 | 0 |
| B | 0 | 3 | 0 |
| C | 0 | 3 | 0 |
| D | 0 | 3 | 0 |
| Mode M0 | |||
|---|---|---|---|
| Quadrant | BADHDUFLAG | Total packets | Discarded packets |
| A | 0 | 14010 | 1 |
| B | 0 | 14223 | 1 |
| C | 0 | 14632 | 1 |
| D | 0 | 22721 | 1 |
| Quadrant | Total seconds | Saturated seconds | Saturation percentage |
|---|---|---|---|
| A | 6782 | 99 | 1.459746% |
| B | 6783 | 124 | 1.828100% |
| C | 6783 | 187 | 2.756892% |
| D | 6783 | 622 | 9.169984% |
Noise dominated data is calculated using 1-second bins in cleaned event files. If a bin has >2000 counts, and if more than 50% of those come from <1% of pixels, then it is considered to be noise-dominated and hence unusable.
| Quadrant | # 1 sec bins | Bins with >0 counts | Bins with >2000 counts | High rate bins dominated by noise | Noise dominated (total time) | Noise dominated (detector-on time) | Marked lightcurve |
|---|---|---|---|---|---|---|---|
| A | 7067 | 6784 | 0 | 0 | 0.00% | 0.00% | 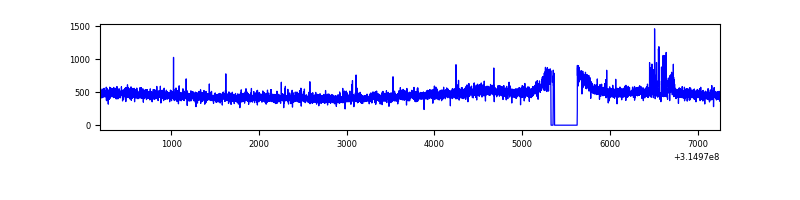 |
| B | 7068 | 6785 | 6 | 6 | 0.08% | 0.09% | 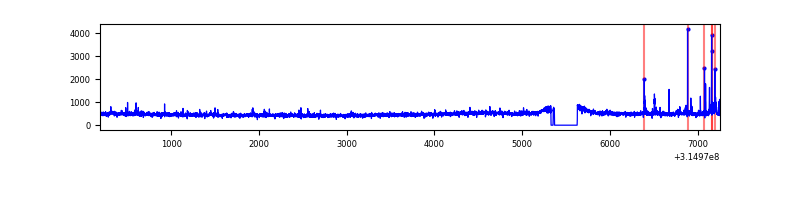 |
| C | 7068 | 6785 | 51 | 51 | 0.72% | 0.75% | 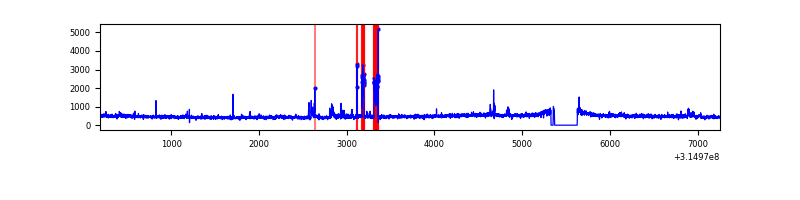 |
| D | 7068 | 6785 | 388 | 388 | 5.49% | 5.72% | 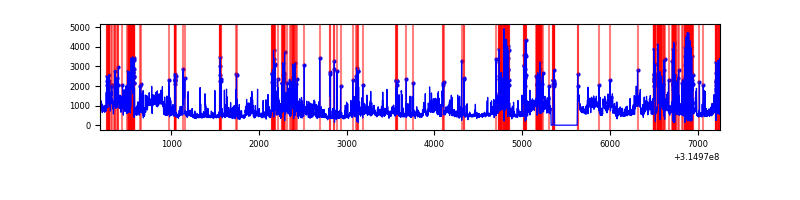 |
Top three noisy pixels from each quadrant. If the there are fewer than three noisy pixels in the level2.evt file, extra rows are filled as -1
| Pixel properties | Quadrant properties | ||||||
|---|---|---|---|---|---|---|---|
| Quadrant | DetID | PixID | Counts | Sigma | Mean | Median | Sigma |
| A | 4 | 2 | 45910 | 274.56 | 816 | 799 | 164.3 |
| A | 13 | 254 | 11826 | 67.11 | 816 | 799 | 164.3 |
| A | 3 | 137 | 7145 | 38.62 | 816 | 799 | 164.3 |
| B | 3 | 64 | 56825 | 360.24 | 809 | 790 | 155.5 |
| B | 0 | 190 | 37279 | 234.58 | 809 | 790 | 155.5 |
| B | 0 | 189 | 21844 | 135.35 | 809 | 790 | 155.5 |
| C | 10 | 9 | 152838 | 837.47 | 774 | 777 | 181.6 |
| C | 14 | 238 | 122834 | 672.22 | 774 | 777 | 181.6 |
| C | 7 | 247 | 87875 | 479.69 | 774 | 777 | 181.6 |
| D | 1 | 52 | 2134970 | 11593.32 | 756 | 735 | 184.1 |
| D | 7 | 238 | 414006 | 2244.92 | 756 | 735 | 184.1 |
| D | 13 | 174 | 280457 | 1519.47 | 756 | 735 | 184.1 |
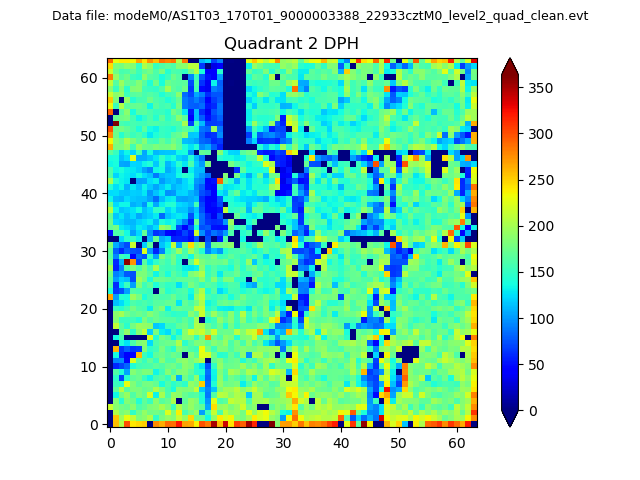
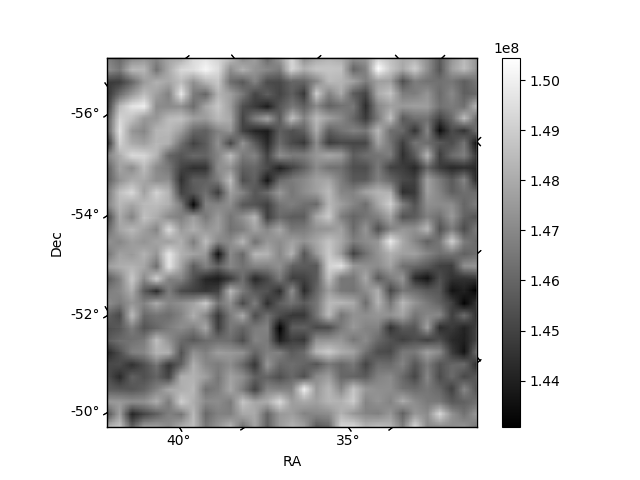
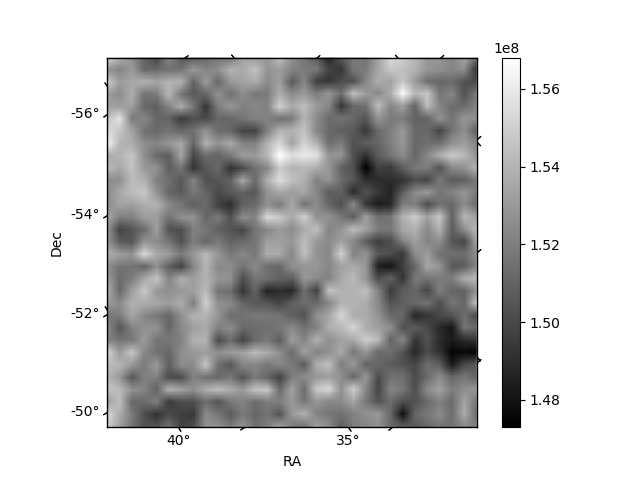
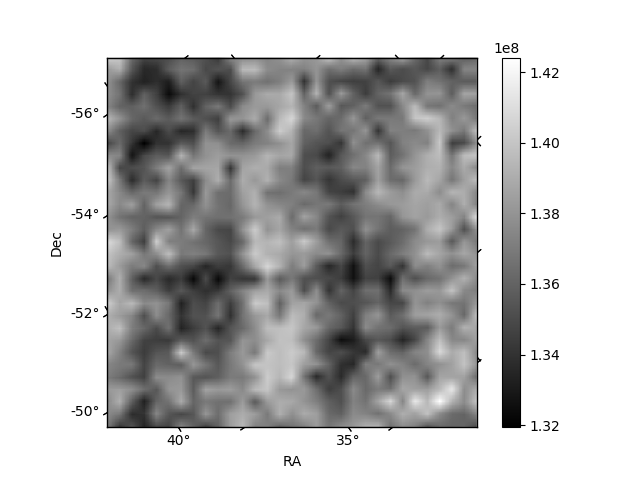
Histogram calculated using DETX and DETY for each event in the final _common_clean file
| Quadrant A |  |
 |
Quadrant B |
|---|---|---|---|
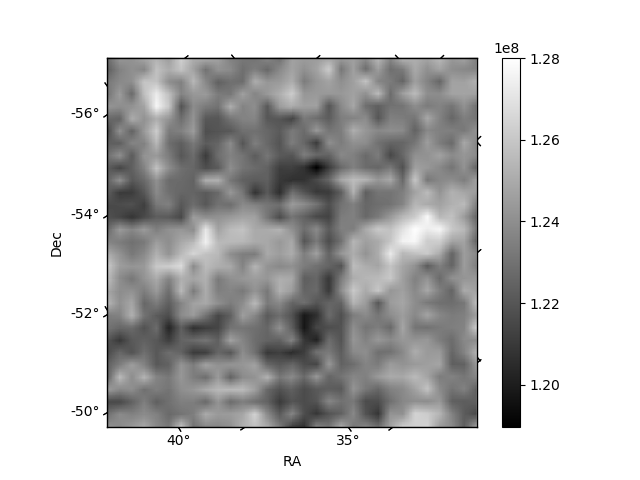
| Quadrant D | 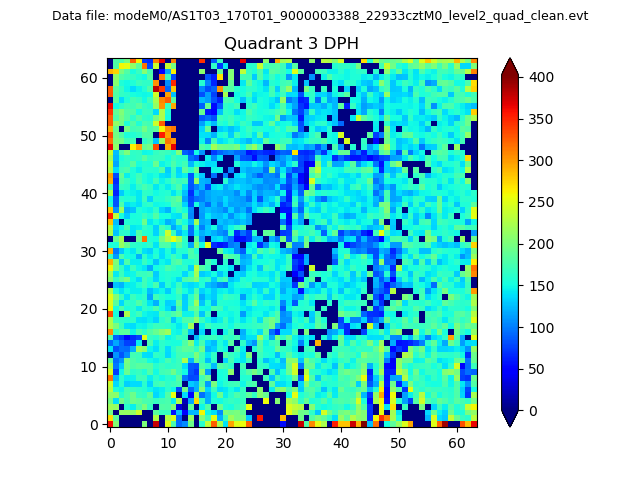 |
 |
Quadrant C |
| Plot type | Count rate plots | Images |
|---|---|---|
| Comparison with Poisson distribution Blue bars denote a histogram of data divided into 1 sec bins. Red curve is a Poisson curve with rate = median count rate of data. |
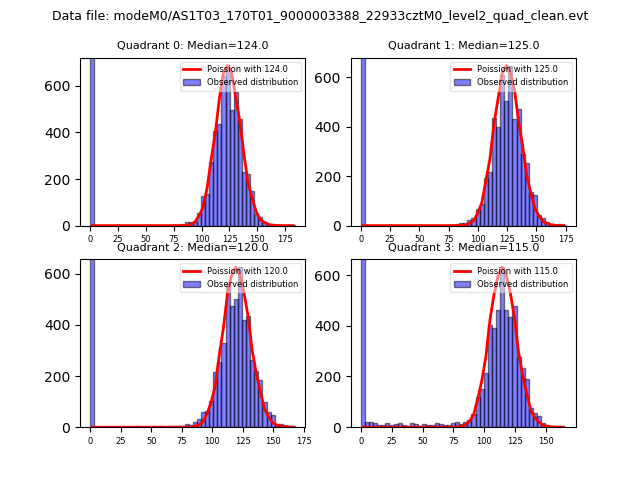 |
 |
| Quadrant-wise count rates Data is divided into 100 sec bins |
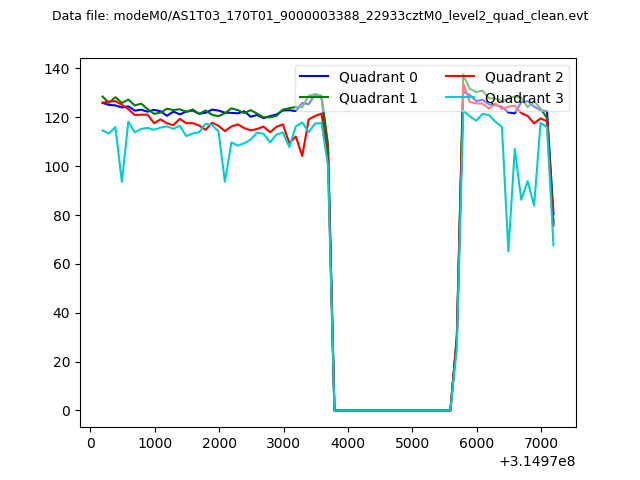 |
|
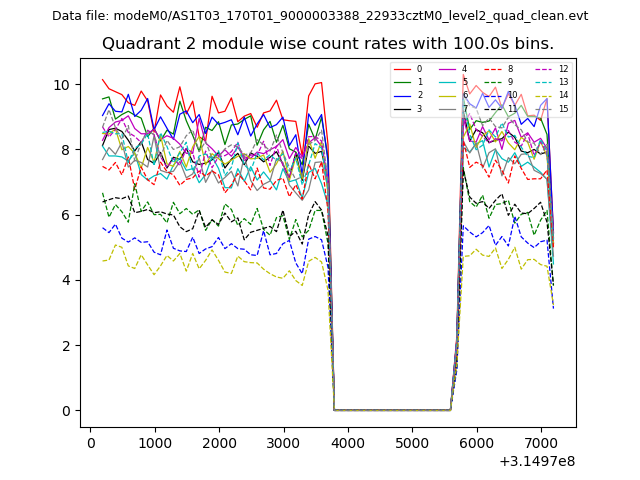
| Module-wise count rates for Quadrant A Data is divided into 100 sec bins |
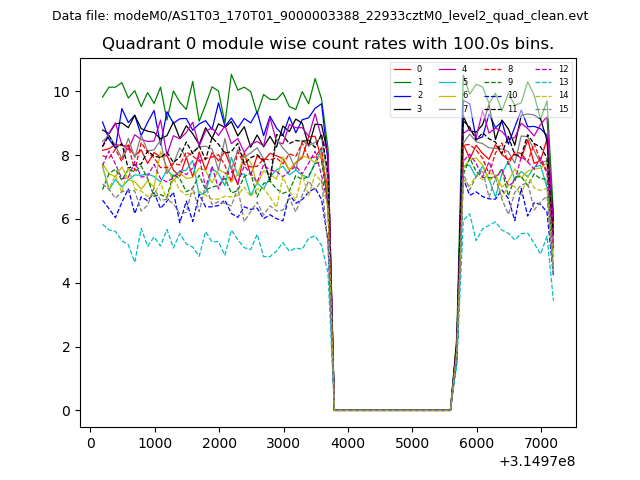 |
 |
| Module-wise count rates for Quadrant B Data is divided into 100 sec bins |
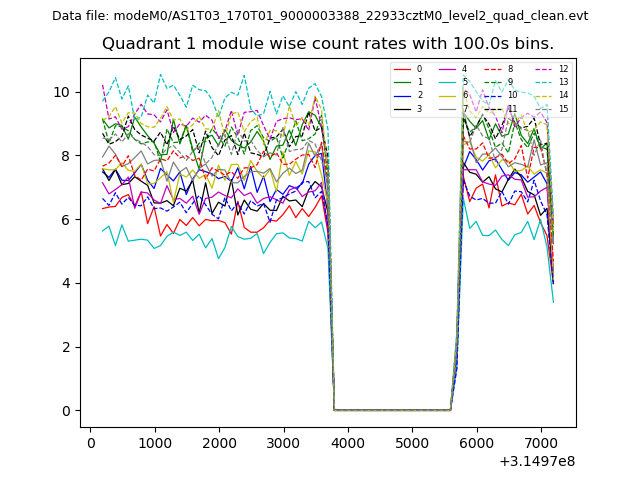 |
 |
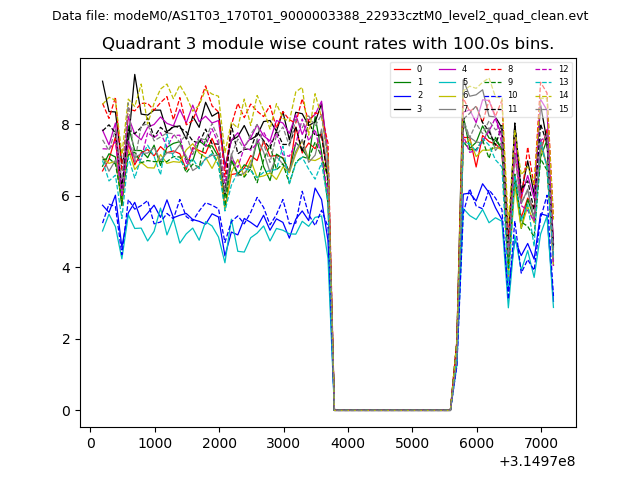
| Module-wise count rates for Quadrant C Data is divided into 100 sec bins |
 |
 |
| Module-wise count rates for Quadrant D Data is divided into 100 sec bins |
 |
 |
| Parameter | Plot |
|---|---|
| CZT HV Monitor | 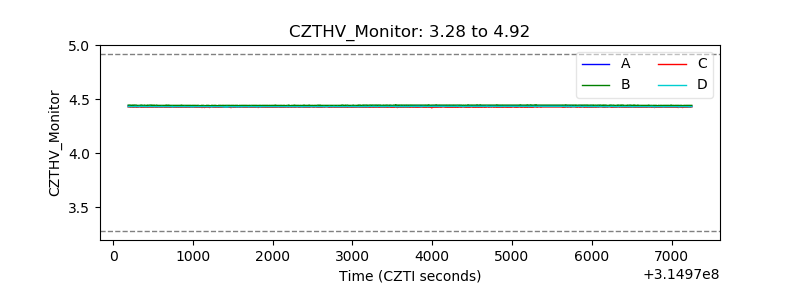 |
| D_VDD | 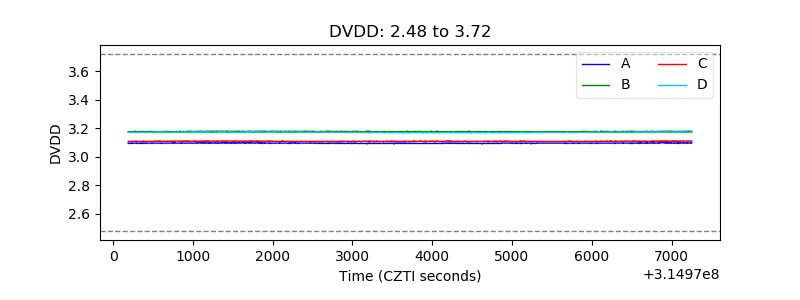 |
| Temperature 1 | 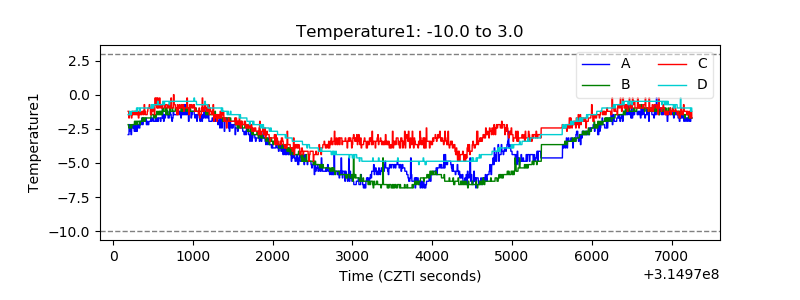 |
| Veto HV Monitor | 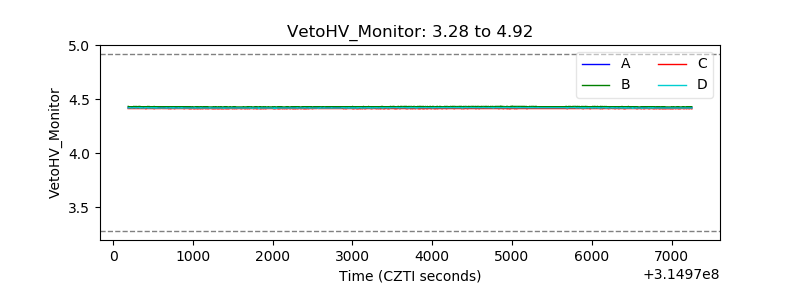 |
| Veto LLD | 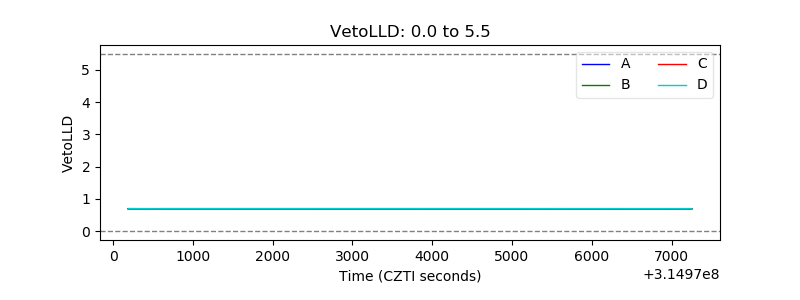 |
| Alpha Counter | 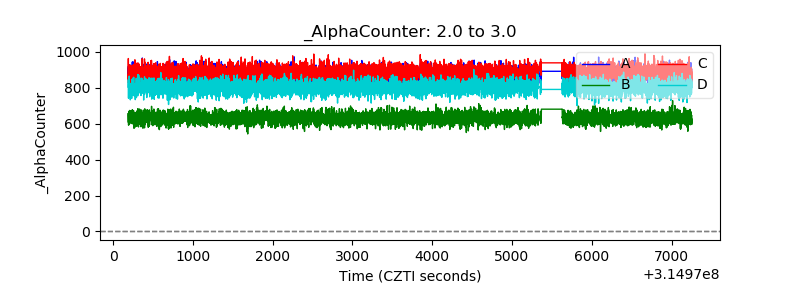 |
| _CPM_Rate |  |
| CZT Counter | 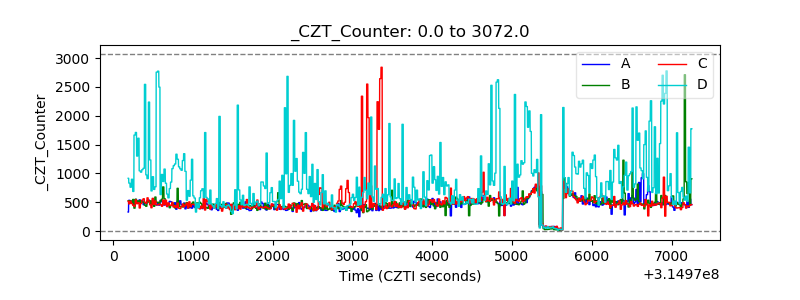 |
| +2.5 Volts monitor | 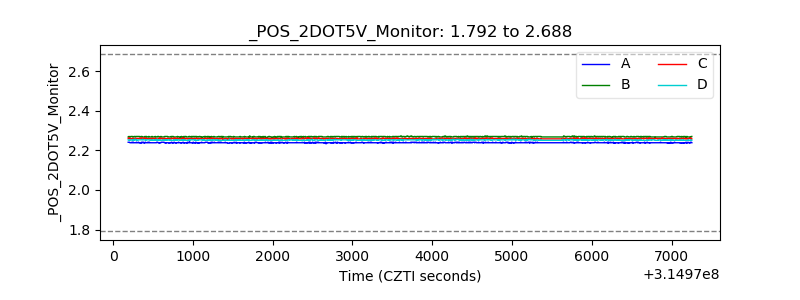 |
| +5 Volts monitor | 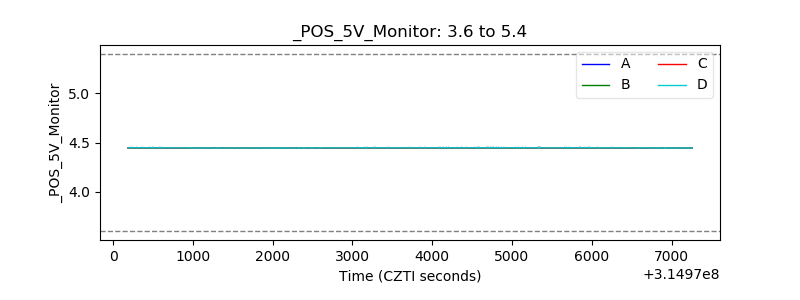 |
| _ROLL_ROT | 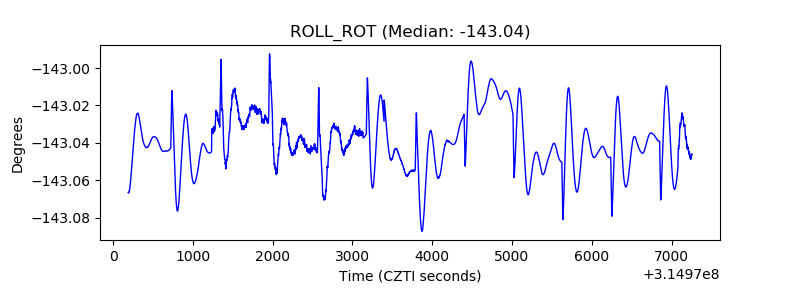 |
| _Roll_DEC | 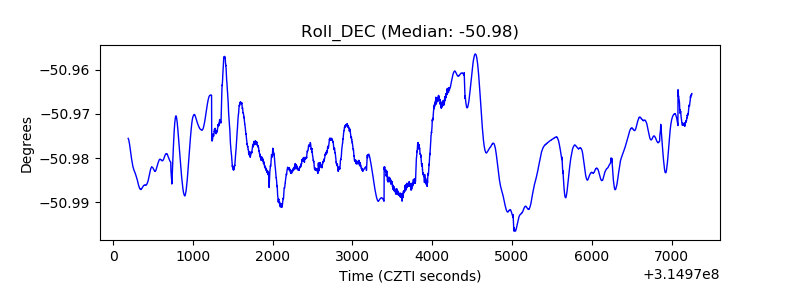 |
| _Roll_RA | 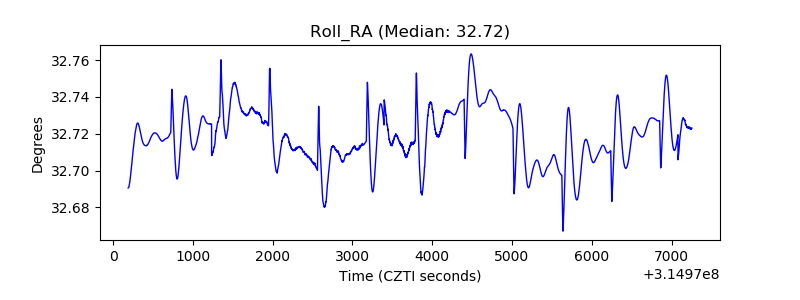 |
| Veto Counter | 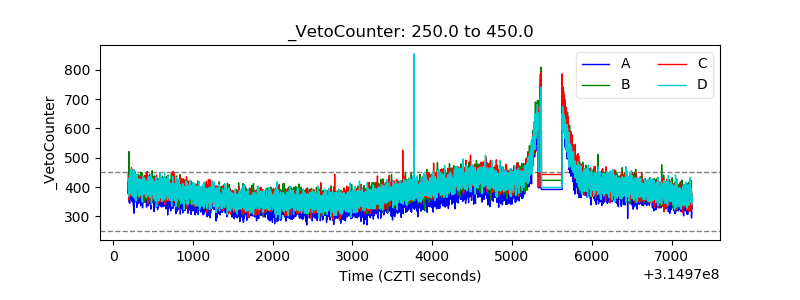 |