| Param | Original file | Final file |
|---|---|---|
| Filename | modeM0/AS1A08_009T01_9000003390_22937cztM0_level2.evt | modeM0/AS1A08_009T01_9000003390_22937cztM0_level2_quad_clean.evt |
| Size (bytes) | 508,682,880 | 94,348,800 |
| Size | 485.1 MB | 90.0 MB |
| Events in quadrant A | 3,135,669 | 606,957 |
| Events in quadrant B | 3,247,767 | 615,362 |
| Events in quadrant C | 3,239,692 | 594,401 |
| Events in quadrant D | 5,326,968 | 572,603 |
| Mode M9 | |||
|---|---|---|---|
| Quadrant | BADHDUFLAG | Total packets | Discarded packets |
| A | 0 | 17 | 0 |
| B | 0 | 18 | 0 |
| C | 0 | 18 | 0 |
| D | 0 | 18 | 0 |
| Mode SS | |||
|---|---|---|---|
| Quadrant | BADHDUFLAG | Total packets | Discarded packets |
| A | 0 | 136 | 0 |
| B | 0 | 136 | 0 |
| C | 0 | 136 | 0 |
| D | 0 | 136 | 0 |
| Mode M0 | |||
|---|---|---|---|
| Quadrant | BADHDUFLAG | Total packets | Discarded packets |
| A | 0 | 13785 | 1 |
| B | 0 | 14099 | 1 |
| C | 0 | 13986 | 1 |
| D | 0 | 20509 | 1 |
| Quadrant | Total seconds | Saturated seconds | Saturation percentage |
|---|---|---|---|
| A | 6712 | 30 | 0.446961% |
| B | 6712 | 43 | 0.640644% |
| C | 6712 | 80 | 1.191895% |
| D | 6712 | 410 | 6.108462% |
Noise dominated data is calculated using 1-second bins in cleaned event files. If a bin has >2000 counts, and if more than 50% of those come from <1% of pixels, then it is considered to be noise-dominated and hence unusable.
| Quadrant | # 1 sec bins | Bins with >0 counts | Bins with >2000 counts | High rate bins dominated by noise | Noise dominated (total time) | Noise dominated (detector-on time) | Marked lightcurve |
|---|---|---|---|---|---|---|---|
| A | 7712 | 6713 | 0 | 0 | 0.00% | 0.00% | 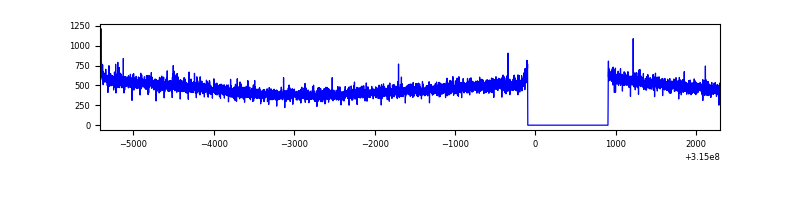 |
| B | 7712 | 6713 | 1 | 1 | 0.01% | 0.01% | 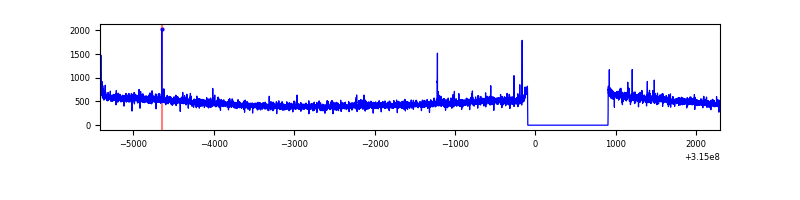 |
| C | 7712 | 6713 | 0 | 0 | 0.00% | 0.00% | 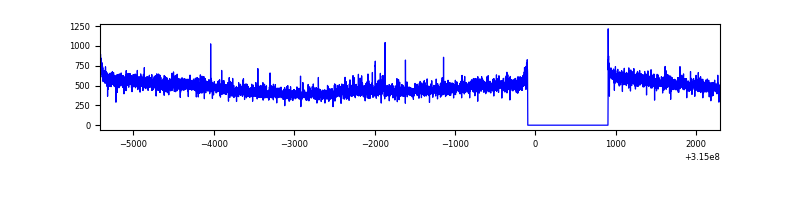 |
| D | 7712 | 6713 | 239 | 239 | 3.10% | 3.56% | 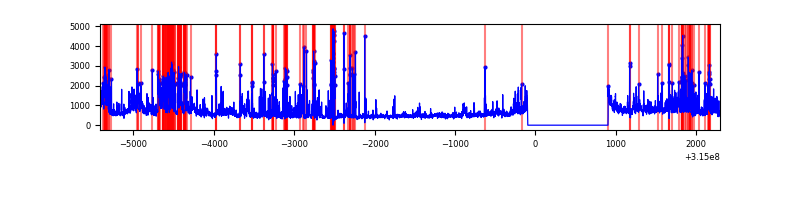 |
Top three noisy pixels from each quadrant. If the there are fewer than three noisy pixels in the level2.evt file, extra rows are filled as -1
| Pixel properties | Quadrant properties | ||||||
|---|---|---|---|---|---|---|---|
| Quadrant | DetID | PixID | Counts | Sigma | Mean | Median | Sigma |
| A | 13 | 254 | 10952 | 62.18 | 811 | 793 | 163.4 |
| A | 3 | 137 | 7047 | 38.28 | 811 | 793 | 163.4 |
| A | 13 | 170 | 6938 | 37.61 | 811 | 793 | 163.4 |
| B | 12 | 111 | 18576 | 114.96 | 813 | 791 | 154.7 |
| B | 0 | 197 | 16894 | 104.09 | 813 | 791 | 154.7 |
| B | 11 | 111 | 16394 | 100.86 | 813 | 791 | 154.7 |
| C | 14 | 238 | 123371 | 662.53 | 789 | 794 | 185.0 |
| C | 0 | 239 | 21020 | 109.32 | 789 | 794 | 185.0 |
| C | 7 | 247 | 13100 | 66.51 | 789 | 794 | 185.0 |
| D | 1 | 52 | 1475743 | 7731.79 | 782 | 760 | 190.8 |
| D | 7 | 238 | 432237 | 2261.78 | 782 | 760 | 190.8 |
| D | 13 | 153 | 176143 | 919.35 | 782 | 760 | 190.8 |
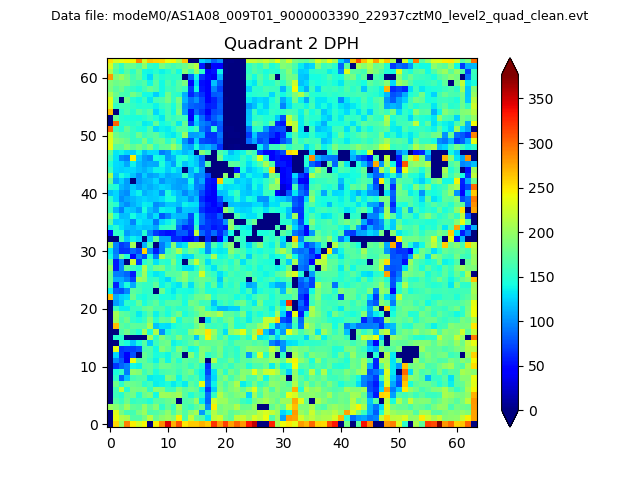
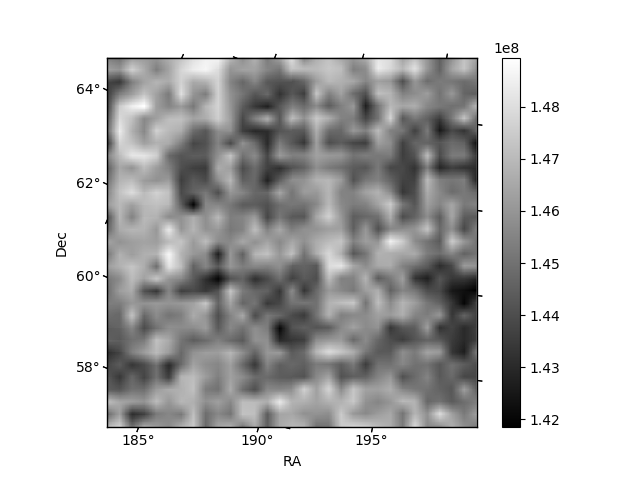
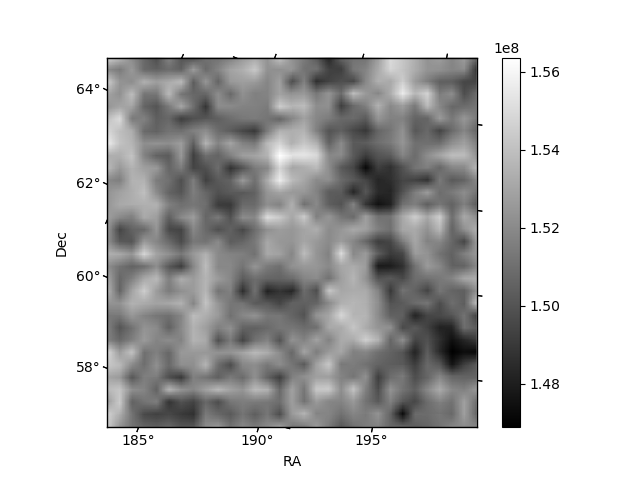
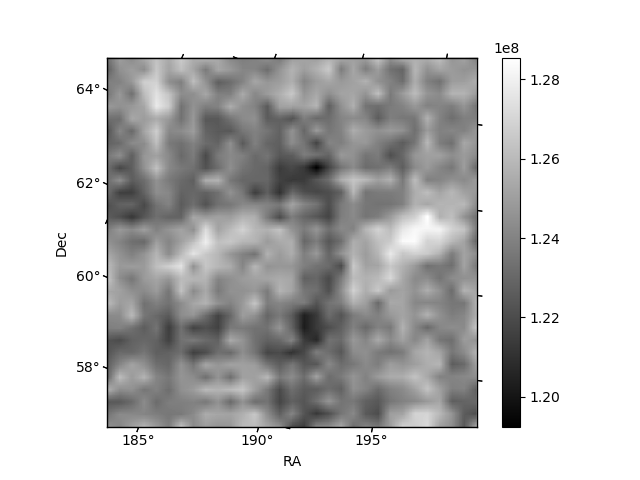
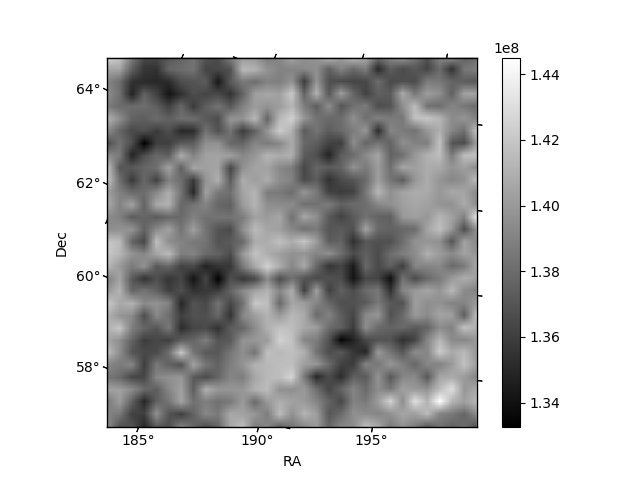
Histogram calculated using DETX and DETY for each event in the final _common_clean file
| Quadrant A | 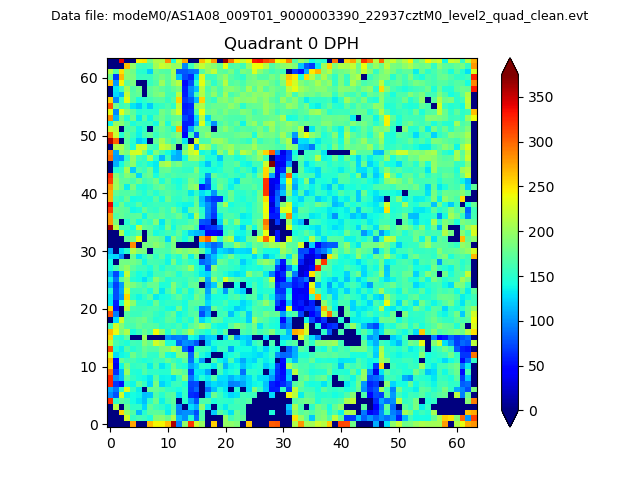 |
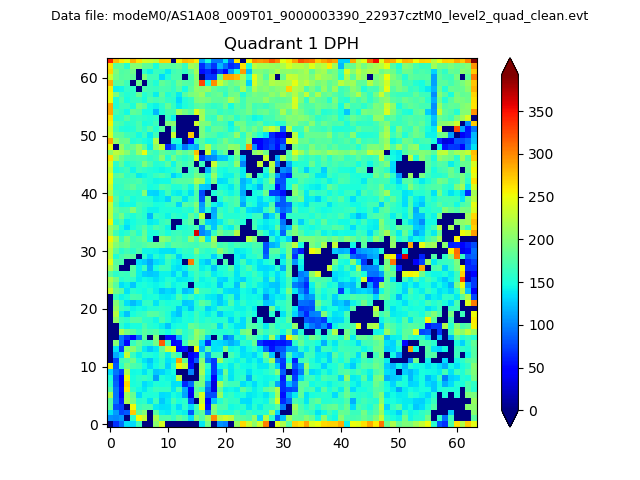 |
Quadrant B |
|---|---|---|---|
| Quadrant D | 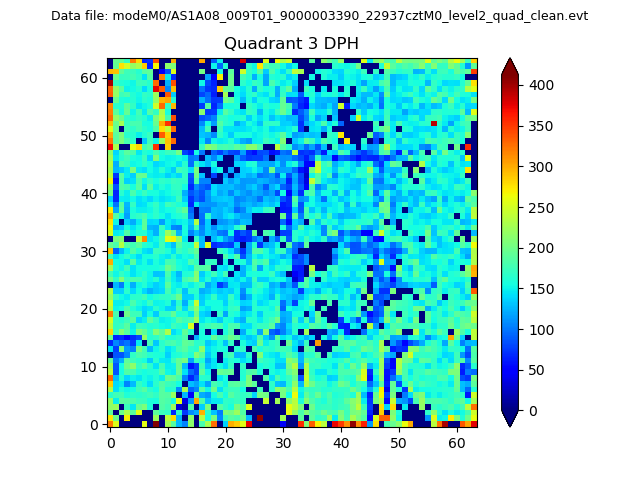 |
 |
Quadrant C |
| Plot type | Count rate plots | Images |
|---|---|---|
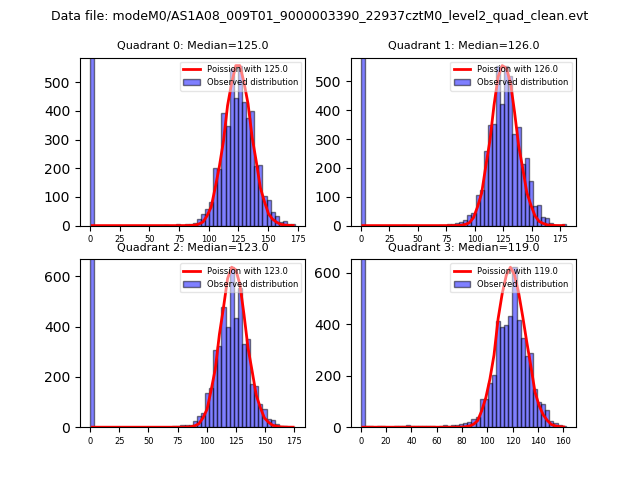
| Comparison with Poisson distribution Blue bars denote a histogram of data divided into 1 sec bins. Red curve is a Poisson curve with rate = median count rate of data. |
 |
 |
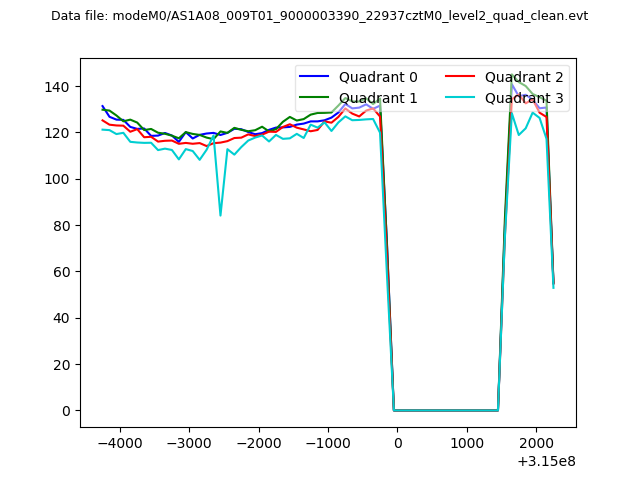
| Quadrant-wise count rates Data is divided into 100 sec bins |
 |
|
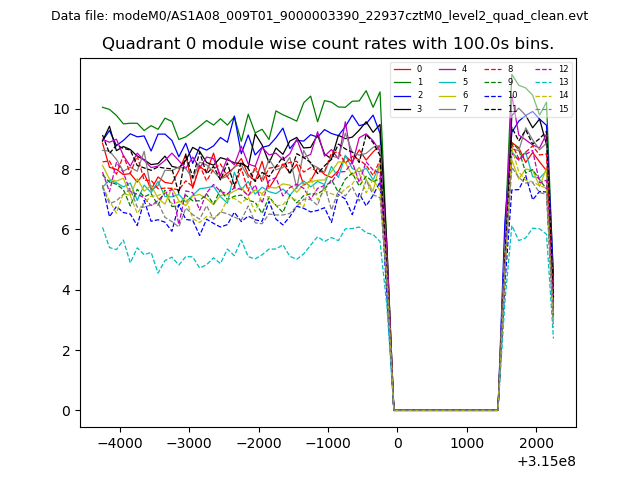
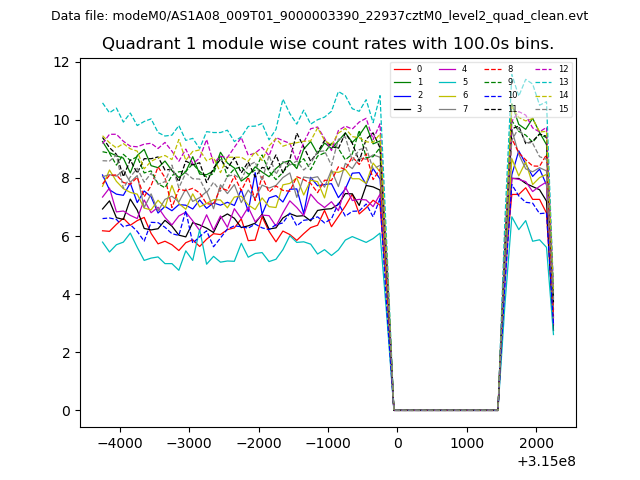
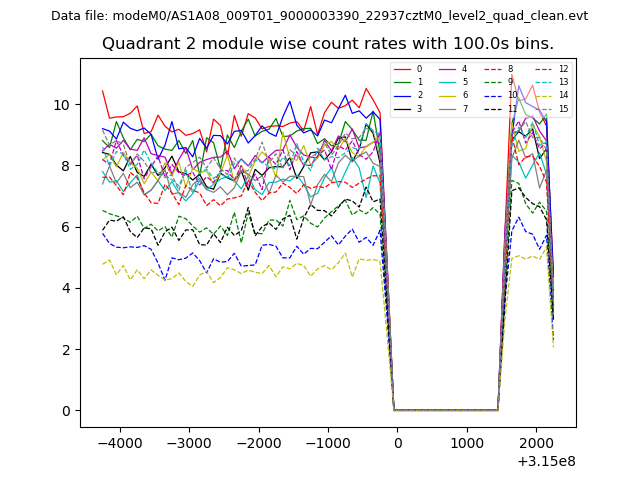
| Module-wise count rates for Quadrant A Data is divided into 100 sec bins |
 |
 |
| Module-wise count rates for Quadrant B Data is divided into 100 sec bins |
 |
 |
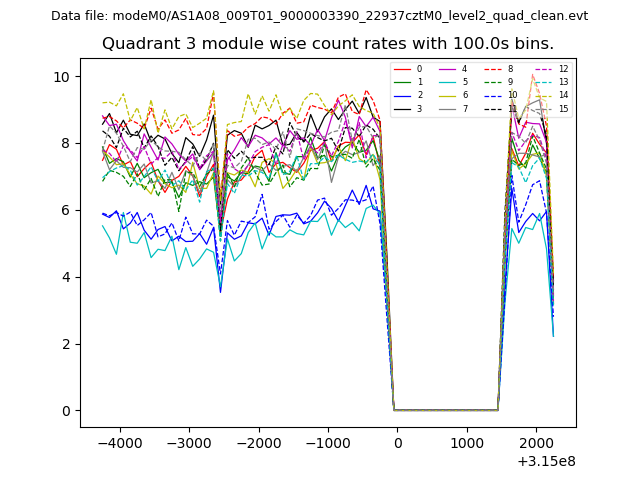
| Module-wise count rates for Quadrant C Data is divided into 100 sec bins |
 |
 |
| Module-wise count rates for Quadrant D Data is divided into 100 sec bins |
 |
 |
| Parameter | Plot |
|---|---|
| CZT HV Monitor | 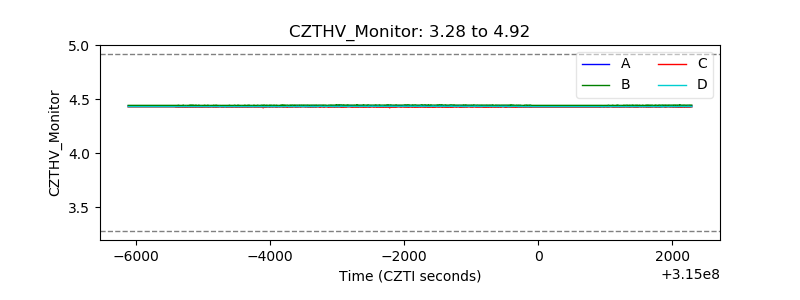 |
| D_VDD | 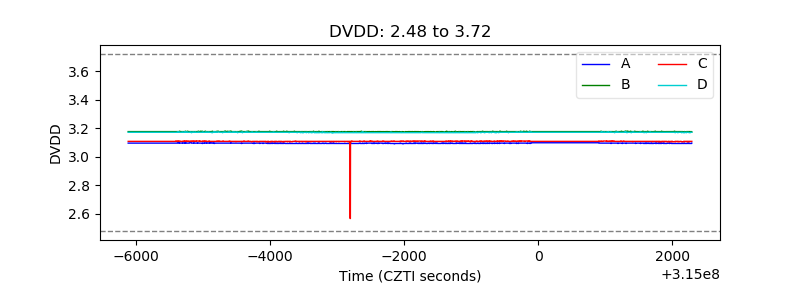 |
| Temperature 1 | 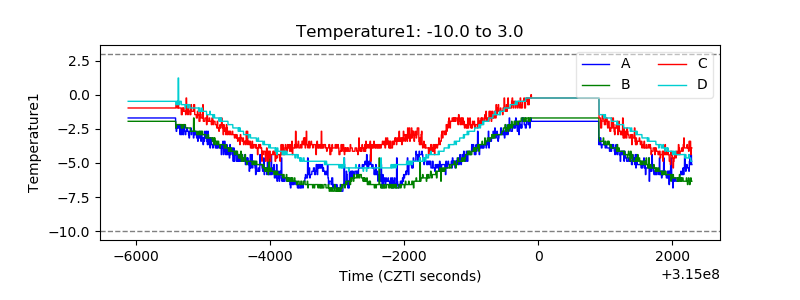 |
| Veto HV Monitor | 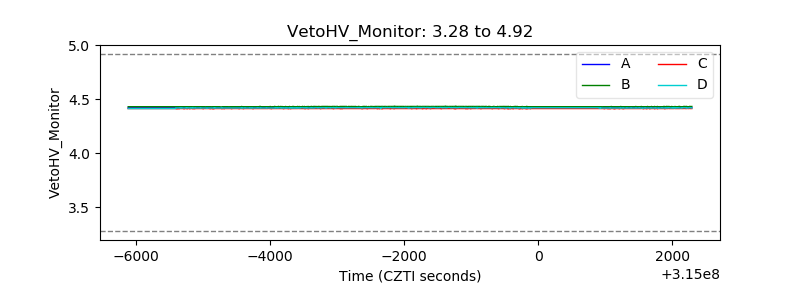 |
| Veto LLD | 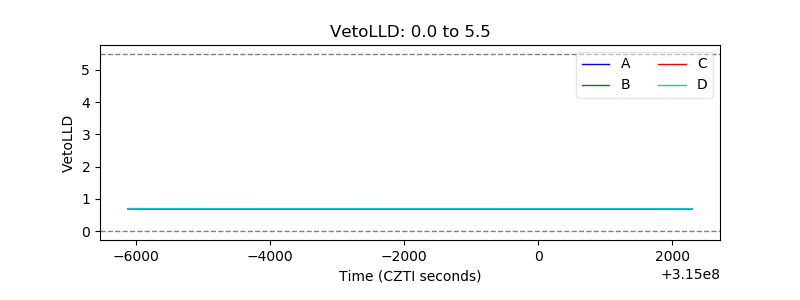 |
| Alpha Counter | 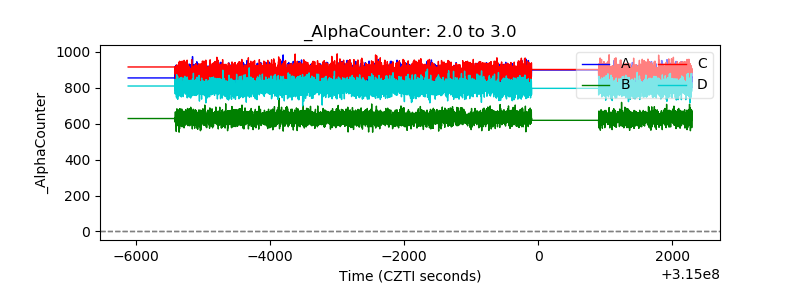 |
| _CPM_Rate | 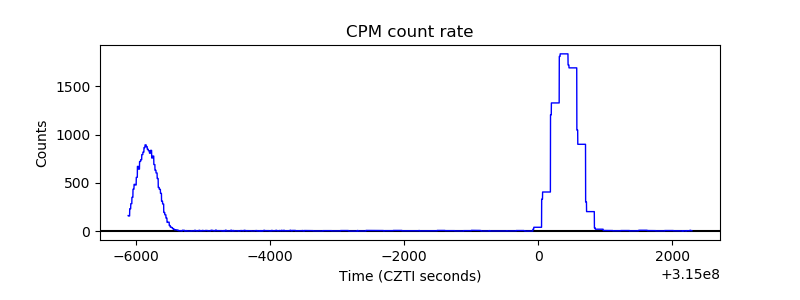 |
| CZT Counter | 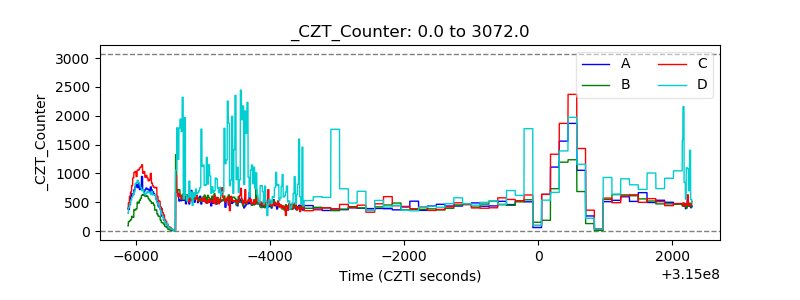 |
| +2.5 Volts monitor | 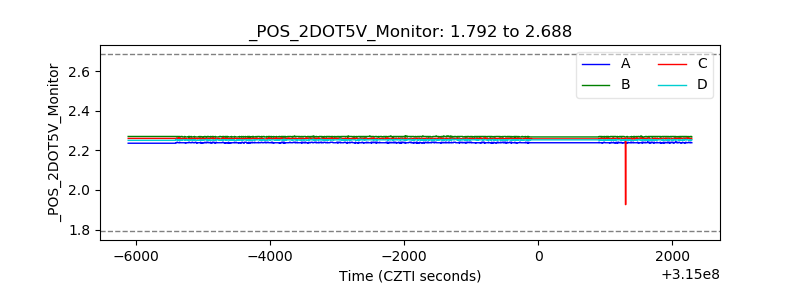 |
| +5 Volts monitor | 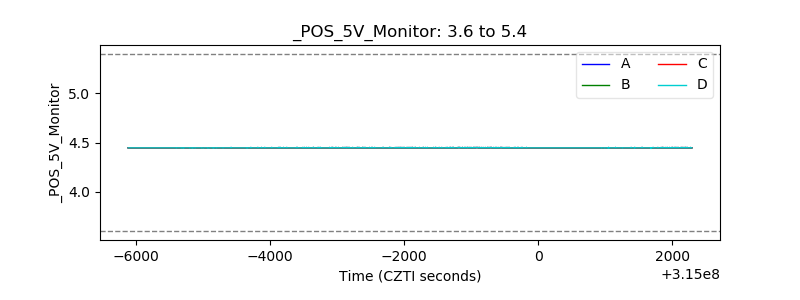 |
| _ROLL_ROT | 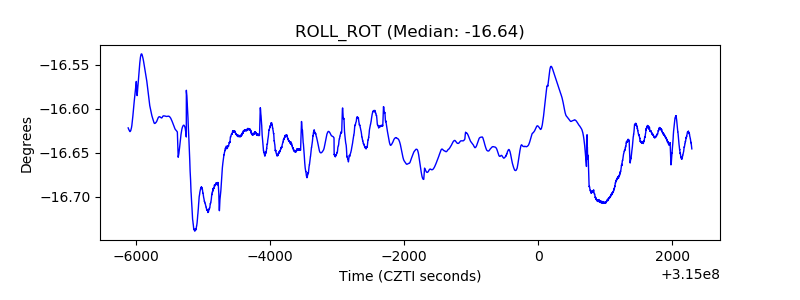 |
| _Roll_DEC | 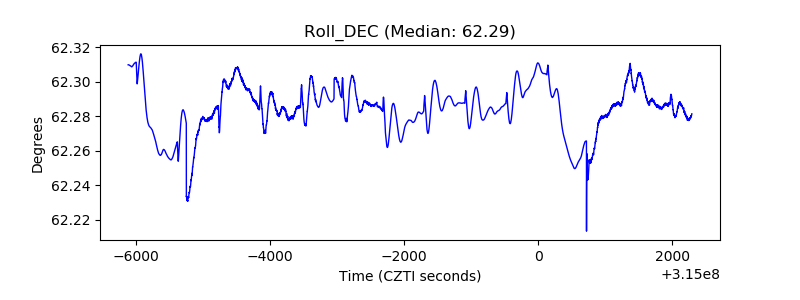 |
| _Roll_RA | 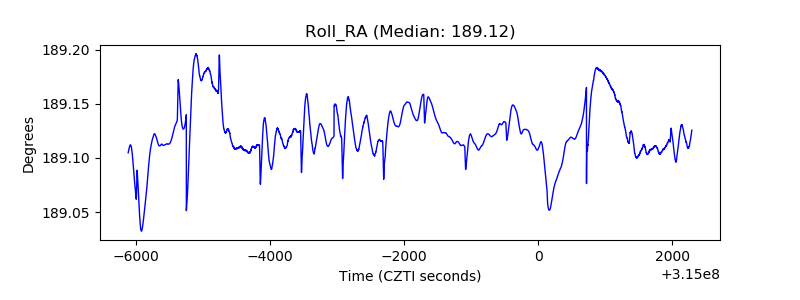 |
| Veto Counter | 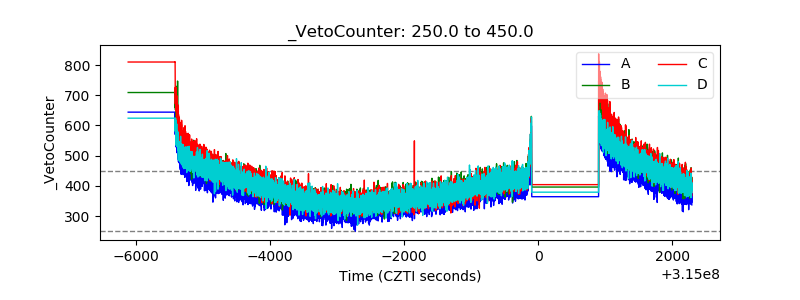 |