| Param | Original file | Final file |
|---|---|---|
| Filename | modeM0/AS1A08_009T01_9000003390_22941cztM0_level2.evt | modeM0/AS1A08_009T01_9000003390_22941cztM0_level2_quad_clean.evt |
| Size (bytes) | 460,710,720 | 115,876,800 |
| Size | 439.4 MB | 110.5 MB |
| Events in quadrant A | 3,006,554 | 780,911 |
| Events in quadrant B | 3,112,731 | 809,326 |
| Events in quadrant C | 3,188,682 | 762,818 |
| Events in quadrant D | 4,225,023 | 725,092 |
| Mode M9 | |||
|---|---|---|---|
| Quadrant | BADHDUFLAG | Total packets | Discarded packets |
| A | 0 | 20 | 0 |
| B | 0 | 21 | 0 |
| C | 0 | 21 | 0 |
| D | 0 | 21 | 0 |
| Mode SS | |||
|---|---|---|---|
| Quadrant | BADHDUFLAG | Total packets | Discarded packets |
| A | 0 | 126 | 0 |
| B | 0 | 126 | 0 |
| C | 0 | 126 | 0 |
| D | 0 | 126 | 0 |
| Mode M0 | |||
|---|---|---|---|
| Quadrant | BADHDUFLAG | Total packets | Discarded packets |
| A | 0 | 12900 | 2 |
| B | 0 | 13197 | 2 |
| C | 0 | 13458 | 2 |
| D | 0 | 16886 | 2 |
| Quadrant | Total seconds | Saturated seconds | Saturation percentage |
|---|---|---|---|
| A | 6180 | 10 | 0.161812% |
| B | 6180 | 11 | 0.177994% |
| C | 6180 | 94 | 1.521036% |
| D | 6180 | 218 | 3.527508% |
Noise dominated data is calculated using 1-second bins in cleaned event files. If a bin has >2000 counts, and if more than 50% of those come from <1% of pixels, then it is considered to be noise-dominated and hence unusable.
| Quadrant | # 1 sec bins | Bins with >0 counts | Bins with >2000 counts | High rate bins dominated by noise | Noise dominated (total time) | Noise dominated (detector-on time) | Marked lightcurve |
|---|---|---|---|---|---|---|---|
| A | 7500 | 6181 | 0 | 0 | 0.00% | 0.00% | 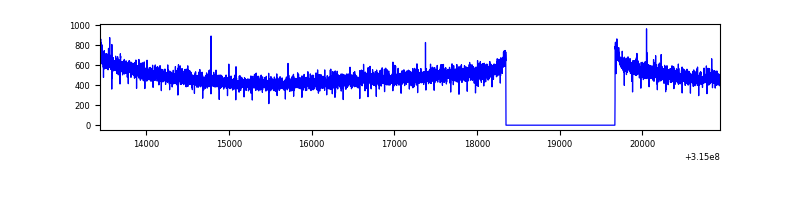 |
| B | 7500 | 6181 | 1 | 1 | 0.01% | 0.02% | 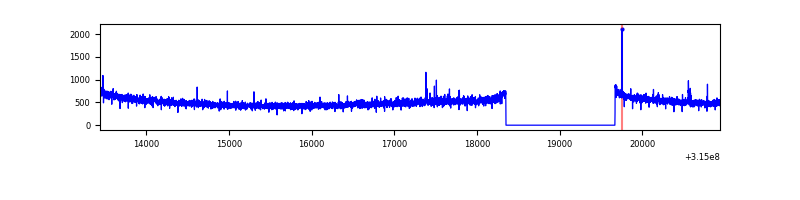 |
| C | 7500 | 6181 | 25 | 25 | 0.33% | 0.40% | 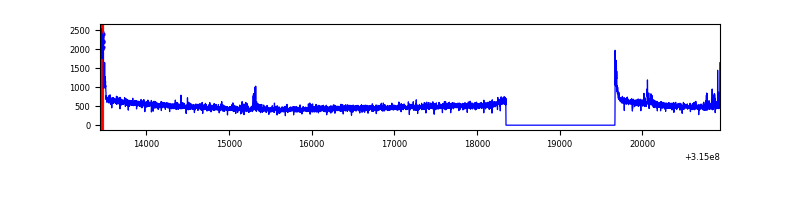 |
| D | 7500 | 6181 | 156 | 156 | 2.08% | 2.52% | 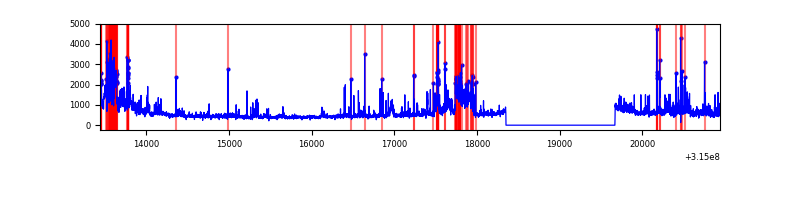 |
Top three noisy pixels from each quadrant. If the there are fewer than three noisy pixels in the level2.evt file, extra rows are filled as -1
| Pixel properties | Quadrant properties | ||||||
|---|---|---|---|---|---|---|---|
| Quadrant | DetID | PixID | Counts | Sigma | Mean | Median | Sigma |
| A | 13 | 254 | 9881 | 59.04 | 779 | 765 | 154.4 |
| A | 0 | 226 | 6739 | 38.69 | 779 | 765 | 154.4 |
| A | 3 | 137 | 6255 | 35.56 | 779 | 765 | 154.4 |
| B | 12 | 111 | 16924 | 112.03 | 785 | 771 | 144.2 |
| B | 0 | 189 | 15795 | 104.2 | 785 | 771 | 144.2 |
| B | 11 | 111 | 14861 | 97.72 | 785 | 771 | 144.2 |
| C | 14 | 238 | 123082 | 709.89 | 749 | 753 | 172.3 |
| C | 0 | 10 | 105810 | 609.66 | 749 | 753 | 172.3 |
| C | 7 | 247 | 29870 | 168.97 | 749 | 753 | 172.3 |
| D | 13 | 172 | 585266 | 3275.22 | 742 | 723 | 178.5 |
| D | 1 | 52 | 352421 | 1970.58 | 742 | 723 | 178.5 |
| D | 7 | 238 | 191286 | 1067.73 | 742 | 723 | 178.5 |
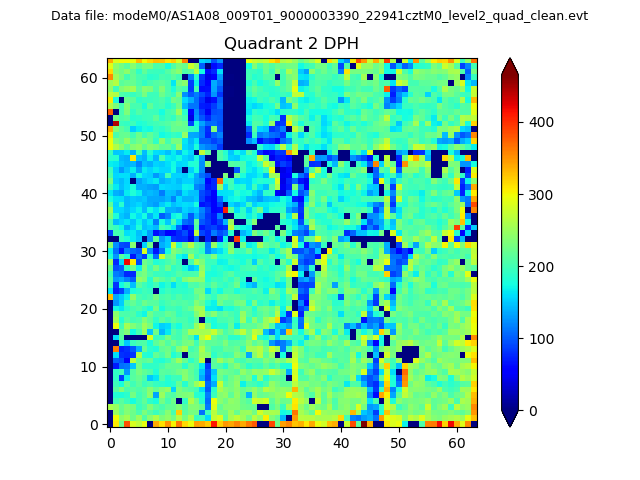
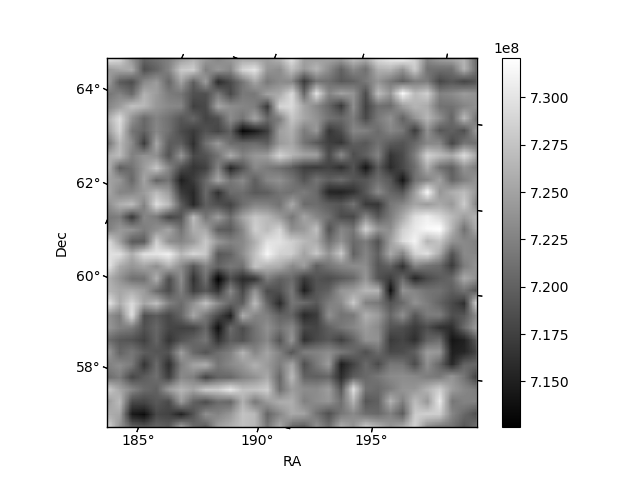
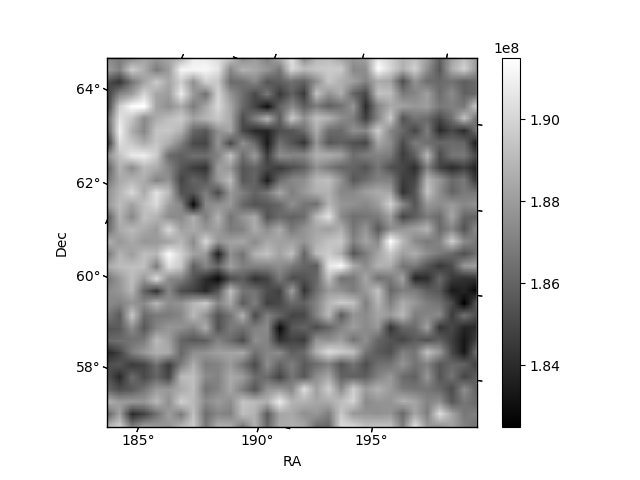
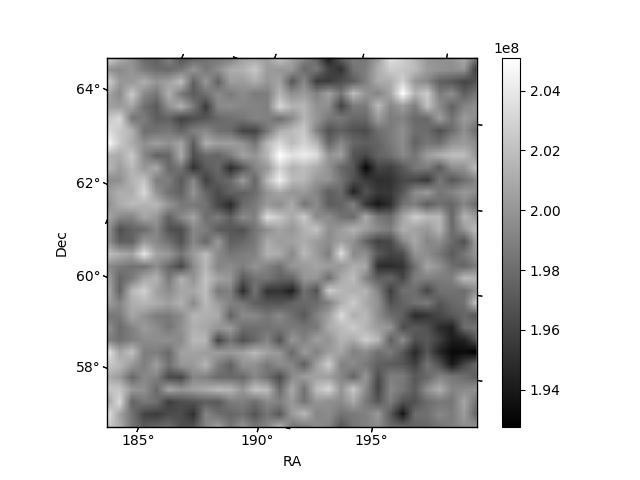
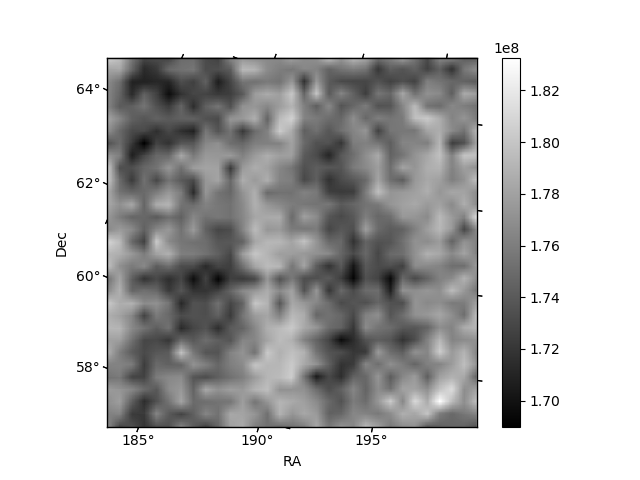
Histogram calculated using DETX and DETY for each event in the final _common_clean file
| Quadrant A | 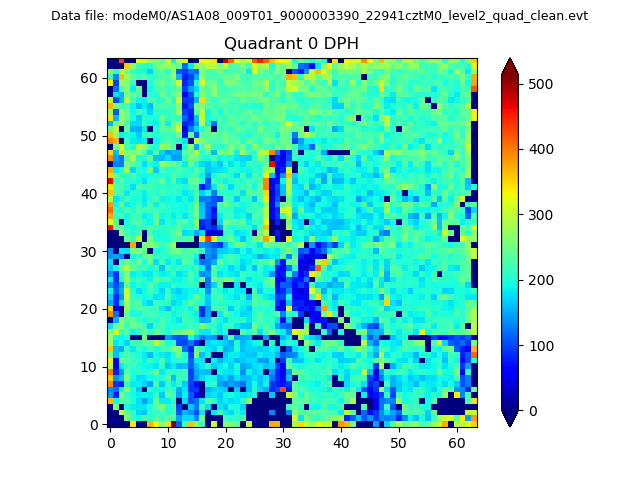 |
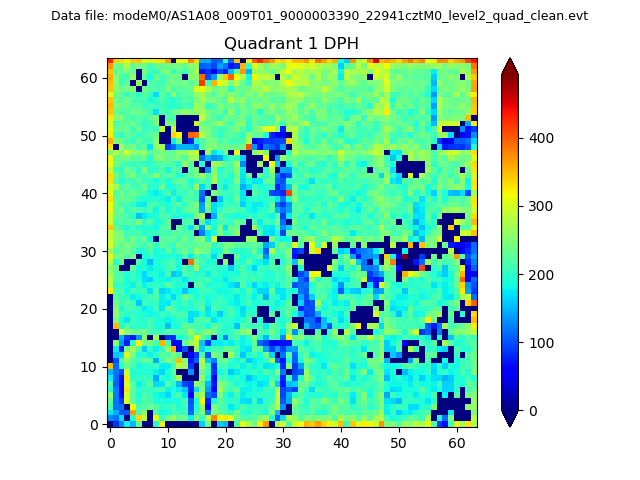 |
Quadrant B |
|---|---|---|---|
| Quadrant D | 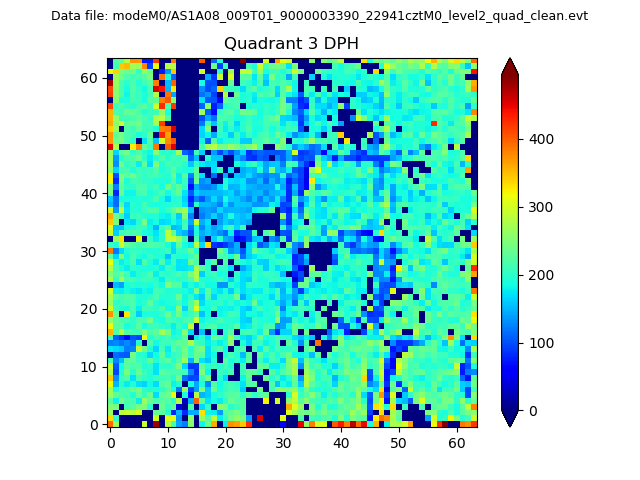 |
 |
Quadrant C |
| Plot type | Count rate plots | Images |
|---|---|---|
| Comparison with Poisson distribution Blue bars denote a histogram of data divided into 1 sec bins. Red curve is a Poisson curve with rate = median count rate of data. |
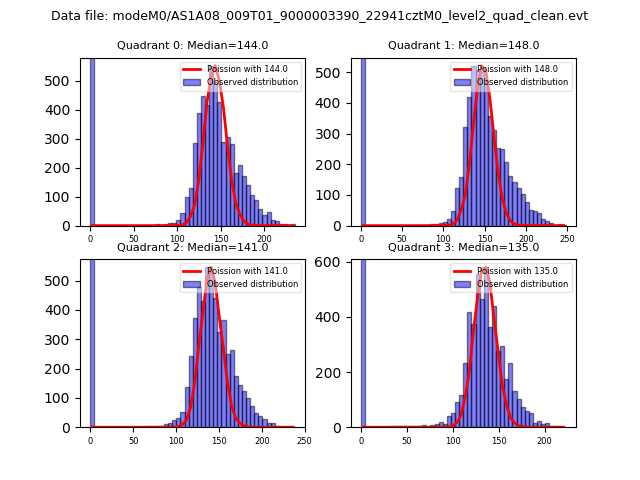 |
 |
| Quadrant-wise count rates Data is divided into 100 sec bins |
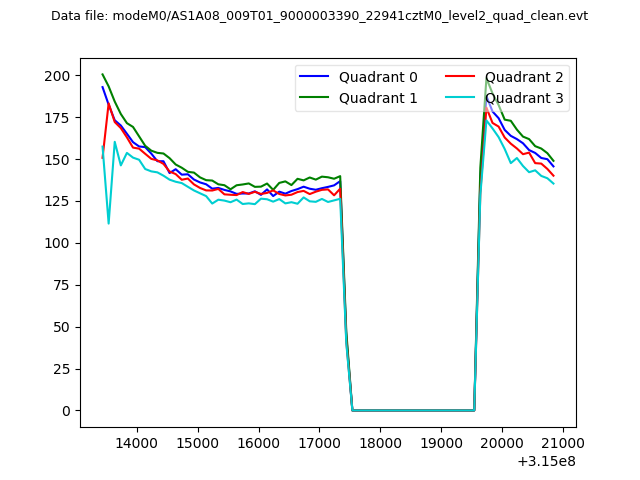 |
|
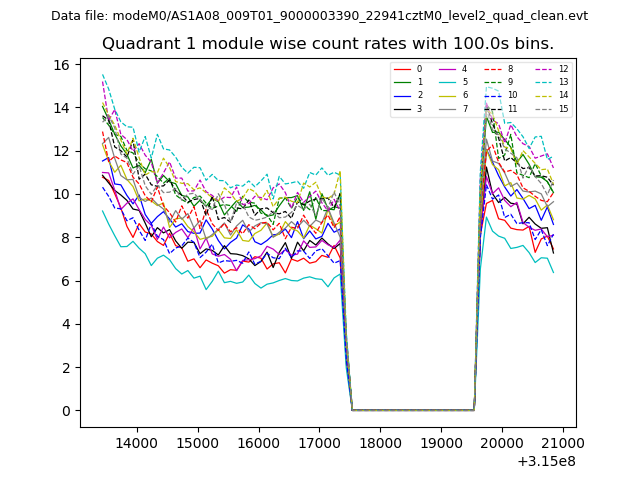
| Module-wise count rates for Quadrant A Data is divided into 100 sec bins |
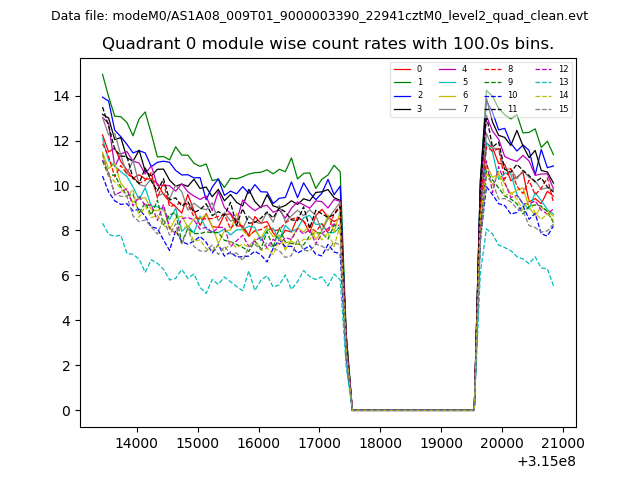 |
 |
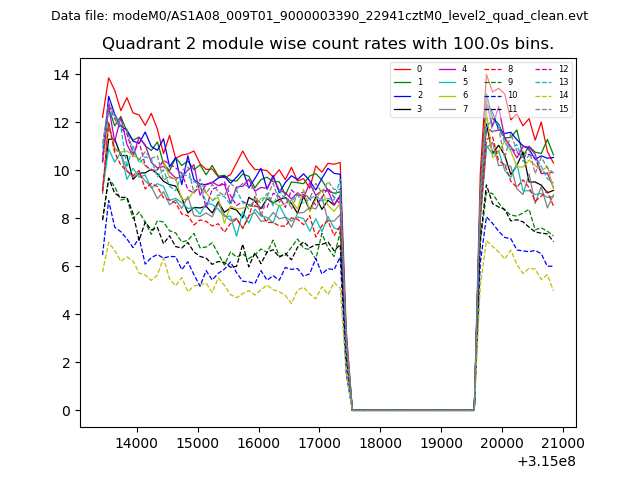
| Module-wise count rates for Quadrant B Data is divided into 100 sec bins |
 |
 |
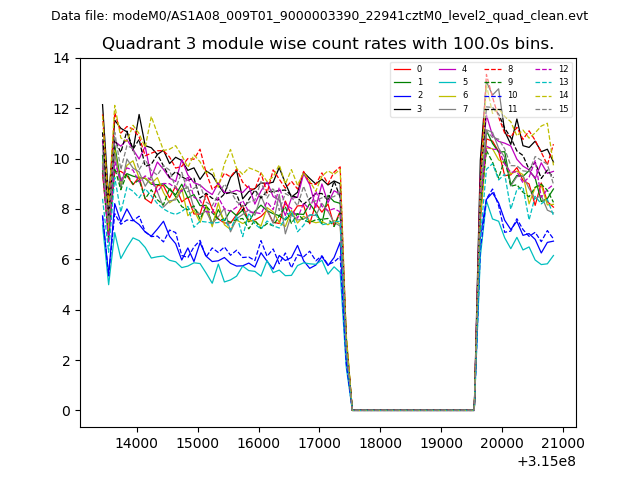
| Module-wise count rates for Quadrant C Data is divided into 100 sec bins |
 |
 |
| Module-wise count rates for Quadrant D Data is divided into 100 sec bins |
 |
 |
| Parameter | Plot |
|---|---|
| CZT HV Monitor | 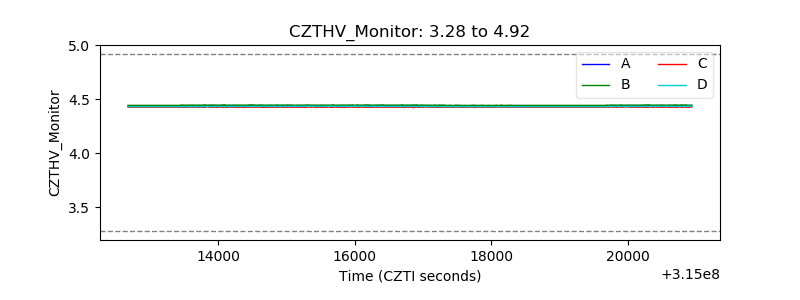 |
| D_VDD | 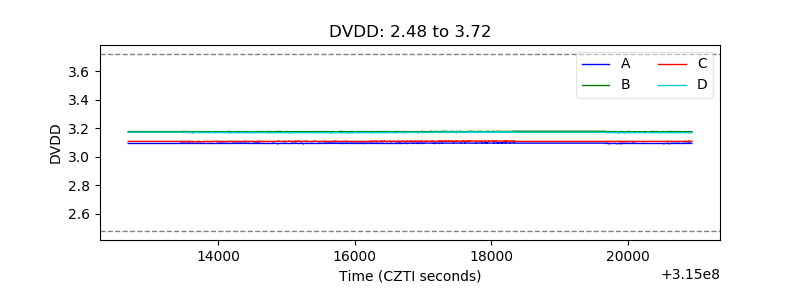 |
| Temperature 1 | 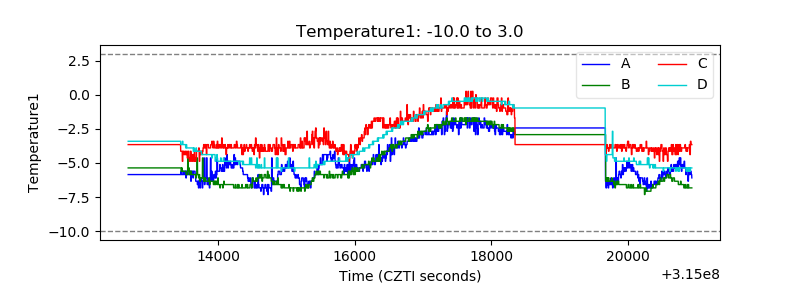 |
| Veto HV Monitor | 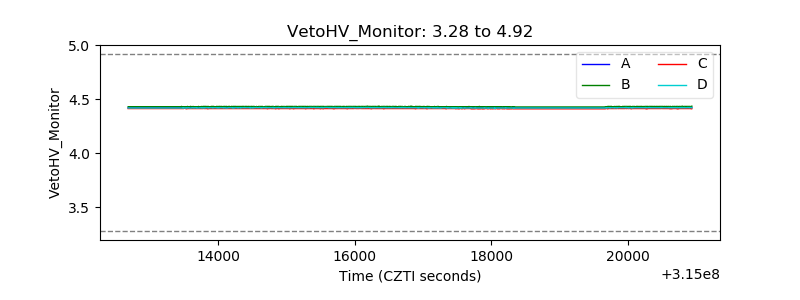 |
| Veto LLD | 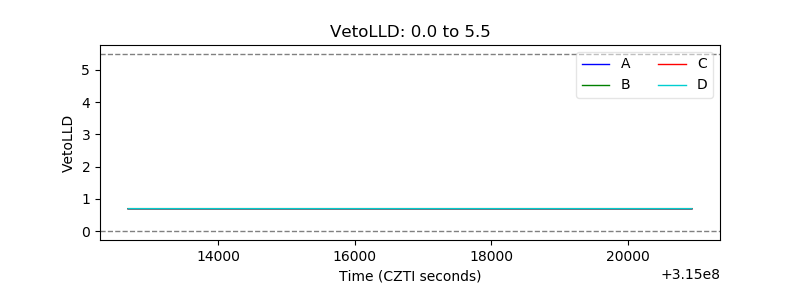 |
| Alpha Counter | 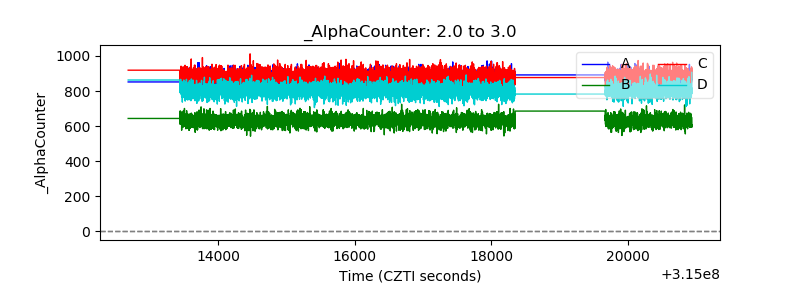 |
| _CPM_Rate | 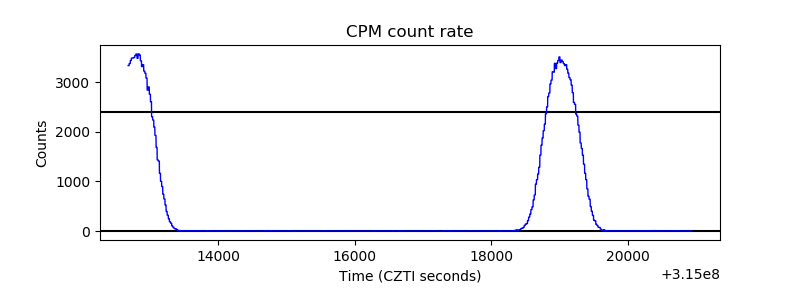 |
| CZT Counter | 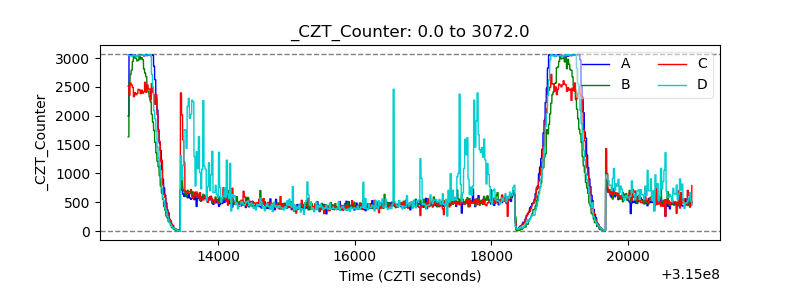 |
| +2.5 Volts monitor |  |
| +5 Volts monitor |  |
| _ROLL_ROT | 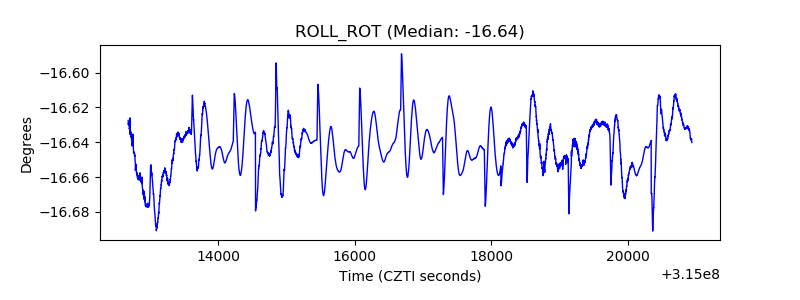 |
| _Roll_DEC | 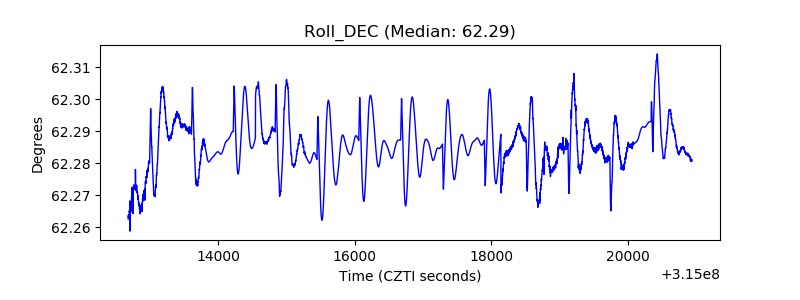 |
| _Roll_RA | 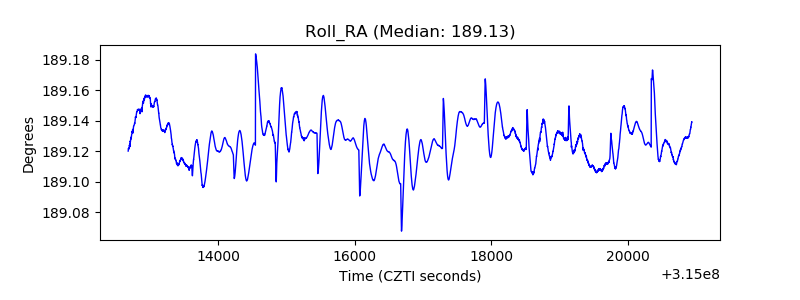 |
| Veto Counter | 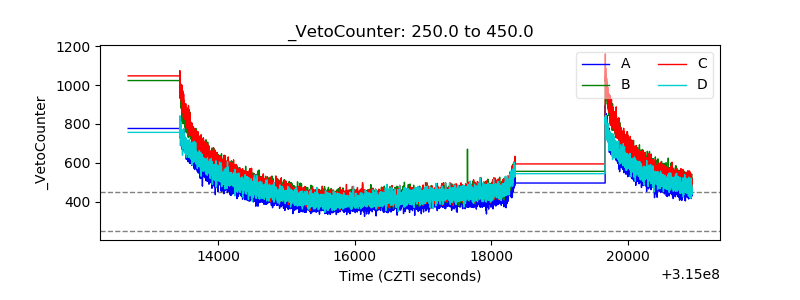 |