| Param | Original file | Final file |
|---|---|---|
| Filename | modeM0/AS1A08_009T01_9000003390_22945cztM0_level2.evt | modeM0/AS1A08_009T01_9000003390_22945cztM0_level2_quad_clean.evt |
| Size (bytes) | 1,525,968,000 | 330,243,840 |
| Size | 1.4 GB | 314.9 MB |
| Events in quadrant A | 10,458,684 | 2,164,507 |
| Events in quadrant B | 10,698,354 | 2,222,753 |
| Events in quadrant C | 10,573,722 | 2,094,700 |
| Events in quadrant D | 13,007,893 | 2,017,851 |
| Mode M9 | |||
|---|---|---|---|
| Quadrant | BADHDUFLAG | Total packets | Discarded packets |
| A | 0 | 53 | 0 |
| B | 0 | 54 | 0 |
| C | 0 | 54 | 0 |
| D | 0 | 54 | 0 |
| Mode SS | |||
|---|---|---|---|
| Quadrant | BADHDUFLAG | Total packets | Discarded packets |
| A | 0 | 446 | 0 |
| B | 0 | 446 | 0 |
| C | 0 | 446 | 0 |
| D | 0 | 446 | 0 |
| Mode M0 | |||
|---|---|---|---|
| Quadrant | BADHDUFLAG | Total packets | Discarded packets |
| A | 0 | 45106 | 5 |
| B | 0 | 45635 | 6 |
| C | 0 | 45556 | 5 |
| D | 0 | 53390 | 5 |
| Quadrant | Total seconds | Saturated seconds | Saturation percentage |
|---|---|---|---|
| A | 21834 | 183 | 0.838142% |
| B | 21833 | 222 | 1.016809% |
| C | 21833 | 290 | 1.328265% |
| D | 21833 | 351 | 1.607658% |
Noise dominated data is calculated using 1-second bins in cleaned event files. If a bin has >2000 counts, and if more than 50% of those come from <1% of pixels, then it is considered to be noise-dominated and hence unusable.
| Quadrant | # 1 sec bins | Bins with >0 counts | Bins with >2000 counts | High rate bins dominated by noise | Noise dominated (total time) | Noise dominated (detector-on time) | Marked lightcurve |
|---|---|---|---|---|---|---|---|
| A | 26369 | 21838 | 5 | 5 | 0.02% | 0.02% |  |
| B | 26368 | 21837 | 6 | 6 | 0.02% | 0.03% | 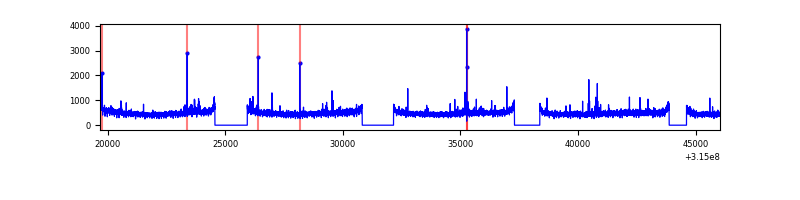 |
| C | 26368 | 21837 | 5 | 5 | 0.02% | 0.02% | 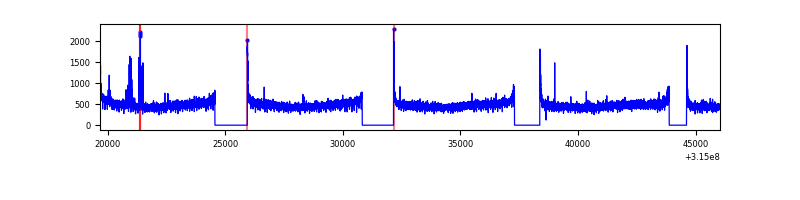 |
| D | 26368 | 21837 | 187 | 187 | 0.71% | 0.86% | 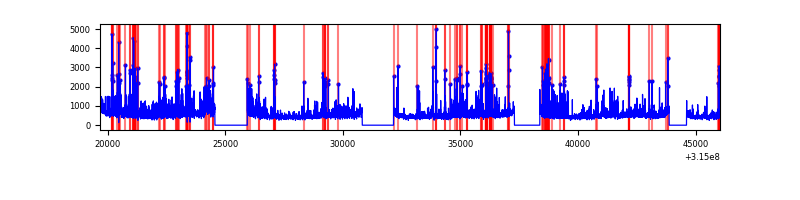 |
Top three noisy pixels from each quadrant. If the there are fewer than three noisy pixels in the level2.evt file, extra rows are filled as -1
| Pixel properties | Quadrant properties | ||||||
|---|---|---|---|---|---|---|---|
| Quadrant | DetID | PixID | Counts | Sigma | Mean | Median | Sigma |
| A | 13 | 170 | 58759 | 105.11 | 2696 | 2642 | 533.9 |
| A | 13 | 254 | 34809 | 60.25 | 2696 | 2642 | 533.9 |
| A | 0 | 226 | 23181 | 38.47 | 2696 | 2642 | 533.9 |
| B | 0 | 190 | 75586 | 148.53 | 2681 | 2619 | 491.3 |
| B | 0 | 189 | 61505 | 119.87 | 2681 | 2619 | 491.3 |
| B | 12 | 111 | 59142 | 115.06 | 2681 | 2619 | 491.3 |
| C | 14 | 238 | 415224 | 707.84 | 2555 | 2571 | 583.0 |
| C | 0 | 10 | 118602 | 199.03 | 2555 | 2571 | 583.0 |
| C | 7 | 247 | 68573 | 113.22 | 2555 | 2571 | 583.0 |
| D | 7 | 238 | 917768 | 1473.78 | 2583 | 2506 | 621.0 |
| D | 1 | 52 | 899344 | 1444.11 | 2583 | 2506 | 621.0 |
| D | 13 | 153 | 672317 | 1078.55 | 2583 | 2506 | 621.0 |
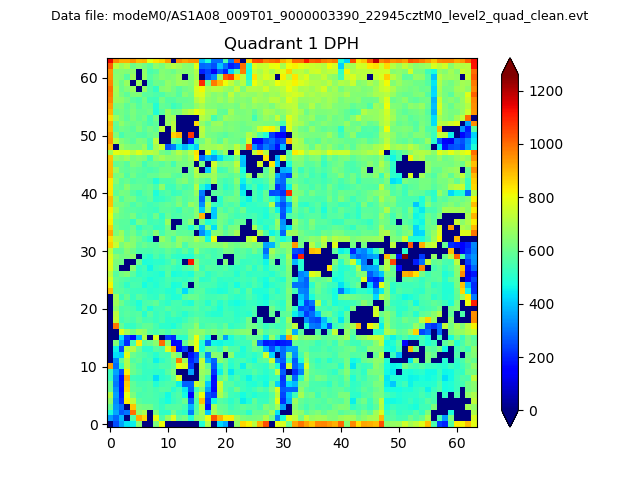
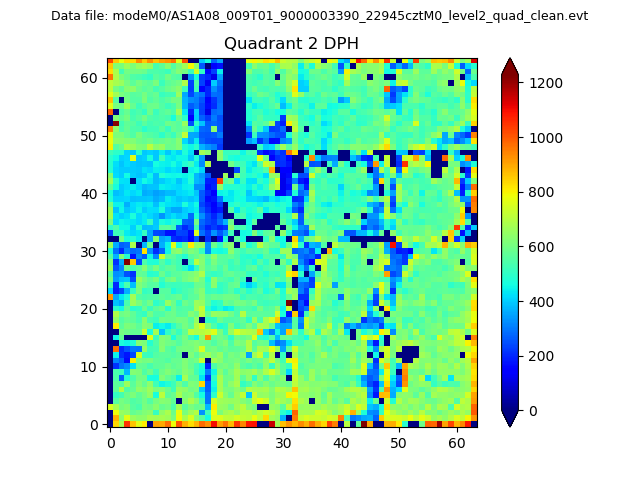
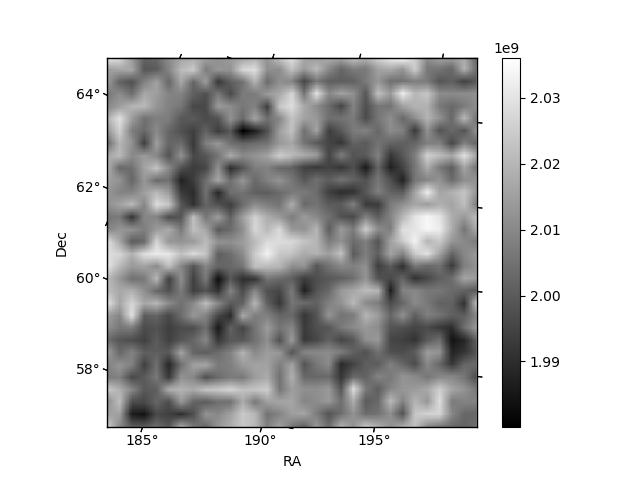
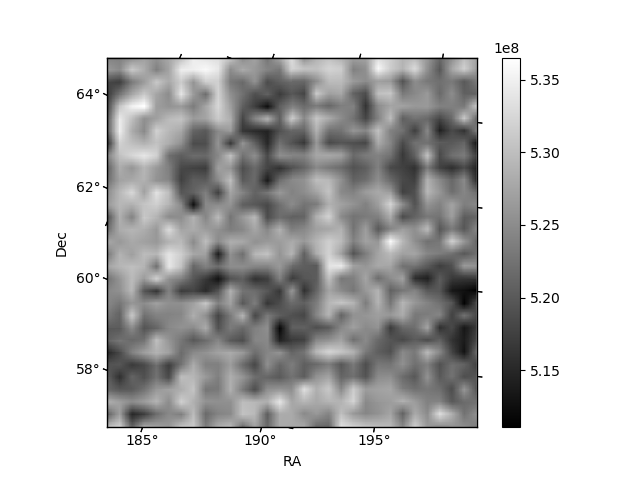
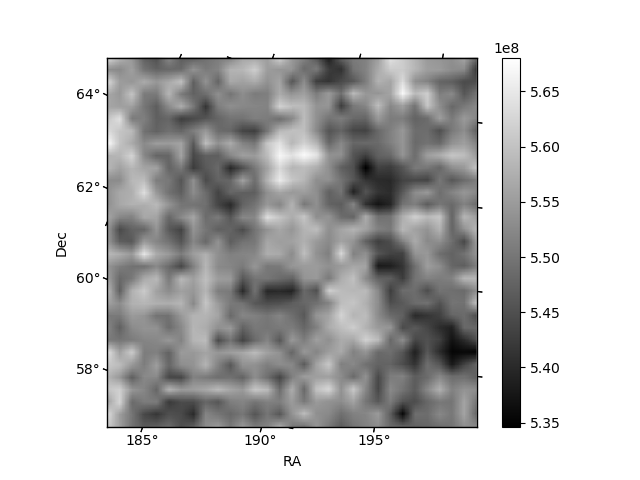
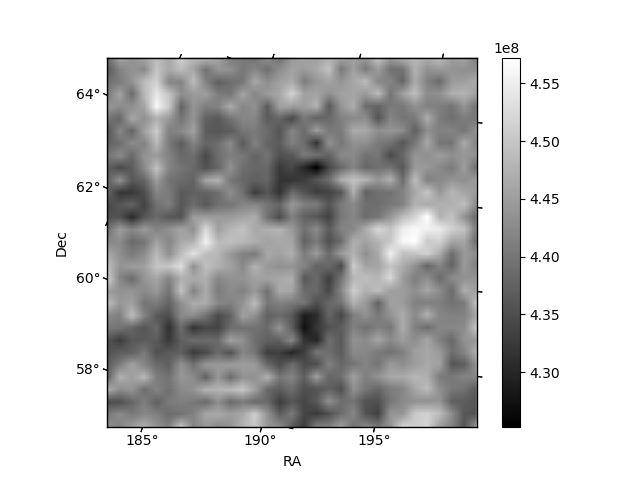
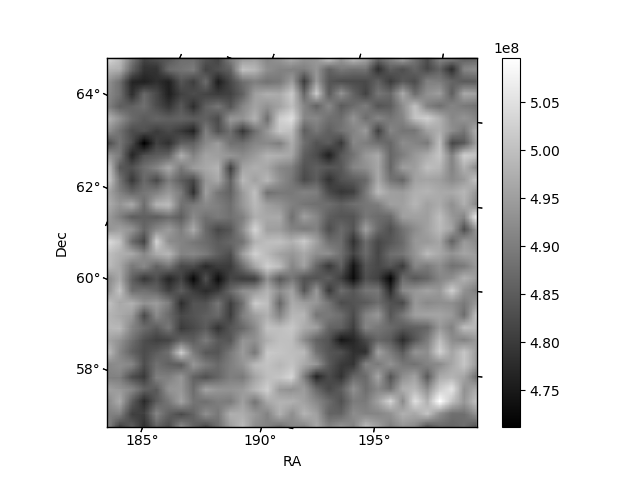
Histogram calculated using DETX and DETY for each event in the final _common_clean file
| Quadrant A | 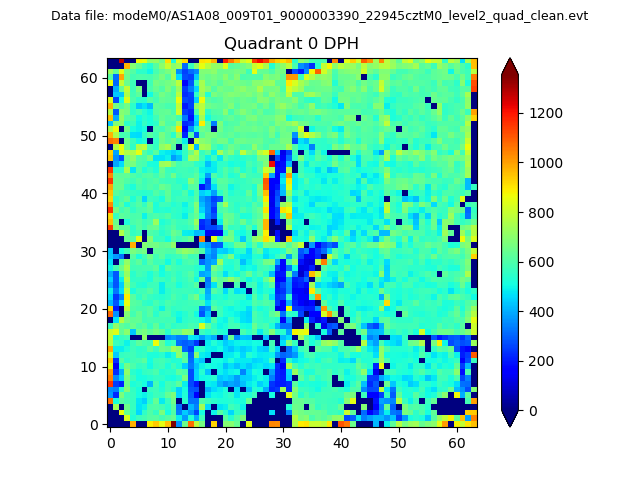 |
 |
Quadrant B |
|---|---|---|---|
| Quadrant D | 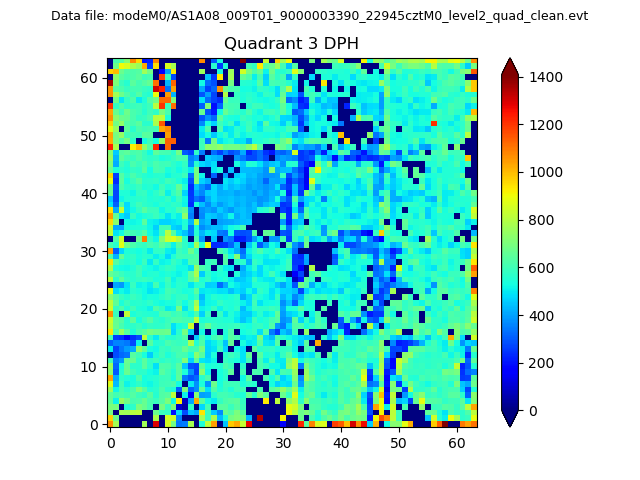 |
 |
Quadrant C |
| Plot type | Count rate plots | Images |
|---|---|---|
| Comparison with Poisson distribution Blue bars denote a histogram of data divided into 1 sec bins. Red curve is a Poisson curve with rate = median count rate of data. |
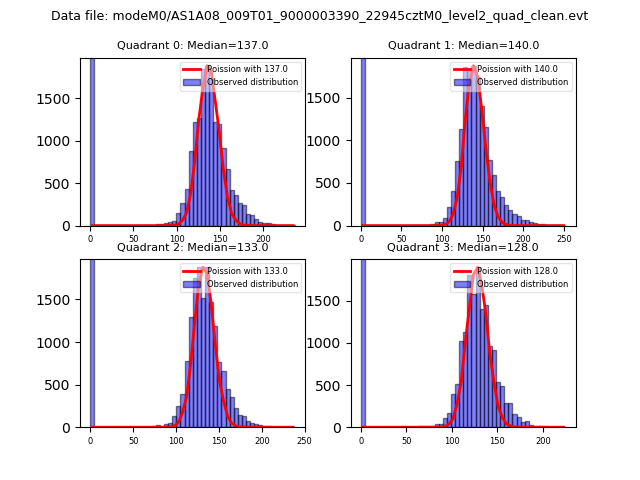 |
 |
| Quadrant-wise count rates Data is divided into 100 sec bins |
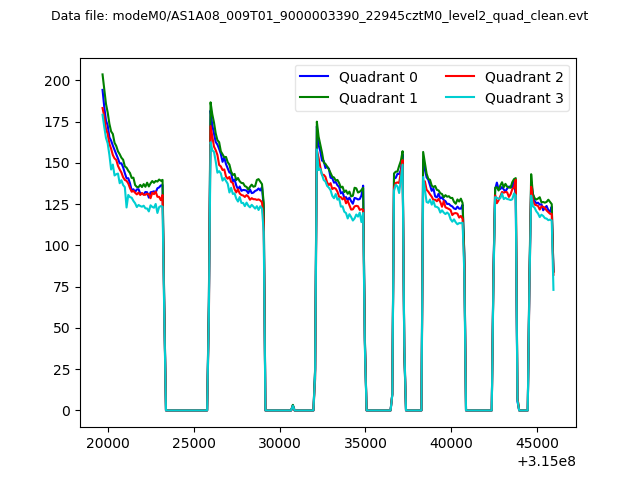 |
|
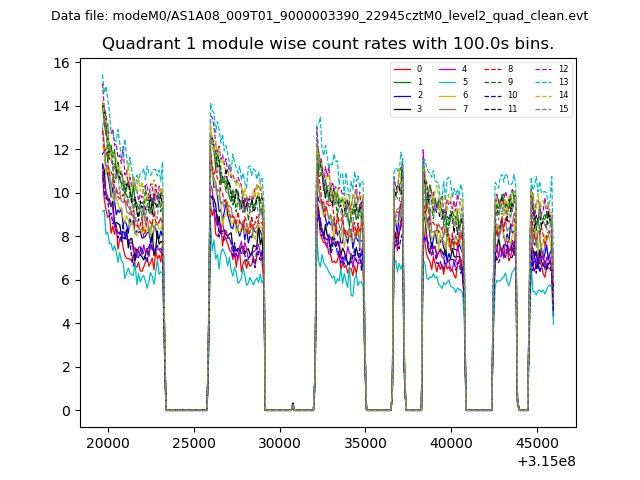
| Module-wise count rates for Quadrant A Data is divided into 100 sec bins |
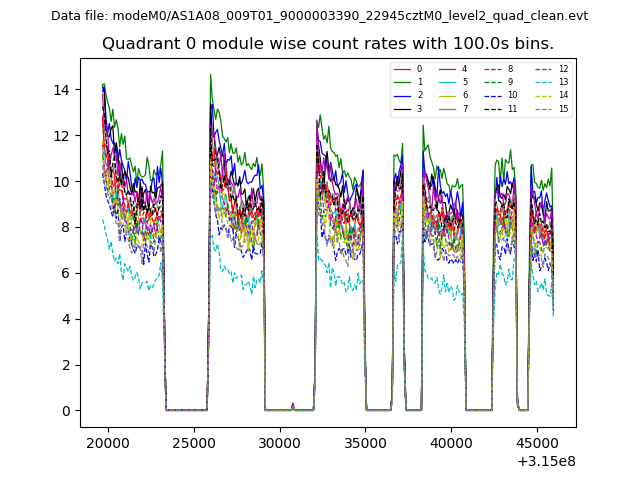 |
 |
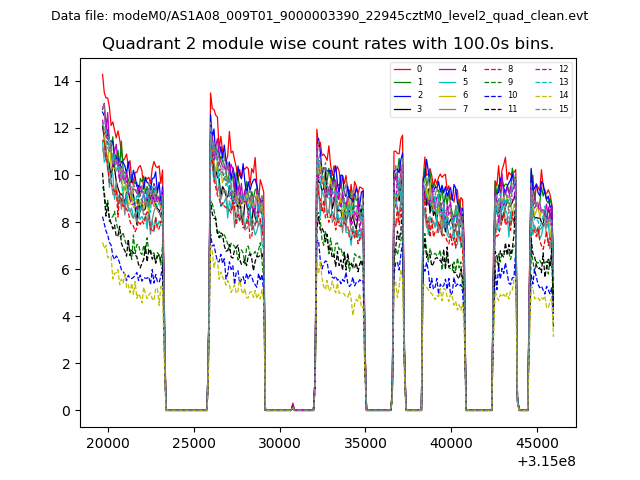
| Module-wise count rates for Quadrant B Data is divided into 100 sec bins |
 |
 |
| Module-wise count rates for Quadrant C Data is divided into 100 sec bins |
 |
 |
| Module-wise count rates for Quadrant D Data is divided into 100 sec bins |
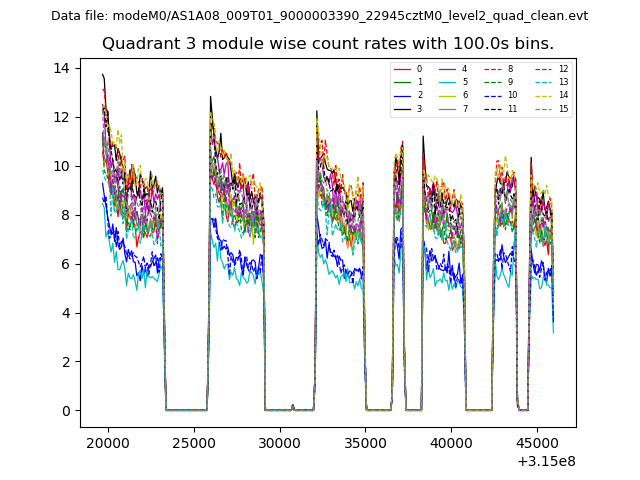 |
 |
| Parameter | Plot |
|---|---|
| CZT HV Monitor | 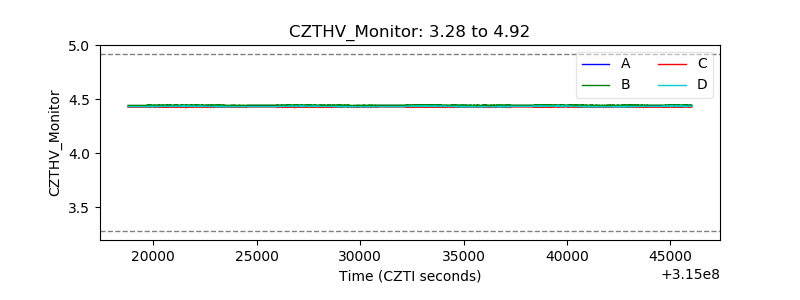 |
| D_VDD |  |
| Temperature 1 | 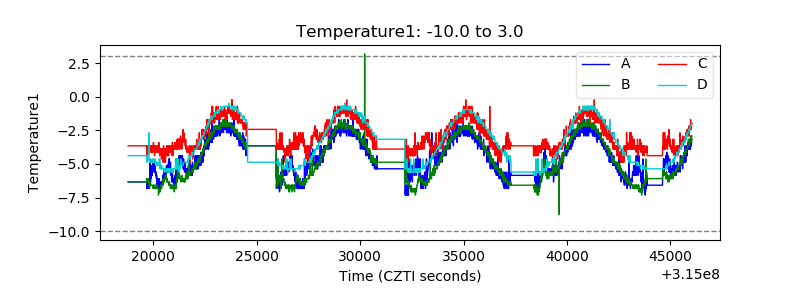 |
| Veto HV Monitor | 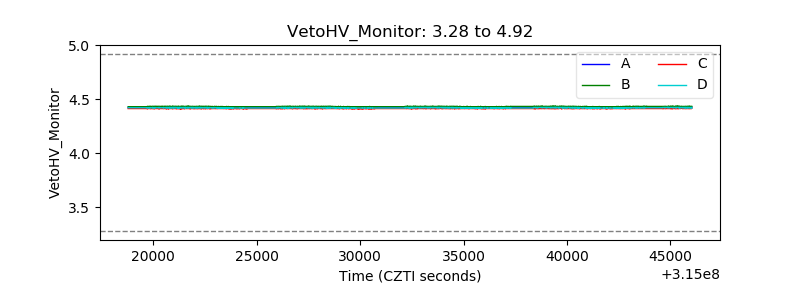 |
| Veto LLD | 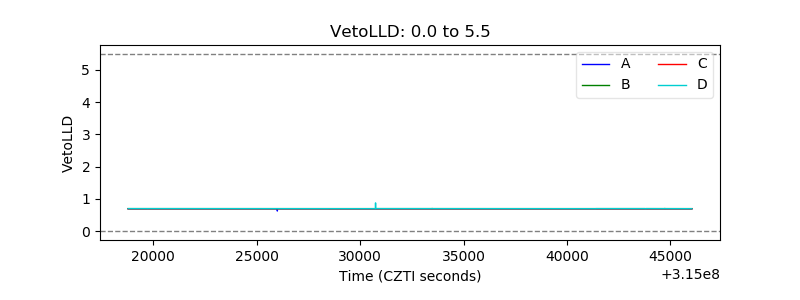 |
| Alpha Counter | 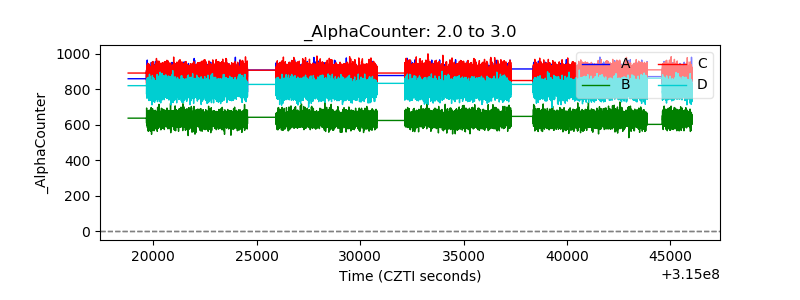 |
| _CPM_Rate | 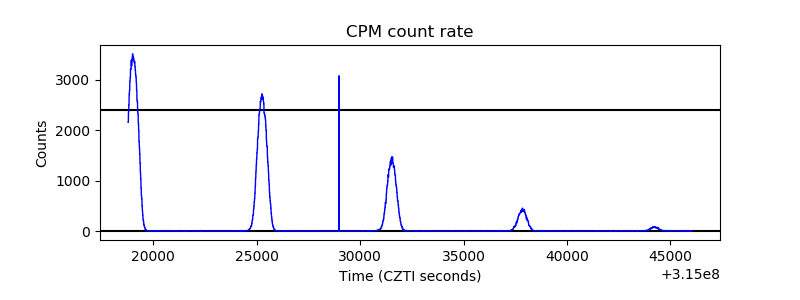 |
| CZT Counter | 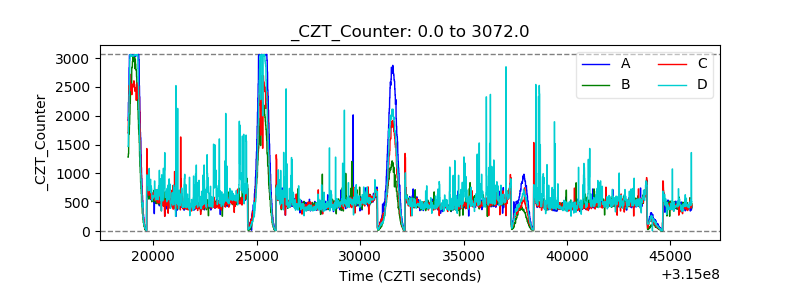 |
| +2.5 Volts monitor |  |
| +5 Volts monitor |  |
| _ROLL_ROT | 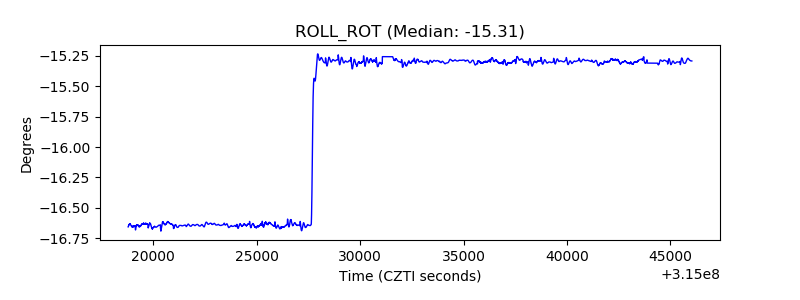 |
| _Roll_DEC | 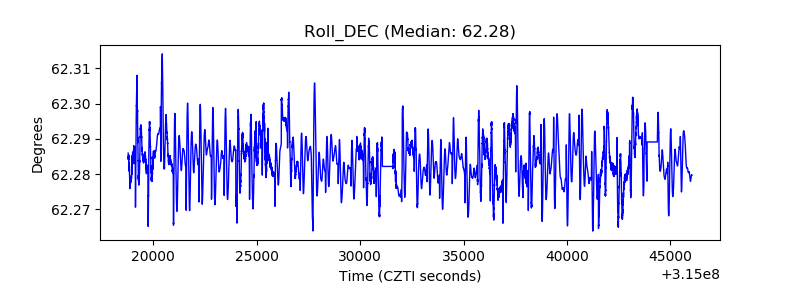 |
| _Roll_RA | 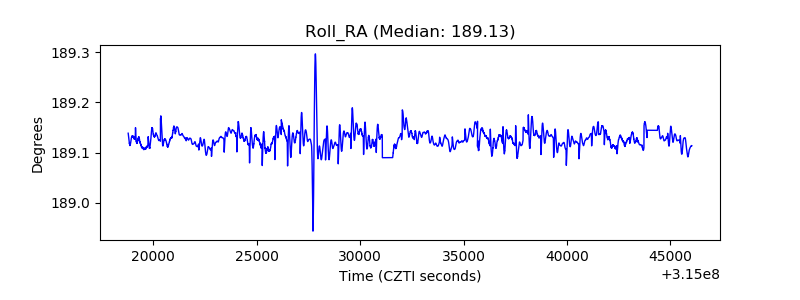 |
| Veto Counter | 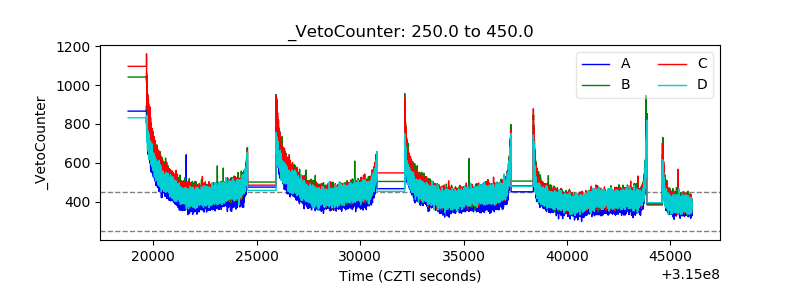 |