| Param | Original file | Final file |
|---|---|---|
| Filename | modeM0/AS1A08_009T01_9000003390_22946cztM0_level2.evt | modeM0/AS1A08_009T01_9000003390_22946cztM0_level2_quad_clean.evt |
| Size (bytes) | 447,217,920 | 100,903,680 |
| Size | 426.5 MB | 96.2 MB |
| Events in quadrant A | 3,211,877 | 654,664 |
| Events in quadrant B | 3,194,044 | 667,982 |
| Events in quadrant C | 3,138,970 | 636,720 |
| Events in quadrant D | 3,532,257 | 618,094 |
| Mode M9 | |||
|---|---|---|---|
| Quadrant | BADHDUFLAG | Total packets | Discarded packets |
| A | 0 | 4 | 0 |
| B | 0 | 4 | 0 |
| C | 0 | 4 | 0 |
| D | 0 | 4 | 0 |
| Mode SS | |||
|---|---|---|---|
| Quadrant | BADHDUFLAG | Total packets | Discarded packets |
| A | 0 | 140 | 0 |
| B | 0 | 140 | 0 |
| C | 0 | 140 | 0 |
| D | 0 | 140 | 0 |
| Mode M0 | |||
|---|---|---|---|
| Quadrant | BADHDUFLAG | Total packets | Discarded packets |
| A | 0 | 14078 | 2 |
| B | 0 | 14021 | 1 |
| C | 0 | 13962 | 1 |
| D | 0 | 15212 | 1 |
| Quadrant | Total seconds | Saturated seconds | Saturation percentage |
|---|---|---|---|
| A | 6862 | 84 | 1.224133% |
| B | 6863 | 79 | 1.151100% |
| C | 6863 | 95 | 1.384234% |
| D | 6863 | 148 | 2.156491% |
Noise dominated data is calculated using 1-second bins in cleaned event files. If a bin has >2000 counts, and if more than 50% of those come from <1% of pixels, then it is considered to be noise-dominated and hence unusable.
| Quadrant | # 1 sec bins | Bins with >0 counts | Bins with >2000 counts | High rate bins dominated by noise | Noise dominated (total time) | Noise dominated (detector-on time) | Marked lightcurve |
|---|---|---|---|---|---|---|---|
| A | 7237 | 6863 | 4 | 4 | 0.06% | 0.06% | 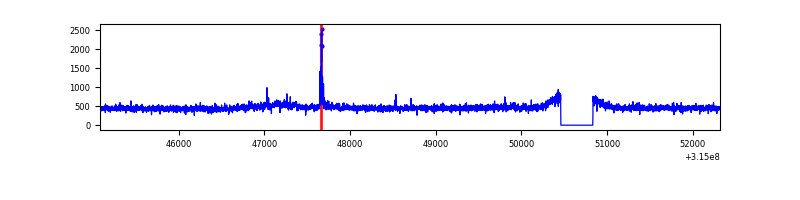 |
| B | 7238 | 6864 | 1 | 1 | 0.01% | 0.01% | 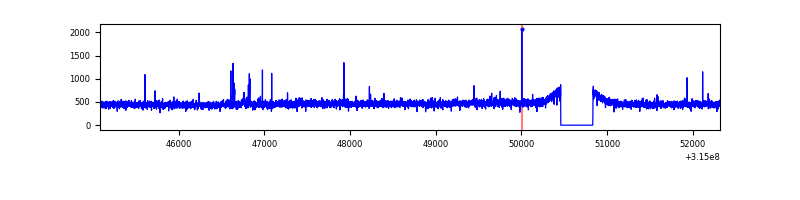 |
| C | 7238 | 6864 | 5 | 5 | 0.07% | 0.07% | 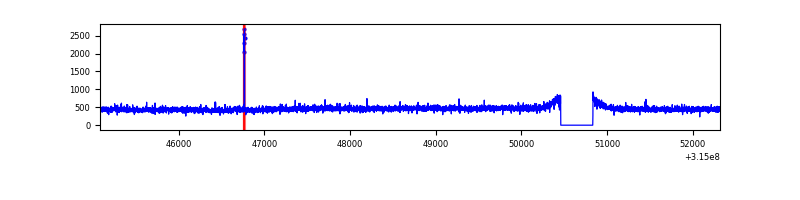 |
| D | 7238 | 6864 | 78 | 78 | 1.08% | 1.14% | 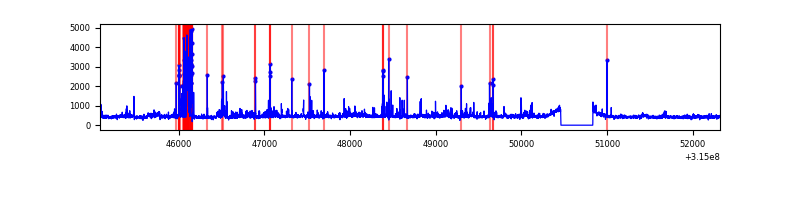 |
Top three noisy pixels from each quadrant. If the there are fewer than three noisy pixels in the level2.evt file, extra rows are filled as -1
| Pixel properties | Quadrant properties | ||||||
|---|---|---|---|---|---|---|---|
| Quadrant | DetID | PixID | Counts | Sigma | Mean | Median | Sigma |
| A | 13 | 170 | 93160 | 561.8 | 809 | 791 | 164.4 |
| A | 13 | 254 | 10669 | 60.08 | 809 | 791 | 164.4 |
| A | 0 | 226 | 7062 | 38.14 | 809 | 791 | 164.4 |
| B | 0 | 190 | 18768 | 117.51 | 802 | 781 | 153.1 |
| B | 12 | 111 | 18569 | 116.21 | 802 | 781 | 153.1 |
| B | 0 | 189 | 17252 | 107.61 | 802 | 781 | 153.1 |
| C | 14 | 238 | 122220 | 681.08 | 767 | 771 | 178.3 |
| C | 7 | 247 | 18825 | 101.25 | 767 | 771 | 178.3 |
| C | 13 | 61 | 5280 | 25.29 | 767 | 771 | 178.3 |
| D | 12 | 238 | 179102 | 954.04 | 776 | 752 | 186.9 |
| D | 13 | 153 | 158302 | 842.77 | 776 | 752 | 186.9 |
| D | 7 | 223 | 49654 | 261.59 | 776 | 752 | 186.9 |
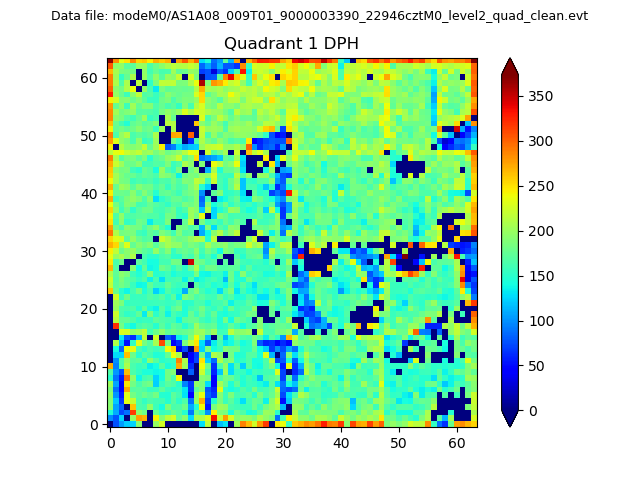
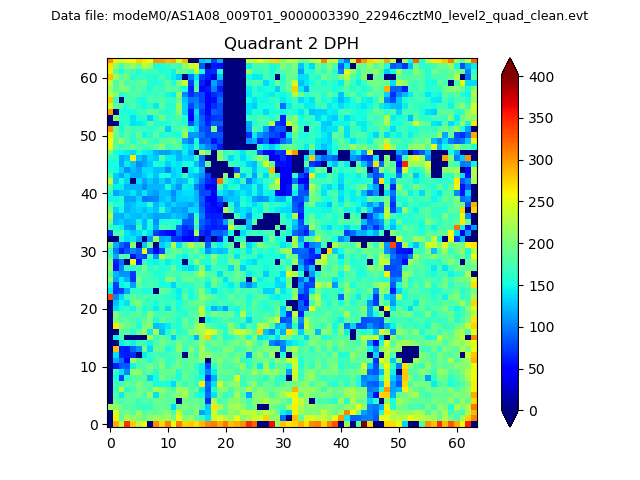
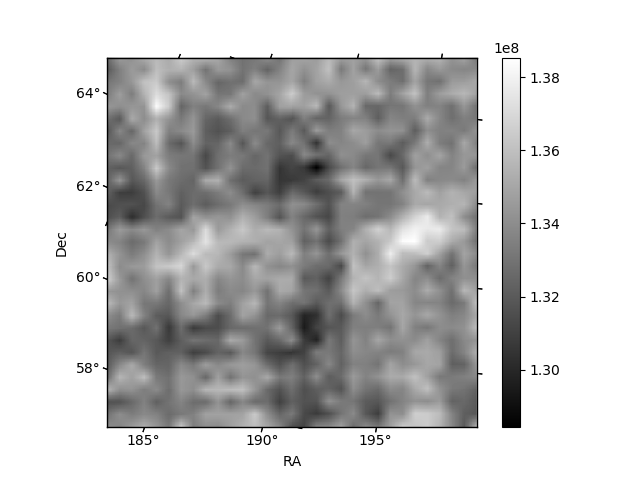
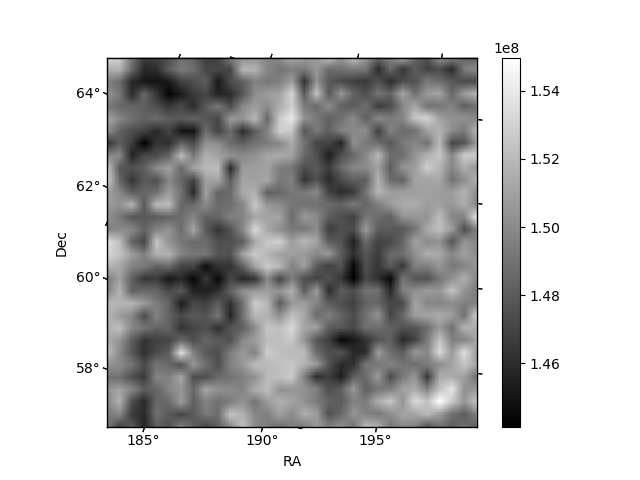
Histogram calculated using DETX and DETY for each event in the final _common_clean file
| Quadrant A |  |
 |
Quadrant B |
|---|---|---|---|
| Quadrant D |  |
 |
Quadrant C |
| Plot type | Count rate plots | Images |
|---|---|---|
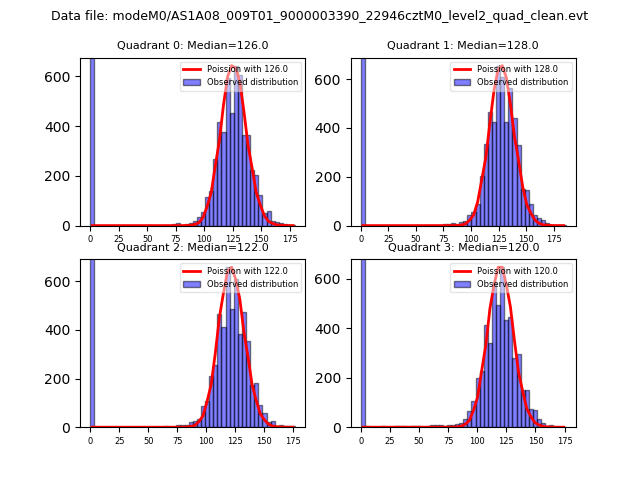
| Comparison with Poisson distribution Blue bars denote a histogram of data divided into 1 sec bins. Red curve is a Poisson curve with rate = median count rate of data. |
 |
 |
| Quadrant-wise count rates Data is divided into 100 sec bins |
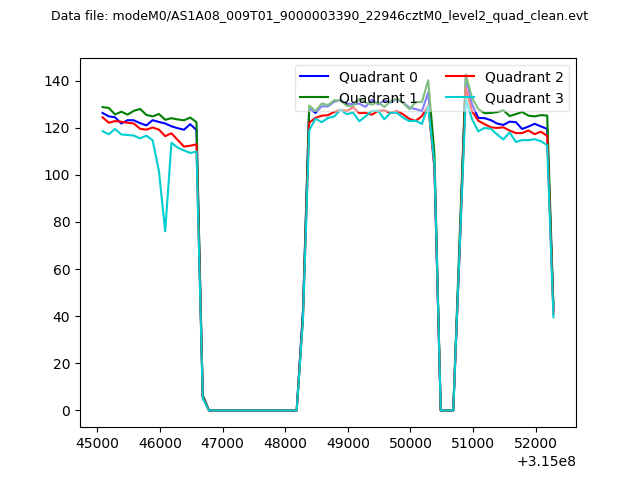 |
|
| Module-wise count rates for Quadrant A Data is divided into 100 sec bins |
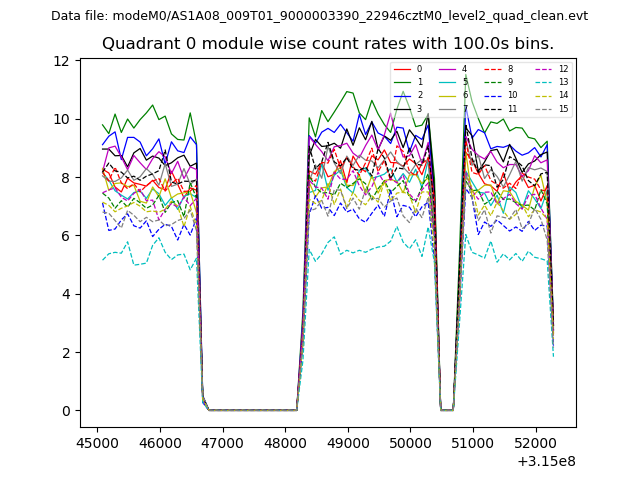 |
 |
| Module-wise count rates for Quadrant B Data is divided into 100 sec bins |
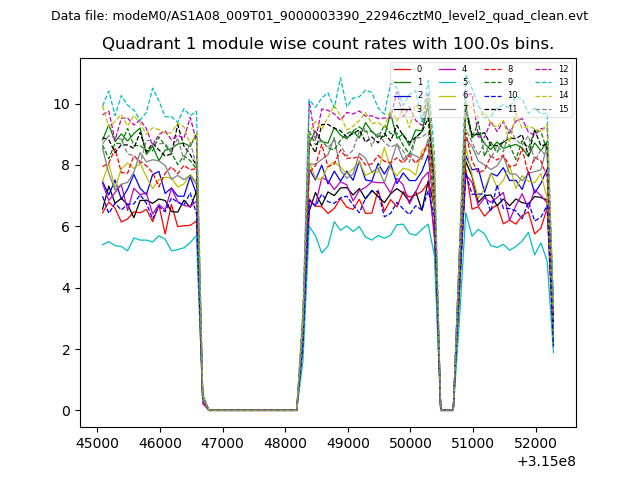 |
 |
| Module-wise count rates for Quadrant C Data is divided into 100 sec bins |
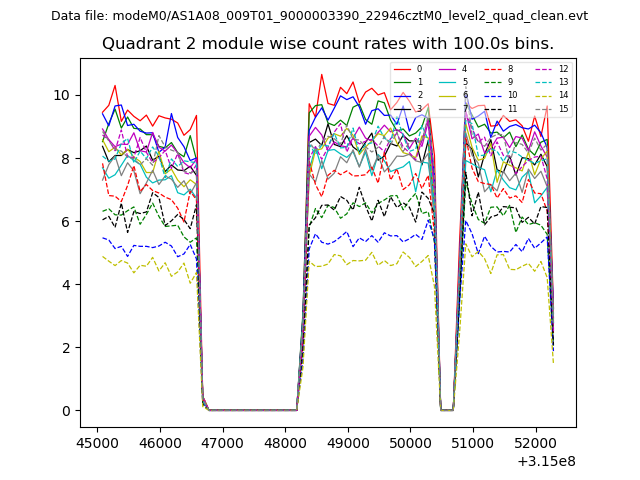 |
 |
| Module-wise count rates for Quadrant D Data is divided into 100 sec bins |
 |
 |
| Parameter | Plot |
|---|---|
| CZT HV Monitor | 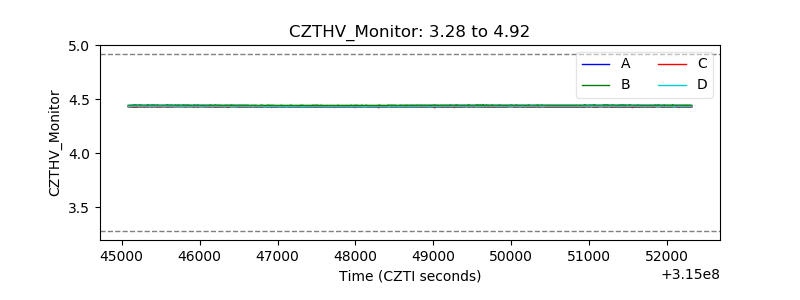 |
| D_VDD | 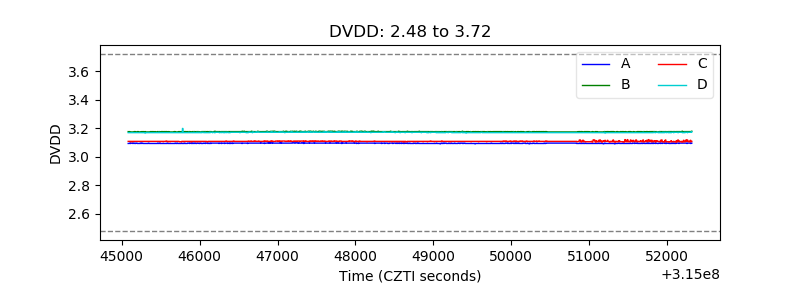 |
| Temperature 1 | 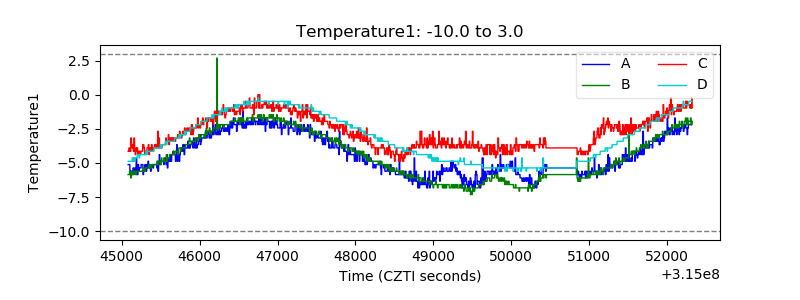 |
| Veto HV Monitor | 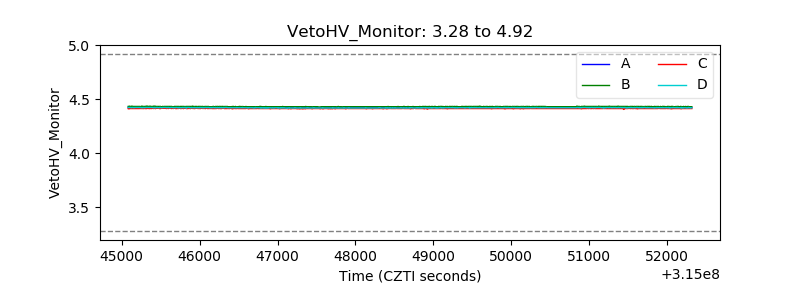 |
| Veto LLD | 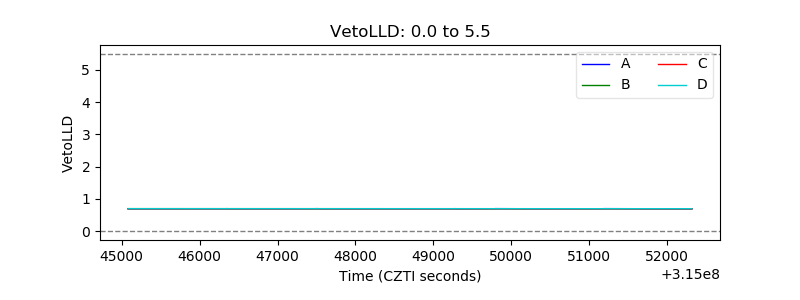 |
| Alpha Counter | 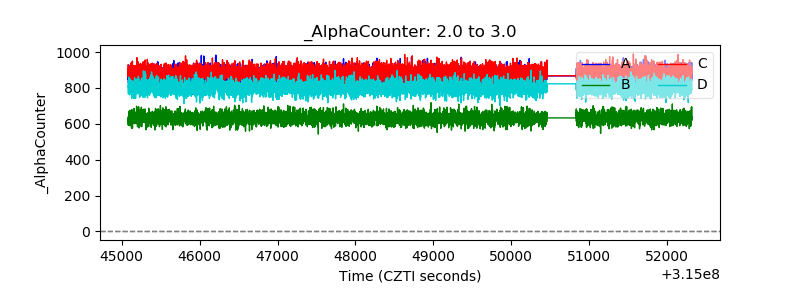 |
| _CPM_Rate | 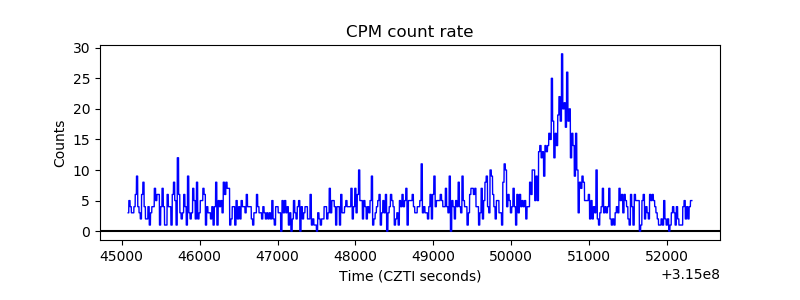 |
| CZT Counter | 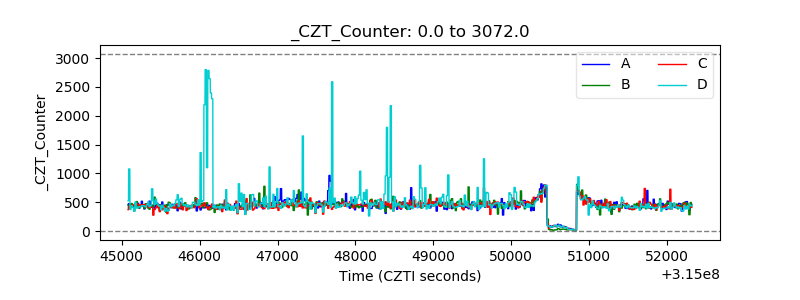 |
| +2.5 Volts monitor | 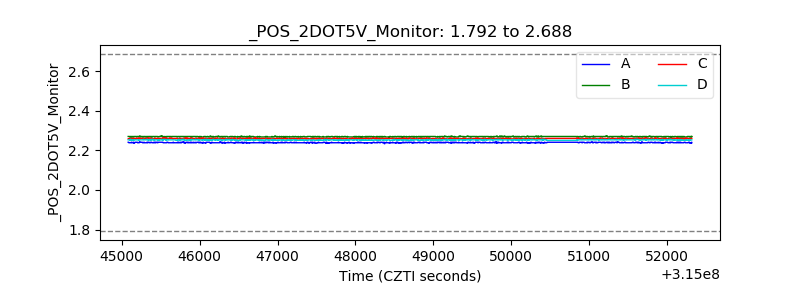 |
| +5 Volts monitor | 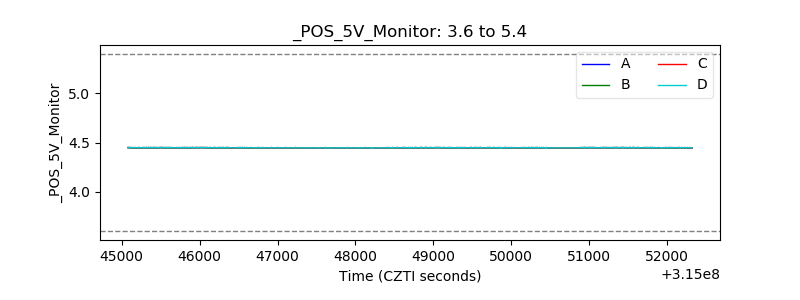 |
| _ROLL_ROT | 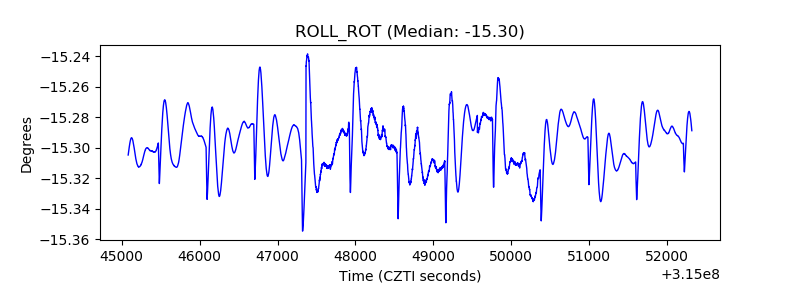 |
| _Roll_DEC | 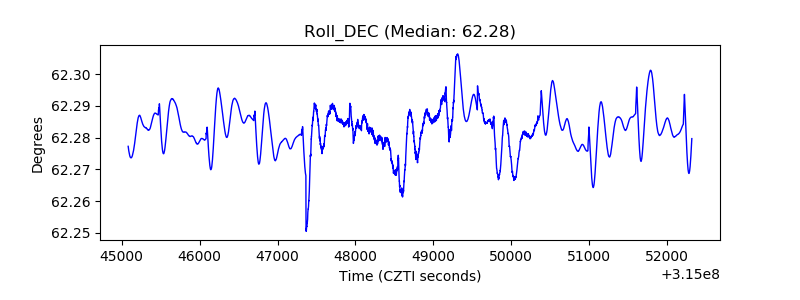 |
| _Roll_RA | 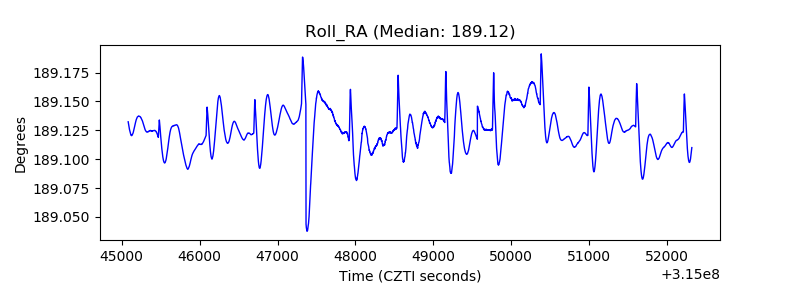 |
| Veto Counter | 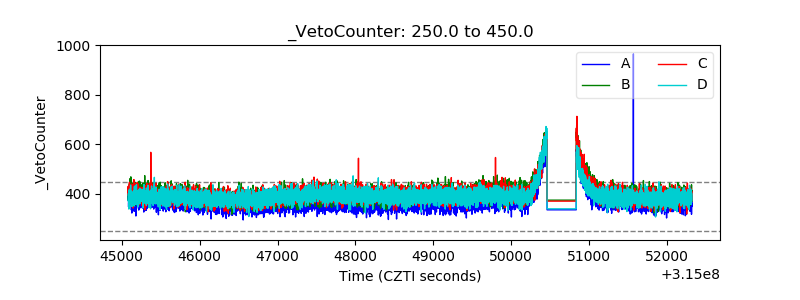 |