| Param | Original file | Final file |
|---|---|---|
| Filename | modeM0/AS1A08_009T01_9000003390_22947cztM0_level2.evt | modeM0/AS1A08_009T01_9000003390_22947cztM0_level2_quad_clean.evt |
| Size (bytes) | 462,479,040 | 99,766,080 |
| Size | 441.1 MB | 95.1 MB |
| Events in quadrant A | 3,383,430 | 641,103 |
| Events in quadrant B | 3,408,771 | 651,653 |
| Events in quadrant C | 3,281,916 | 621,960 |
| Events in quadrant D | 3,446,385 | 609,351 |
| Mode M9 | |||
|---|---|---|---|
| Quadrant | BADHDUFLAG | Total packets | Discarded packets |
| A | 0 | 2 | 0 |
| B | 0 | 2 | 0 |
| C | 0 | 2 | 0 |
| D | 0 | 2 | 0 |
| Mode SS | |||
|---|---|---|---|
| Quadrant | BADHDUFLAG | Total packets | Discarded packets |
| A | 0 | 146 | 0 |
| B | 0 | 146 | 0 |
| C | 0 | 146 | 0 |
| D | 0 | 146 | 0 |
| Mode M0 | |||
|---|---|---|---|
| Quadrant | BADHDUFLAG | Total packets | Discarded packets |
| A | 0 | 14859 | 2 |
| B | 0 | 14762 | 1 |
| C | 0 | 14555 | 1 |
| D | 0 | 15289 | 1 |
| Quadrant | Total seconds | Saturated seconds | Saturation percentage |
|---|---|---|---|
| A | 7135 | 110 | 1.541696% |
| B | 7136 | 131 | 1.835762% |
| C | 7136 | 137 | 1.919843% |
| D | 7136 | 115 | 1.611547% |
Noise dominated data is calculated using 1-second bins in cleaned event files. If a bin has >2000 counts, and if more than 50% of those come from <1% of pixels, then it is considered to be noise-dominated and hence unusable.
| Quadrant | # 1 sec bins | Bins with >0 counts | Bins with >2000 counts | High rate bins dominated by noise | Noise dominated (total time) | Noise dominated (detector-on time) | Marked lightcurve |
|---|---|---|---|---|---|---|---|
| A | 7370 | 7136 | 0 | 0 | 0.00% | 0.00% | 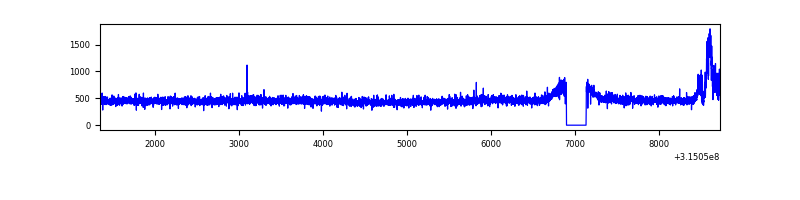 |
| B | 7371 | 7137 | 6 | 6 | 0.08% | 0.08% | 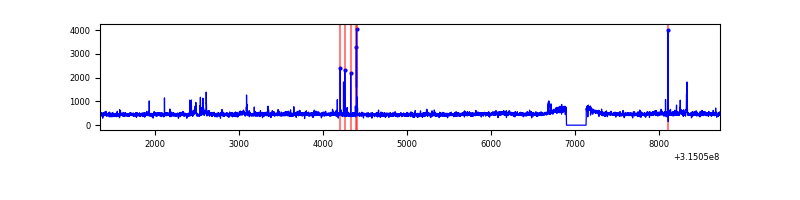 |
| C | 7371 | 7137 | 1 | 1 | 0.01% | 0.01% | 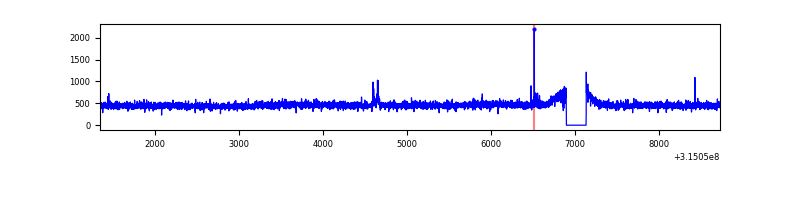 |
| D | 7371 | 7137 | 20 | 20 | 0.27% | 0.28% | 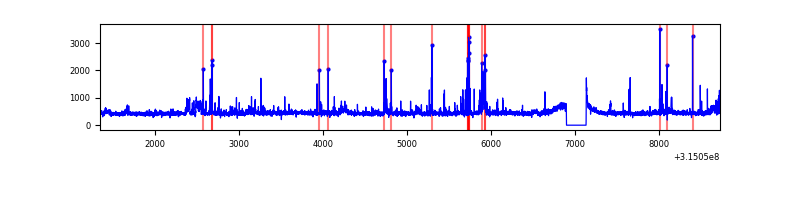 |
Top three noisy pixels from each quadrant. If the there are fewer than three noisy pixels in the level2.evt file, extra rows are filled as -1
| Pixel properties | Quadrant properties | ||||||
|---|---|---|---|---|---|---|---|
| Quadrant | DetID | PixID | Counts | Sigma | Mean | Median | Sigma |
| A | 14 | 238 | 109840 | 639.2 | 841 | 822 | 170.6 |
| A | 13 | 170 | 23241 | 131.45 | 841 | 822 | 170.6 |
| A | 13 | 254 | 11322 | 61.56 | 841 | 822 | 170.6 |
| B | 0 | 189 | 42936 | 262.63 | 836 | 815 | 160.4 |
| B | 0 | 190 | 40829 | 249.49 | 836 | 815 | 160.4 |
| B | 4 | 216 | 37429 | 228.29 | 836 | 815 | 160.4 |
| C | 14 | 238 | 126176 | 669.32 | 798 | 801 | 187.3 |
| C | 7 | 247 | 24703 | 127.6 | 798 | 801 | 187.3 |
| C | 8 | 128 | 11368 | 56.41 | 798 | 801 | 187.3 |
| D | 13 | 153 | 184162 | 922.98 | 815 | 790 | 198.7 |
| D | 1 | 52 | 87388 | 435.88 | 815 | 790 | 198.7 |
| D | 7 | 223 | 38014 | 187.36 | 815 | 790 | 198.7 |
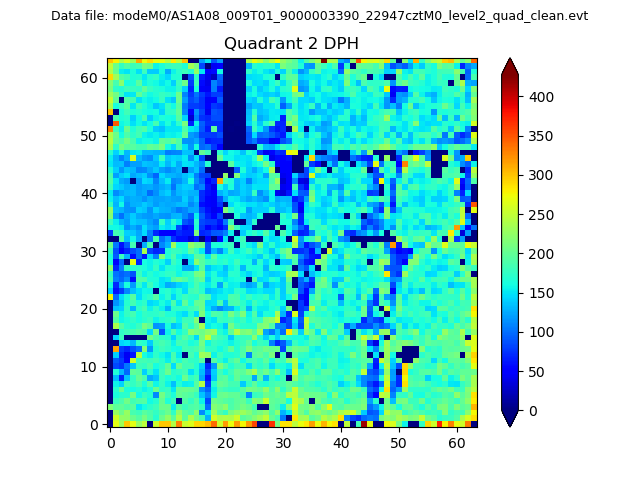
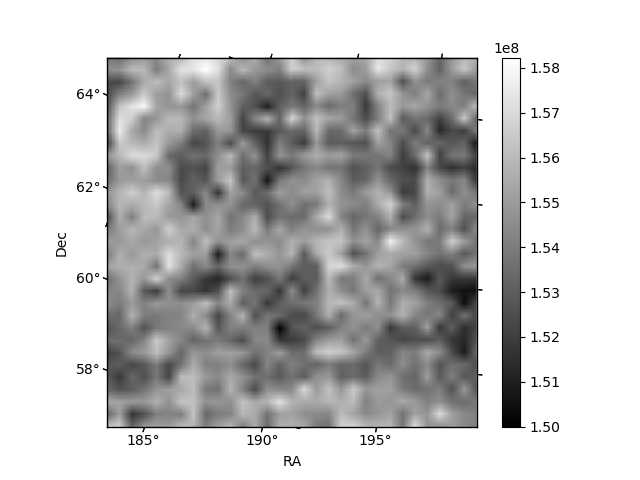
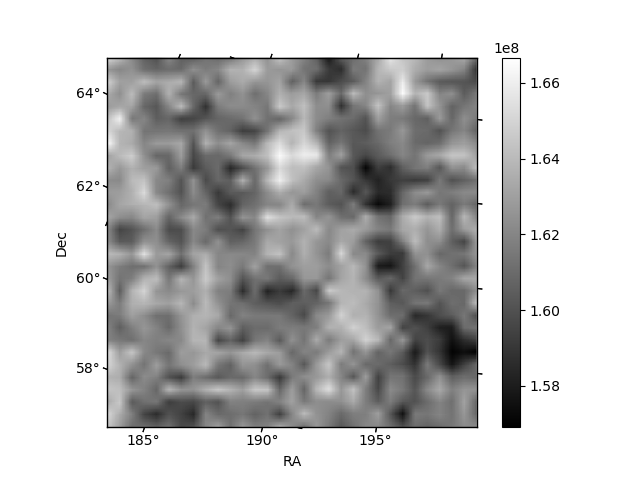
Histogram calculated using DETX and DETY for each event in the final _common_clean file
| Quadrant A | 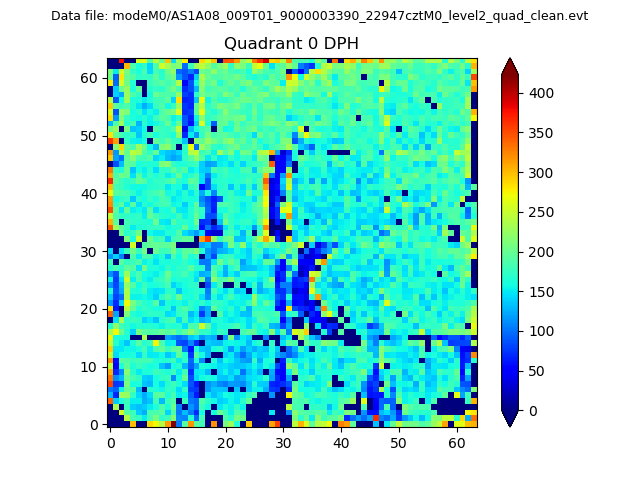 |
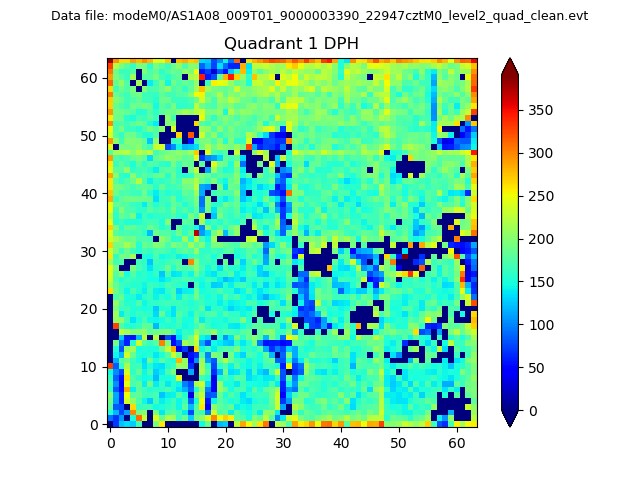 |
Quadrant B |
|---|---|---|---|
| Quadrant D | 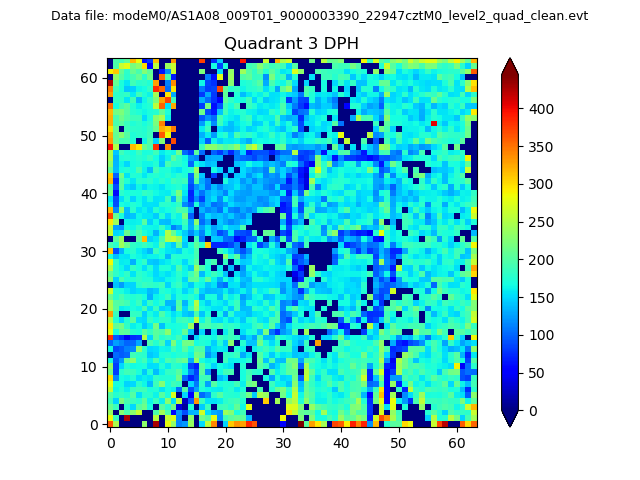 |
 |
Quadrant C |
| Plot type | Count rate plots | Images |
|---|---|---|
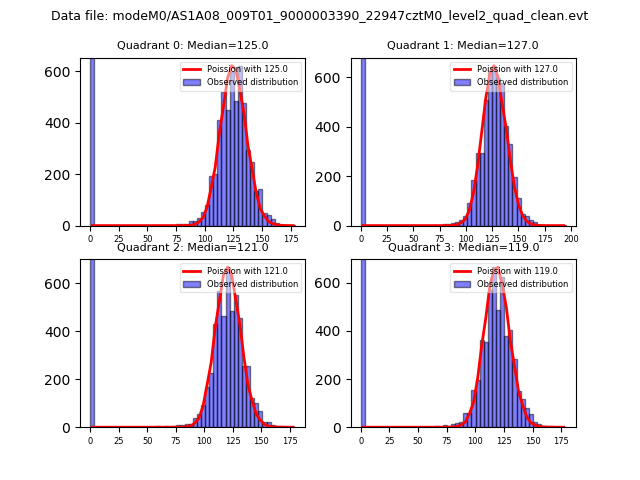
| Comparison with Poisson distribution Blue bars denote a histogram of data divided into 1 sec bins. Red curve is a Poisson curve with rate = median count rate of data. |
 |
 |
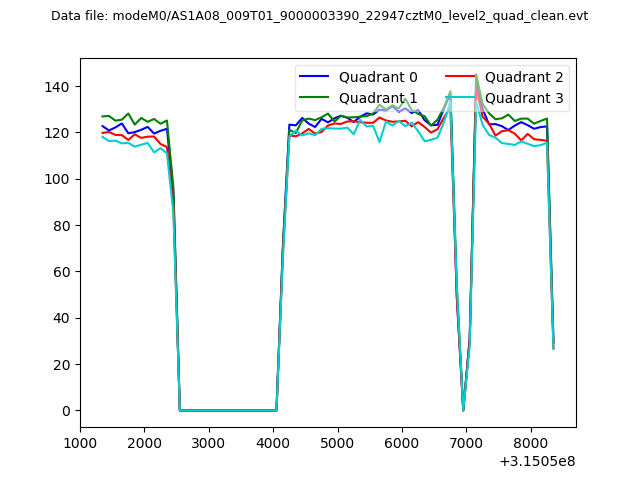
| Quadrant-wise count rates Data is divided into 100 sec bins |
 |
|
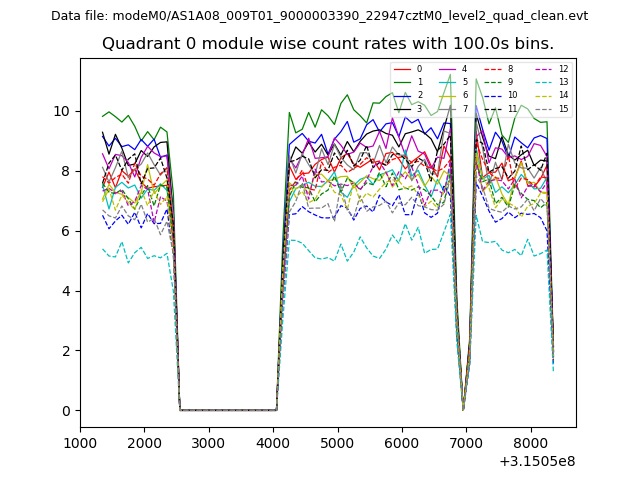
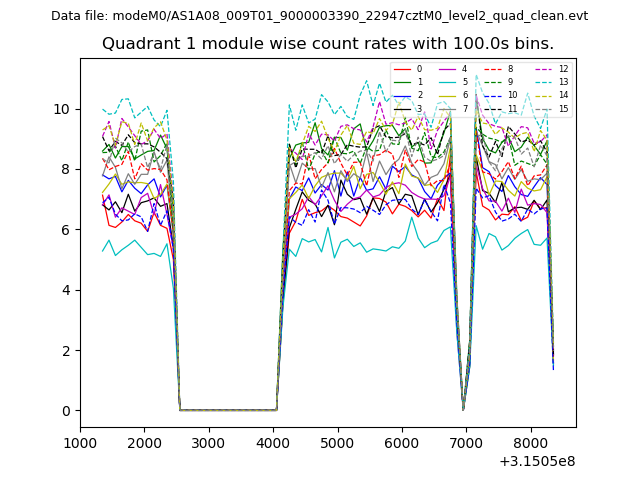
| Module-wise count rates for Quadrant A Data is divided into 100 sec bins |
 |
 |
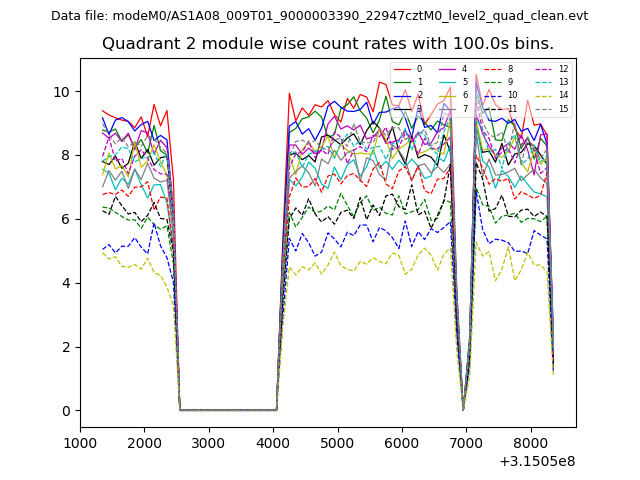
| Module-wise count rates for Quadrant B Data is divided into 100 sec bins |
 |
 |
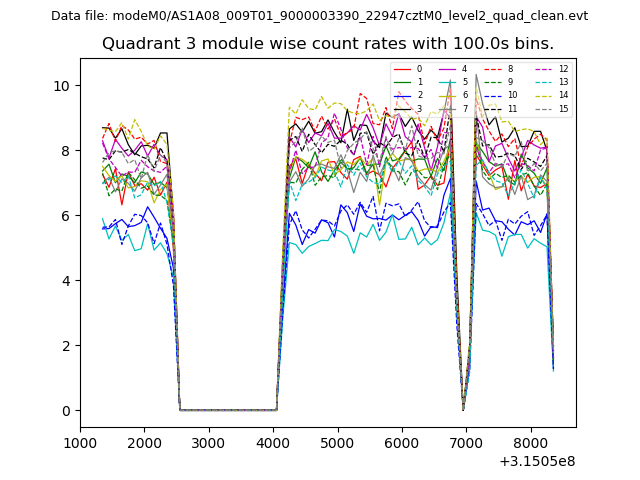
| Module-wise count rates for Quadrant C Data is divided into 100 sec bins |
 |
 |
| Module-wise count rates for Quadrant D Data is divided into 100 sec bins |
 |
 |
| Parameter | Plot |
|---|---|
| CZT HV Monitor | 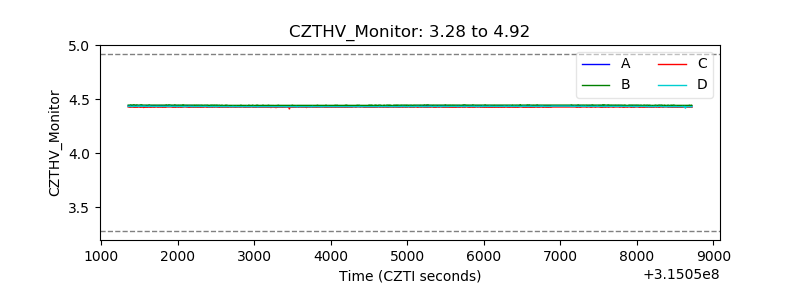 |
| D_VDD | 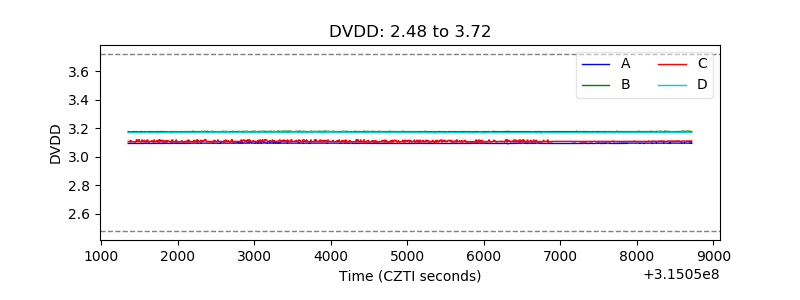 |
| Temperature 1 | 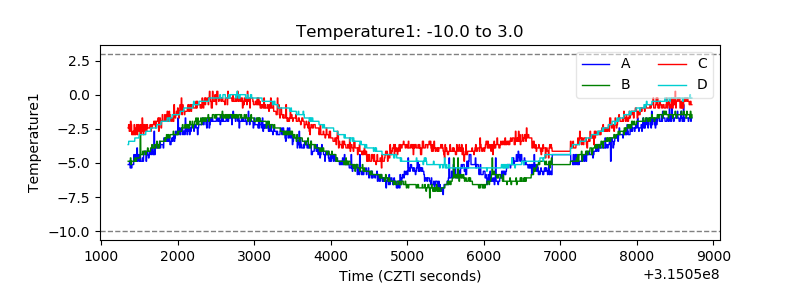 |
| Veto HV Monitor | 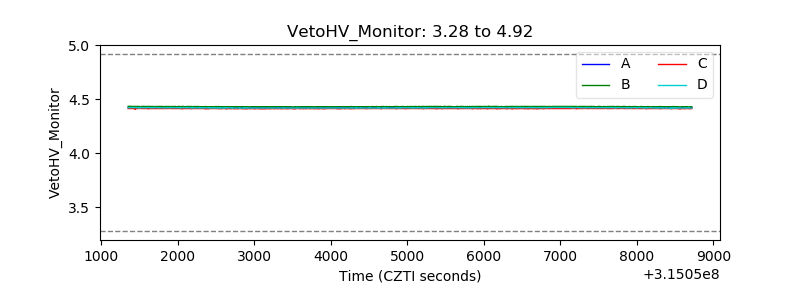 |
| Veto LLD | 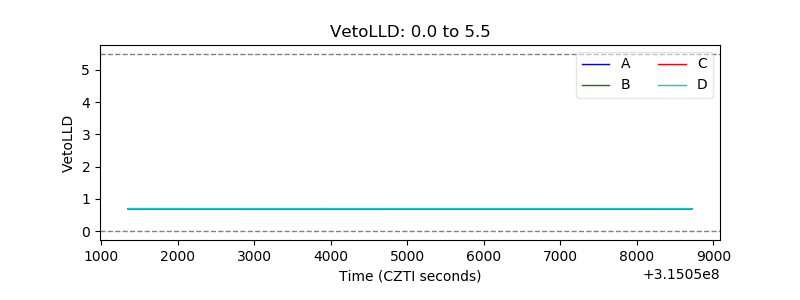 |
| Alpha Counter | 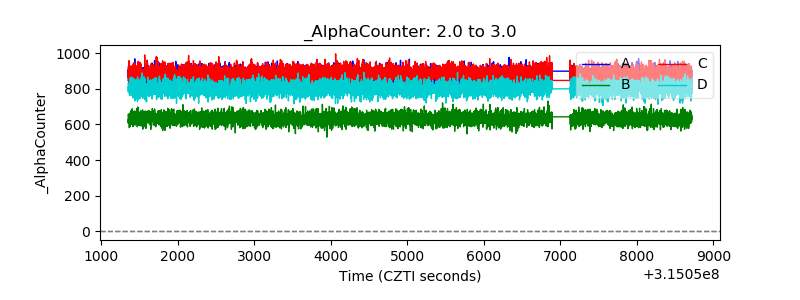 |
| _CPM_Rate | 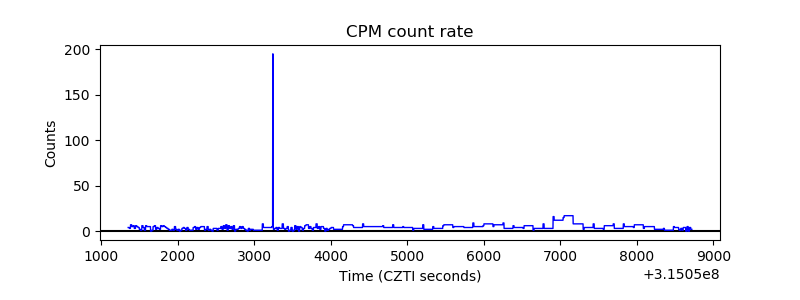 |
| CZT Counter | 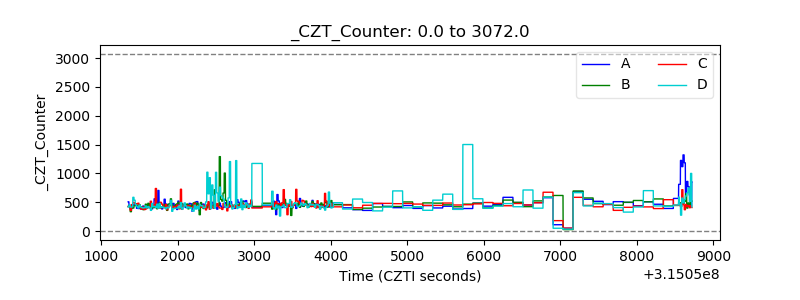 |
| +2.5 Volts monitor | 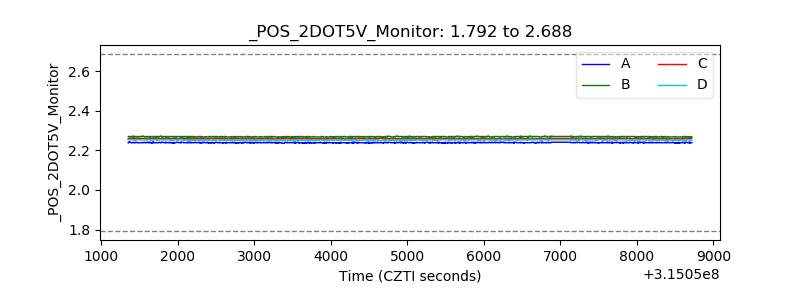 |
| +5 Volts monitor |  |
| _ROLL_ROT | 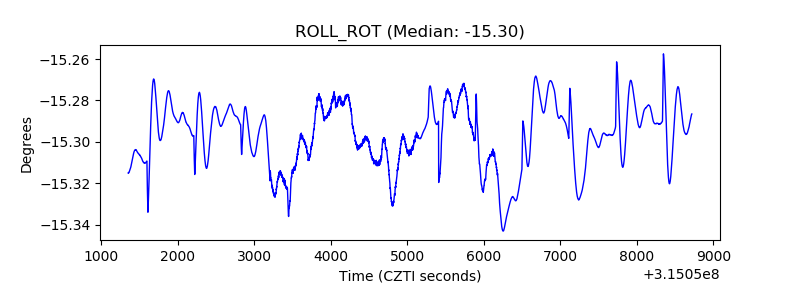 |
| _Roll_DEC | 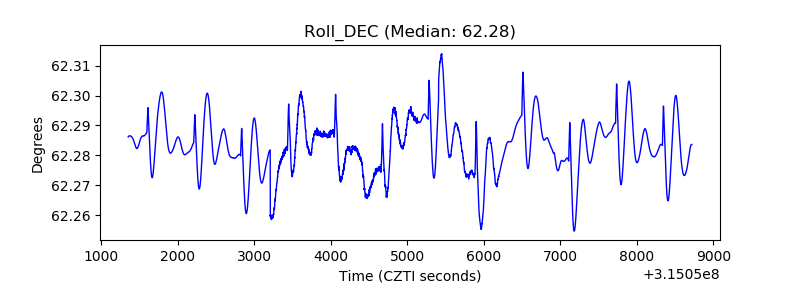 |
| _Roll_RA | 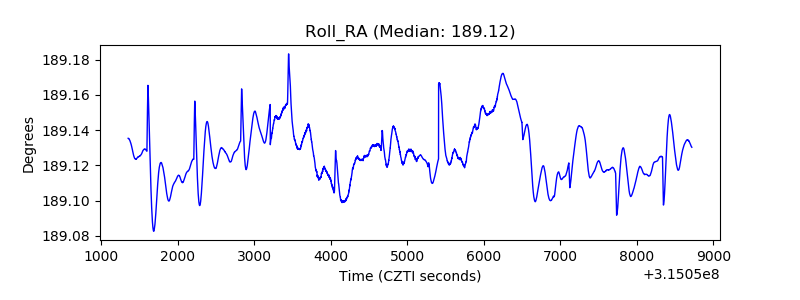 |
| Veto Counter | 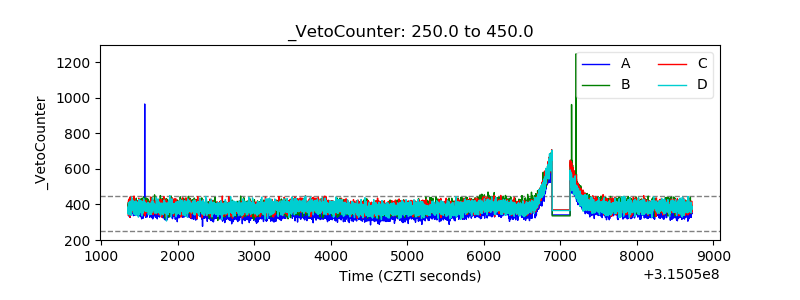 |