| Param | Original file | Final file |
|---|---|---|
| Filename | modeM0/AS1A08_009T01_9000003390_22948cztM0_level2.evt | modeM0/AS1A08_009T01_9000003390_22948cztM0_level2_quad_clean.evt |
| Size (bytes) | 599,725,440 | 86,518,080 |
| Size | 571.9 MB | 82.5 MB |
| Events in quadrant A | 3,507,994 | 558,837 |
| Events in quadrant B | 3,330,052 | 567,065 |
| Events in quadrant C | 3,224,959 | 540,612 |
| Events in quadrant D | 7,626,328 | 466,653 |
| Mode M9 | |||
|---|---|---|---|
| Quadrant | BADHDUFLAG | Total packets | Discarded packets |
| A | 0 | 4 | 0 |
| B | 0 | 4 | 0 |
| C | 0 | 4 | 0 |
| D | 0 | 4 | 0 |
| Mode SS | |||
|---|---|---|---|
| Quadrant | BADHDUFLAG | Total packets | Discarded packets |
| A | 0 | 142 | 0 |
| B | 0 | 142 | 0 |
| C | 0 | 142 | 0 |
| D | 0 | 142 | 0 |
| Mode M0 | |||
|---|---|---|---|
| Quadrant | BADHDUFLAG | Total packets | Discarded packets |
| A | 0 | 15082 | 1 |
| B | 0 | 14354 | 1 |
| C | 0 | 14186 | 1 |
| D | 0 | 27365 | 1 |
| Quadrant | Total seconds | Saturated seconds | Saturation percentage |
|---|---|---|---|
| A | 6977 | 94 | 1.347284% |
| B | 6977 | 96 | 1.375950% |
| C | 6978 | 105 | 1.504729% |
| D | 6977 | 1698 | 24.337108% |
Noise dominated data is calculated using 1-second bins in cleaned event files. If a bin has >2000 counts, and if more than 50% of those come from <1% of pixels, then it is considered to be noise-dominated and hence unusable.
| Quadrant | # 1 sec bins | Bins with >0 counts | Bins with >2000 counts | High rate bins dominated by noise | Noise dominated (total time) | Noise dominated (detector-on time) | Marked lightcurve |
|---|---|---|---|---|---|---|---|
| A | 7377 | 6978 | 1 | 1 | 0.01% | 0.01% | 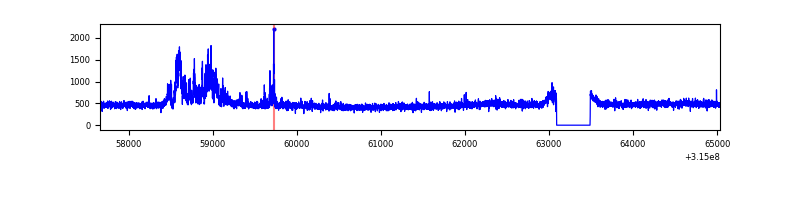 |
| B | 7377 | 6978 | 5 | 5 | 0.07% | 0.07% | 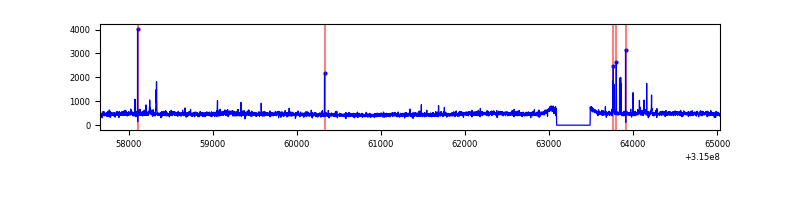 |
| C | 7378 | 6979 | 1 | 1 | 0.01% | 0.01% |  |
| D | 7377 | 6978 | 1366 | 1366 | 18.52% | 19.58% | 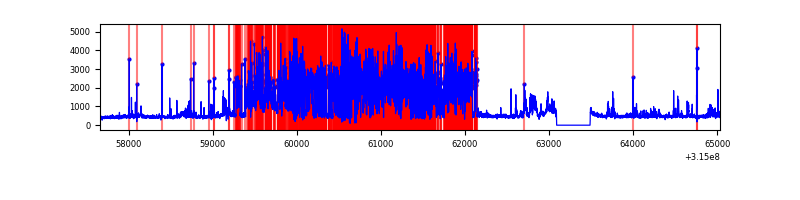 |
Top three noisy pixels from each quadrant. If the there are fewer than three noisy pixels in the level2.evt file, extra rows are filled as -1
| Pixel properties | Quadrant properties | ||||||
|---|---|---|---|---|---|---|---|
| Quadrant | DetID | PixID | Counts | Sigma | Mean | Median | Sigma |
| A | 14 | 238 | 289329 | 1725.29 | 823 | 804 | 167.2 |
| A | 13 | 170 | 43287 | 254.04 | 823 | 804 | 167.2 |
| A | 13 | 254 | 10741 | 59.42 | 823 | 804 | 167.2 |
| B | 0 | 189 | 53049 | 333.13 | 817 | 797 | 156.9 |
| B | 4 | 216 | 40274 | 251.68 | 817 | 797 | 156.9 |
| B | 0 | 190 | 32824 | 204.19 | 817 | 797 | 156.9 |
| C | 14 | 238 | 125453 | 676.54 | 783 | 784 | 184.3 |
| C | 8 | 208 | 22324 | 116.89 | 783 | 784 | 184.3 |
| C | 7 | 247 | 14627 | 75.12 | 783 | 784 | 184.3 |
| D | 7 | 238 | 3810758 | 21297.51 | 735 | 713 | 178.9 |
| D | 1 | 52 | 701690 | 3918.34 | 735 | 713 | 178.9 |
| D | 13 | 153 | 232911 | 1297.95 | 735 | 713 | 178.9 |
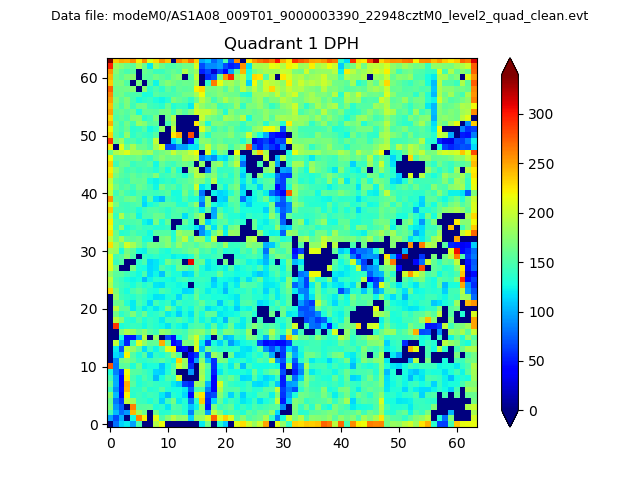
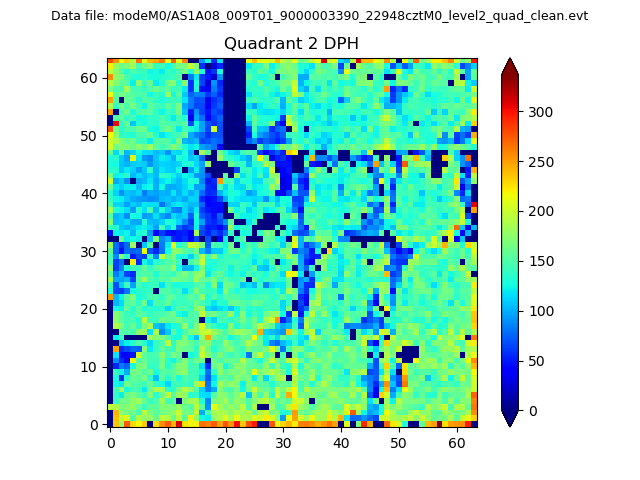
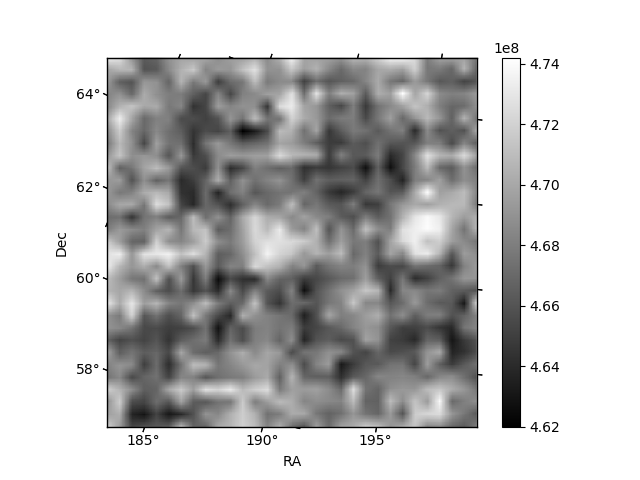
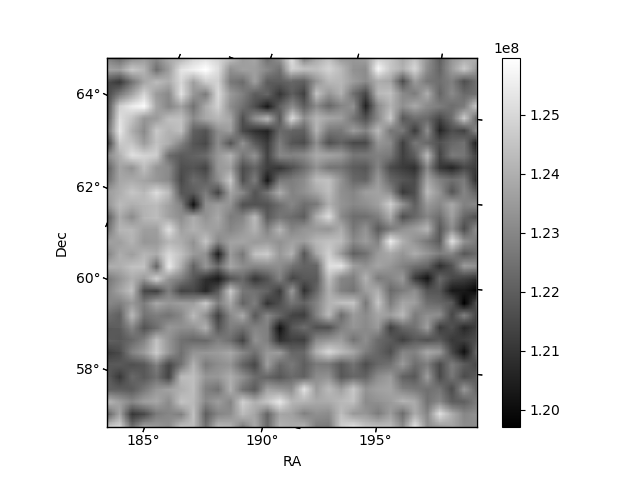
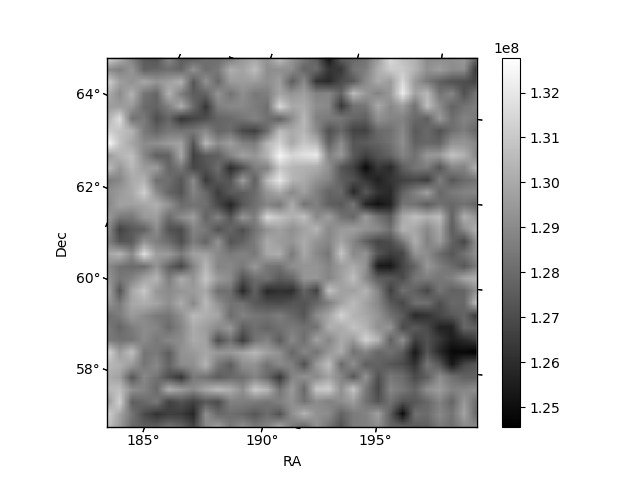
Histogram calculated using DETX and DETY for each event in the final _common_clean file
| Quadrant A | 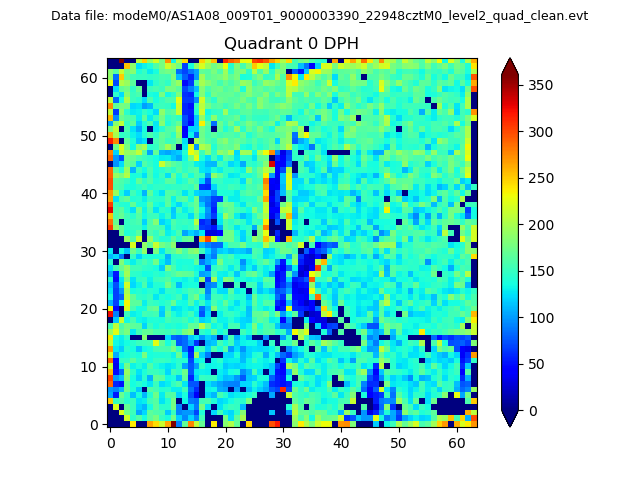 |
 |
Quadrant B |
|---|---|---|---|
| Quadrant D | 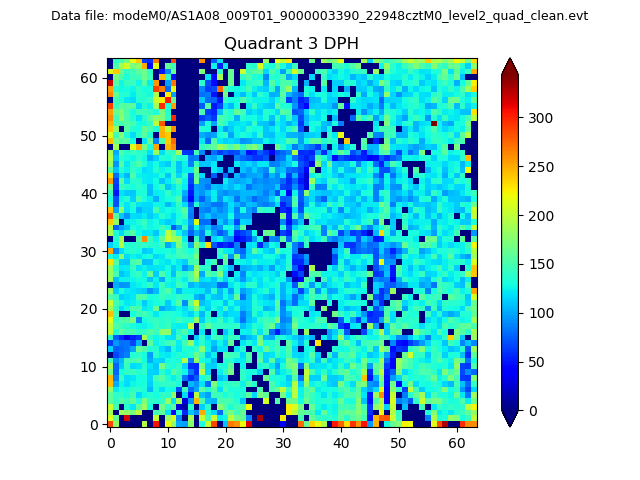 |
 |
Quadrant C |
| Plot type | Count rate plots | Images |
|---|---|---|
| Comparison with Poisson distribution Blue bars denote a histogram of data divided into 1 sec bins. Red curve is a Poisson curve with rate = median count rate of data. |
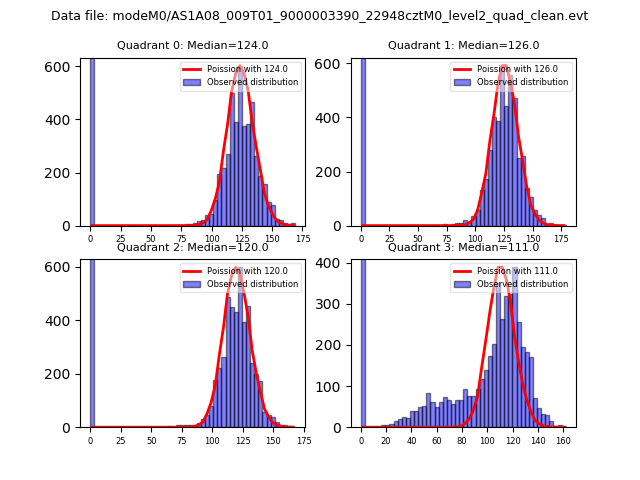 |
 |
| Quadrant-wise count rates Data is divided into 100 sec bins |
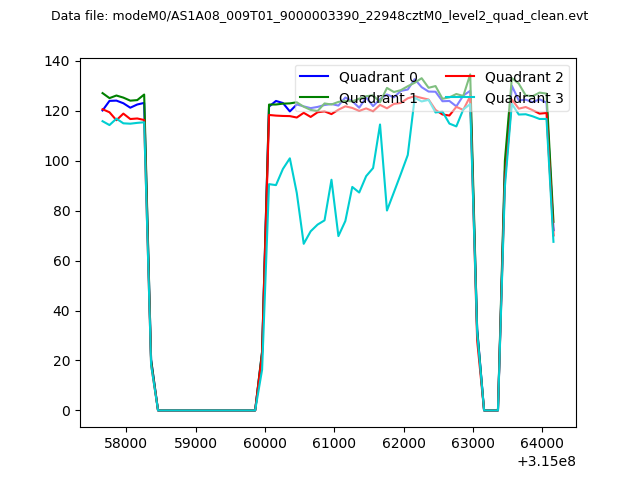 |
|
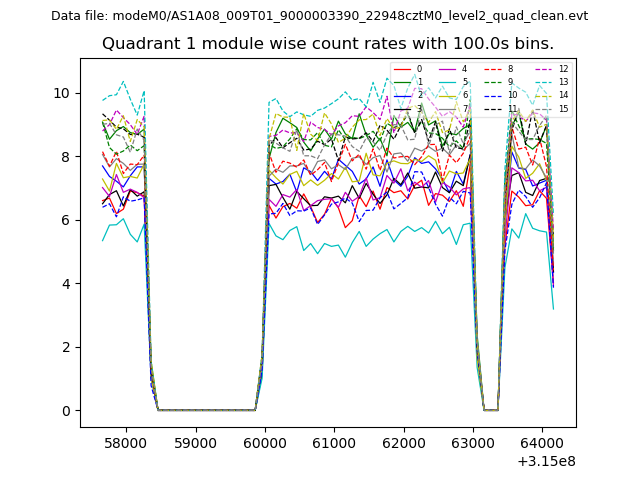
| Module-wise count rates for Quadrant A Data is divided into 100 sec bins |
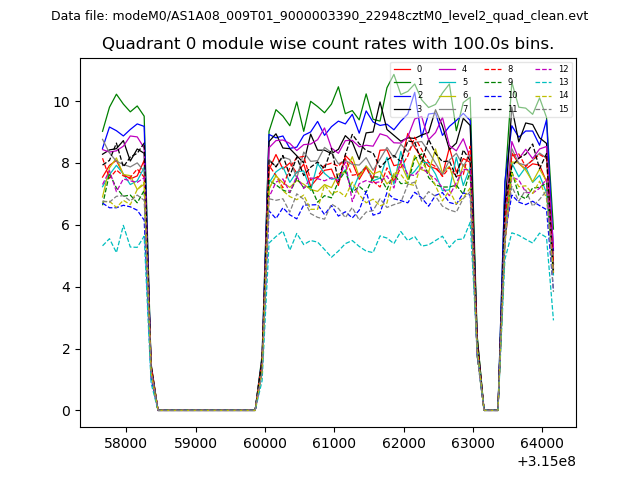 |
 |
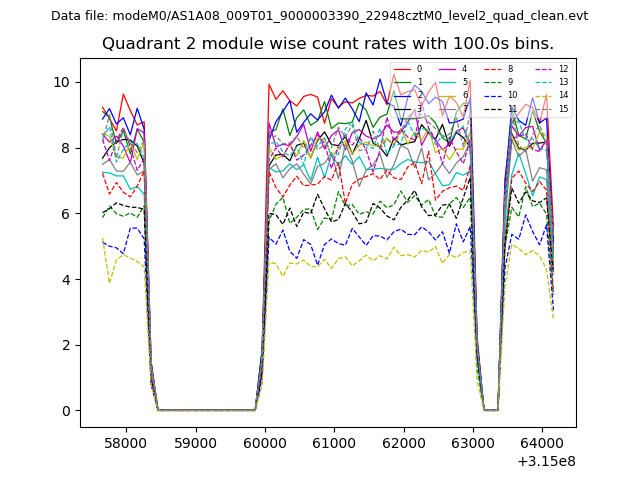
| Module-wise count rates for Quadrant B Data is divided into 100 sec bins |
 |
 |
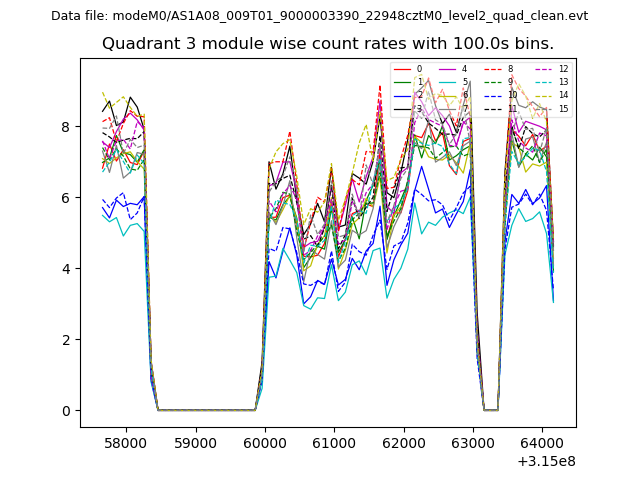
| Module-wise count rates for Quadrant C Data is divided into 100 sec bins |
 |
 |
| Module-wise count rates for Quadrant D Data is divided into 100 sec bins |
 |
 |
| Parameter | Plot |
|---|---|
| CZT HV Monitor | 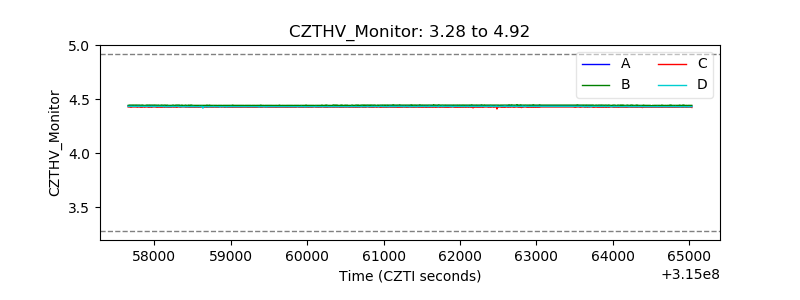 |
| D_VDD | 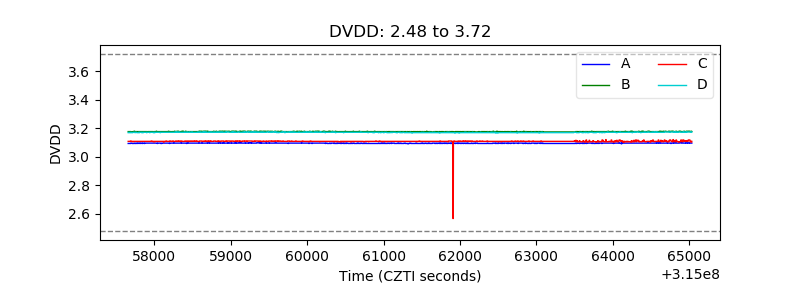 |
| Temperature 1 | 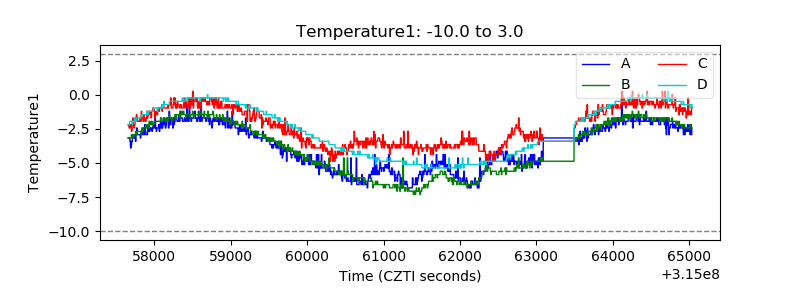 |
| Veto HV Monitor | 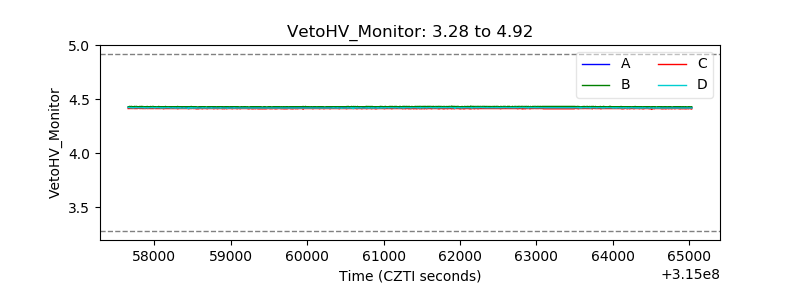 |
| Veto LLD | 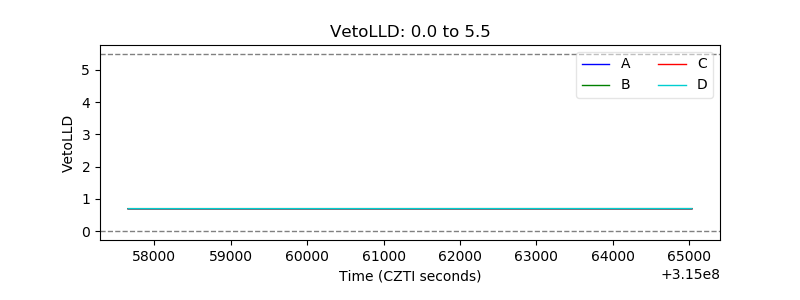 |
| Alpha Counter | 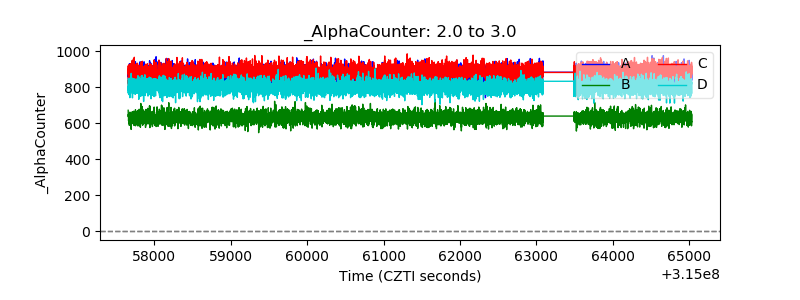 |
| _CPM_Rate | 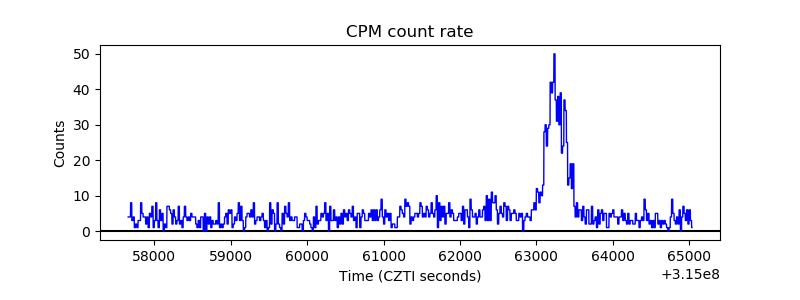 |
| CZT Counter | 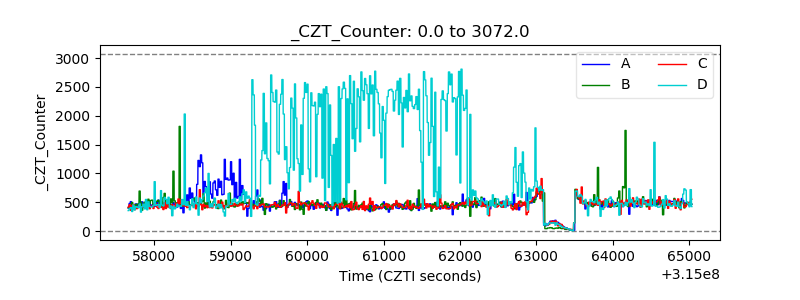 |
| +2.5 Volts monitor |  |
| +5 Volts monitor | 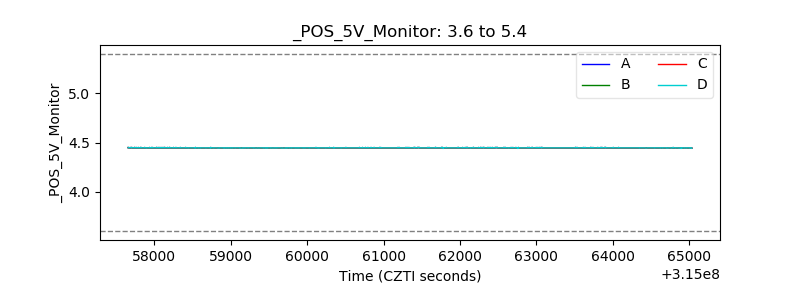 |
| _ROLL_ROT | 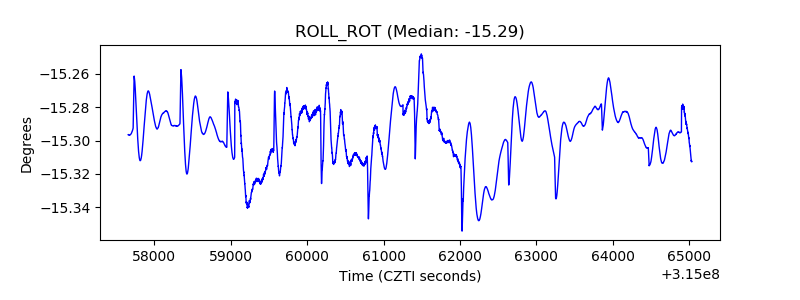 |
| _Roll_DEC | 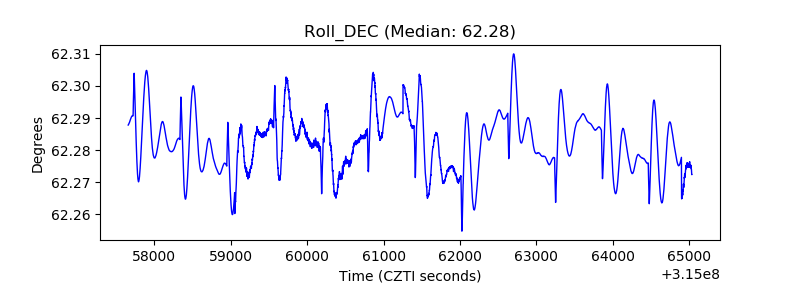 |
| _Roll_RA | 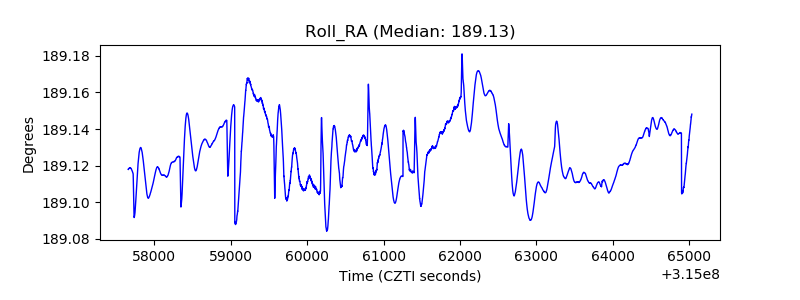 |
| Veto Counter | 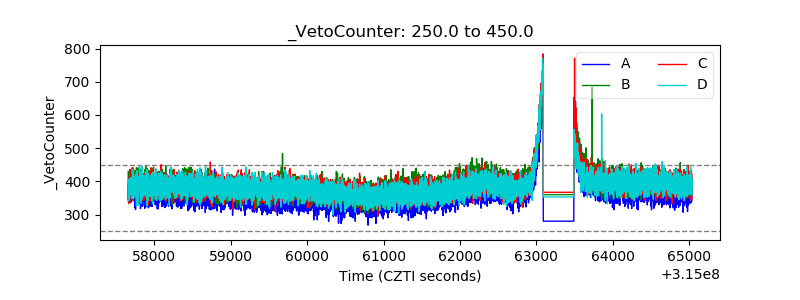 |