| Param | Original file | Final file |
|---|---|---|
| Filename | modeM0/AS1A08_009T01_9000003390_22950cztM0_level2.evt | modeM0/AS1A08_009T01_9000003390_22950cztM0_level2_quad_clean.evt |
| Size (bytes) | 857,024,640 | 154,005,120 |
| Size | 817.3 MB | 146.9 MB |
| Events in quadrant A | 5,936,729 | 962,015 |
| Events in quadrant B | 6,156,069 | 972,959 |
| Events in quadrant C | 5,908,604 | 935,747 |
| Events in quadrant D | 7,098,894 | 920,985 |
| Mode M9 | |||
|---|---|---|---|
| Quadrant | BADHDUFLAG | Total packets | Discarded packets |
| A | 0 | 13 | 0 |
| B | 0 | 13 | 0 |
| C | 0 | 13 | 0 |
| D | 0 | 13 | 0 |
| Mode SS | |||
|---|---|---|---|
| Quadrant | BADHDUFLAG | Total packets | Discarded packets |
| A | 0 | 256 | 0 |
| B | 0 | 256 | 0 |
| C | 0 | 256 | 0 |
| D | 0 | 256 | 0 |
| Mode M0 | |||
|---|---|---|---|
| Quadrant | BADHDUFLAG | Total packets | Discarded packets |
| A | 0 | 25935 | 2 |
| B | 0 | 26488 | 2 |
| C | 0 | 25763 | 3 |
| D | 0 | 29849 | 2 |
| Quadrant | Total seconds | Saturated seconds | Saturation percentage |
|---|---|---|---|
| A | 12620 | 108 | 0.855784% |
| B | 12621 | 165 | 1.307345% |
| C | 12620 | 179 | 1.418384% |
| D | 12620 | 340 | 2.694136% |
Noise dominated data is calculated using 1-second bins in cleaned event files. If a bin has >2000 counts, and if more than 50% of those come from <1% of pixels, then it is considered to be noise-dominated and hence unusable.
| Quadrant | # 1 sec bins | Bins with >0 counts | Bins with >2000 counts | High rate bins dominated by noise | Noise dominated (total time) | Noise dominated (detector-on time) | Marked lightcurve |
|---|---|---|---|---|---|---|---|
| A | 13920 | 12622 | 0 | 0 | 0.00% | 0.00% | 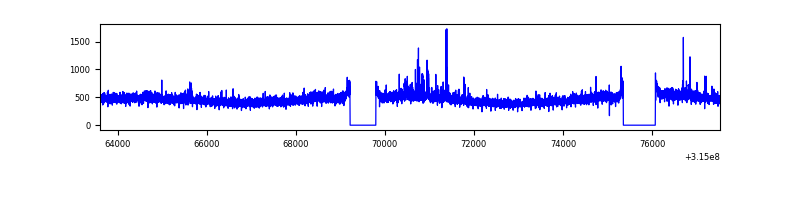 |
| B | 13921 | 12623 | 33 | 33 | 0.24% | 0.26% | 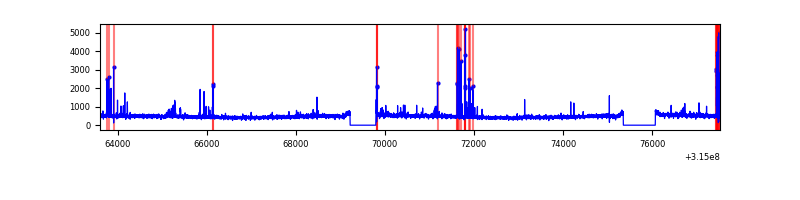 |
| C | 13920 | 12622 | 14 | 14 | 0.10% | 0.11% | 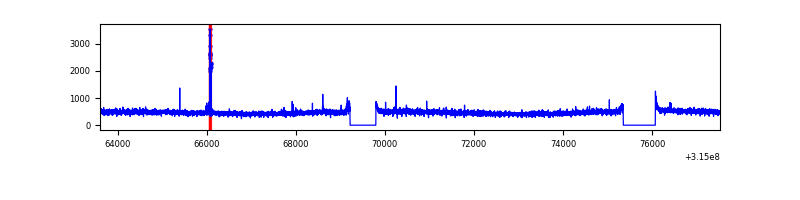 |
| D | 13920 | 12622 | 162 | 162 | 1.16% | 1.28% | 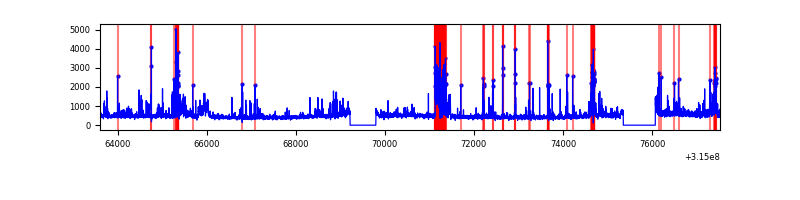 |
Top three noisy pixels from each quadrant. If the there are fewer than three noisy pixels in the level2.evt file, extra rows are filled as -1
| Pixel properties | Quadrant properties | ||||||
|---|---|---|---|---|---|---|---|
| Quadrant | DetID | PixID | Counts | Sigma | Mean | Median | Sigma |
| A | 13 | 170 | 148908 | 487.85 | 1498 | 1465 | 302.2 |
| A | 13 | 254 | 19571 | 59.91 | 1498 | 1465 | 302.2 |
| A | 3 | 137 | 13264 | 39.04 | 1498 | 1465 | 302.2 |
| B | 4 | 216 | 169388 | 592.66 | 1486 | 1447 | 283.4 |
| B | 0 | 190 | 88448 | 307.03 | 1486 | 1447 | 283.4 |
| B | 0 | 189 | 53312 | 183.03 | 1486 | 1447 | 283.4 |
| C | 14 | 238 | 228210 | 678.36 | 1431 | 1439 | 334.3 |
| C | 10 | 22 | 46380 | 134.44 | 1431 | 1439 | 334.3 |
| C | 8 | 208 | 24061 | 67.67 | 1431 | 1439 | 334.3 |
| D | 1 | 52 | 610339 | 1733.16 | 1445 | 1400 | 351.3 |
| D | 13 | 153 | 346746 | 982.92 | 1445 | 1400 | 351.3 |
| D | 13 | 172 | 333215 | 944.41 | 1445 | 1400 | 351.3 |
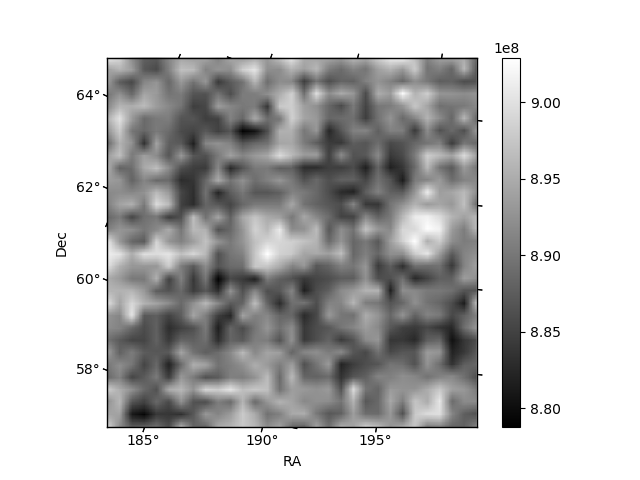
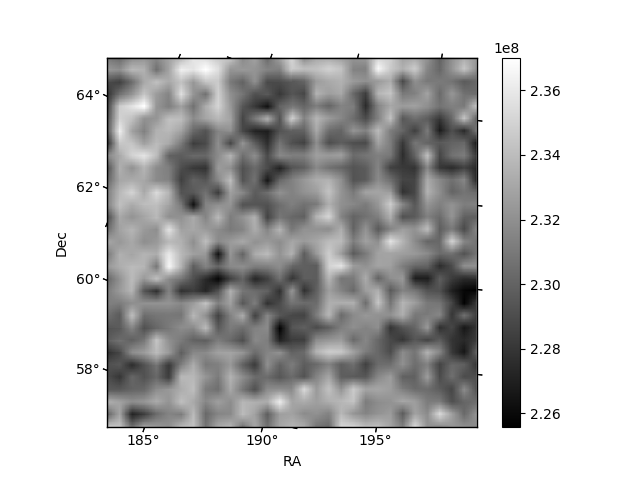
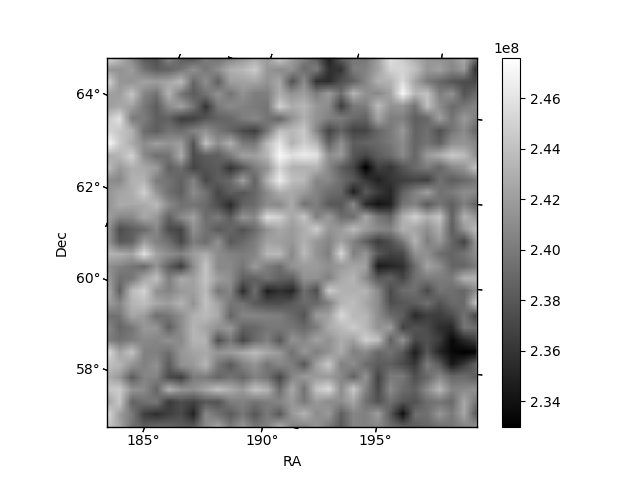
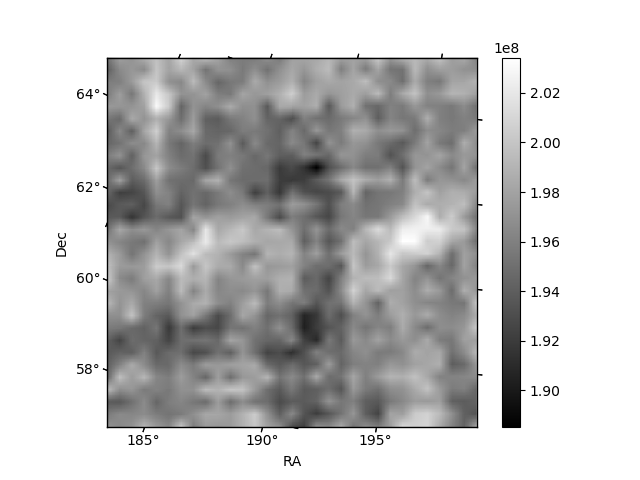
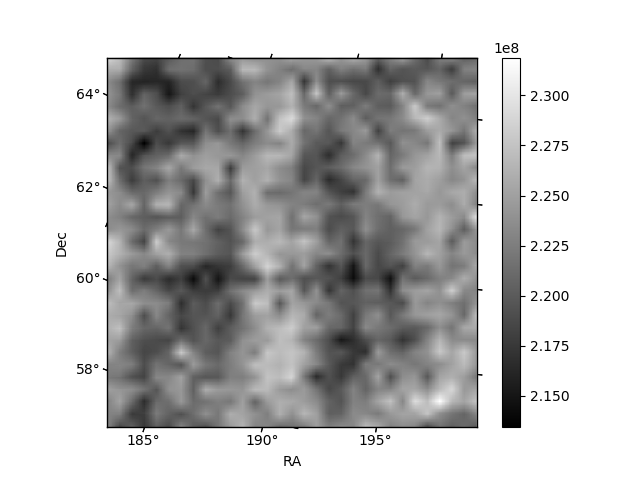
Histogram calculated using DETX and DETY for each event in the final _common_clean file
| Quadrant A | 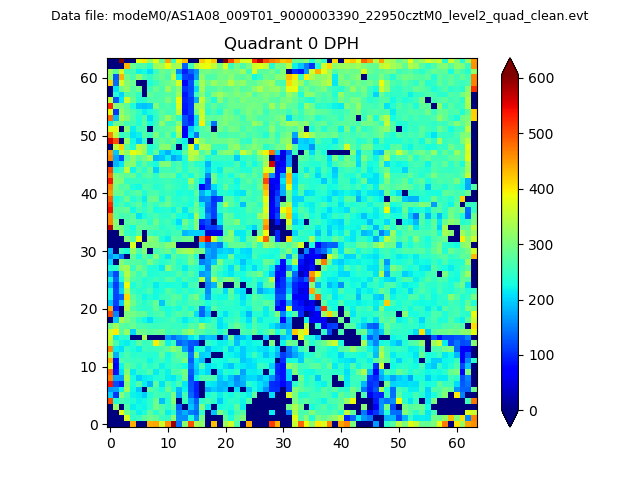 |
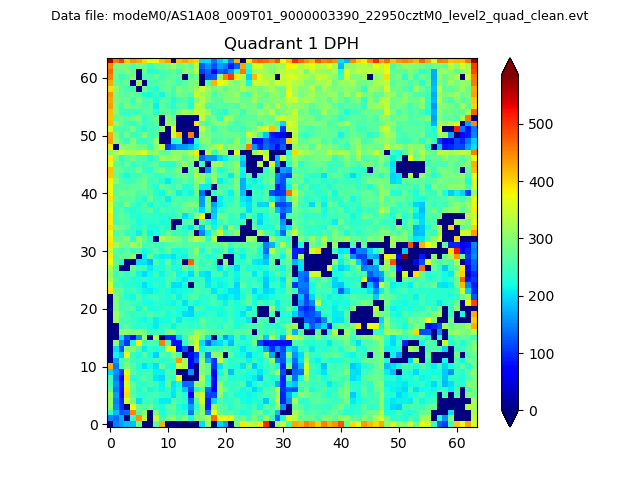 |
Quadrant B |
|---|---|---|---|
| Quadrant D | 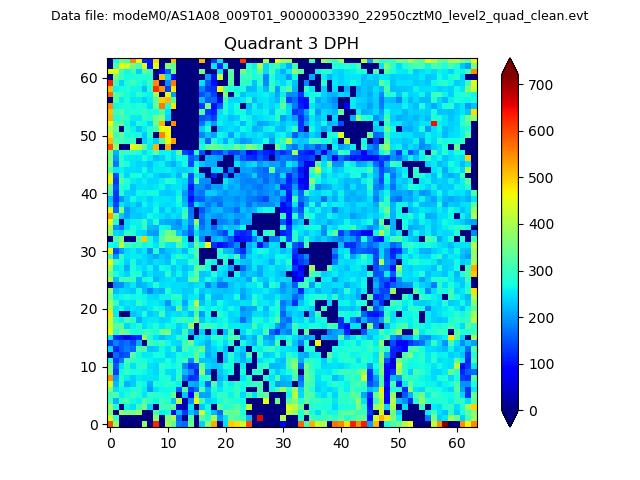 |
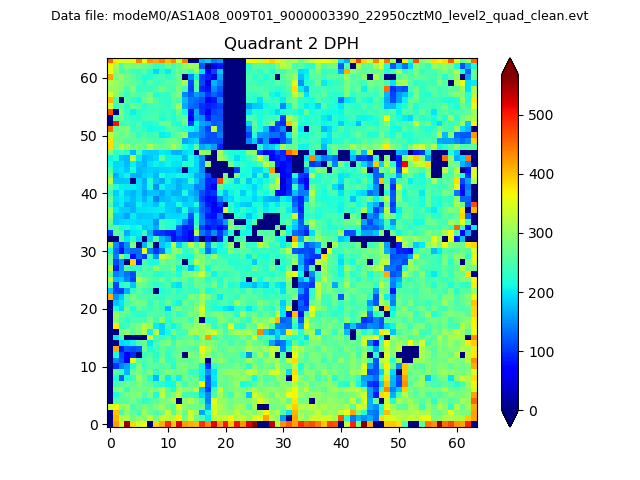 |
Quadrant C |
| Plot type | Count rate plots | Images |
|---|---|---|
| Comparison with Poisson distribution Blue bars denote a histogram of data divided into 1 sec bins. Red curve is a Poisson curve with rate = median count rate of data. |
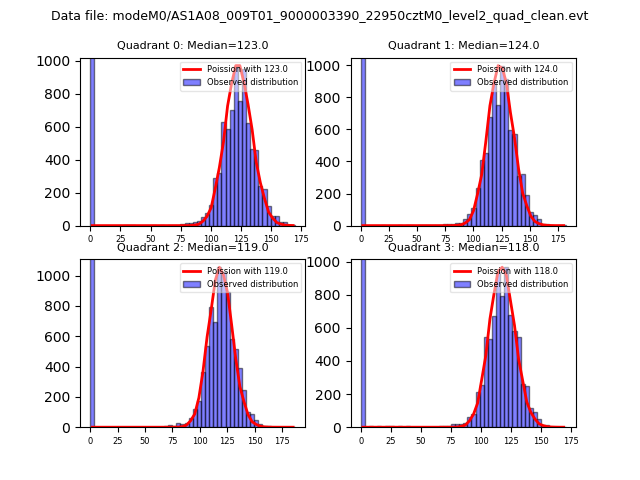 |
 |
| Quadrant-wise count rates Data is divided into 100 sec bins |
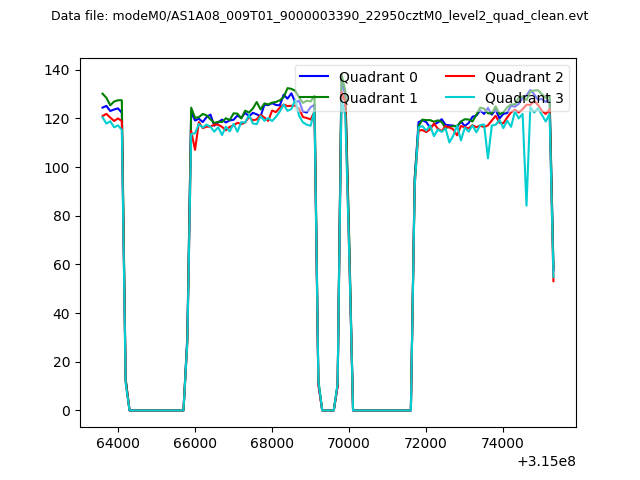 |
|
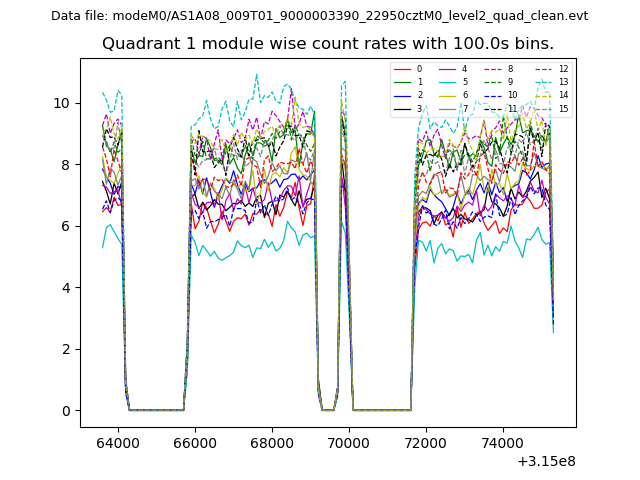
| Module-wise count rates for Quadrant A Data is divided into 100 sec bins |
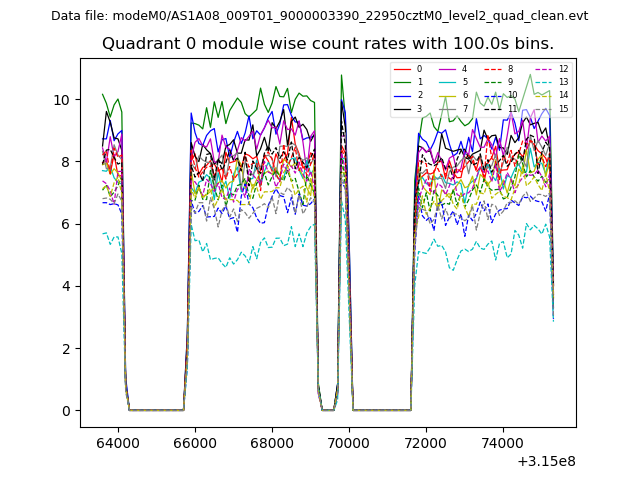 |
 |
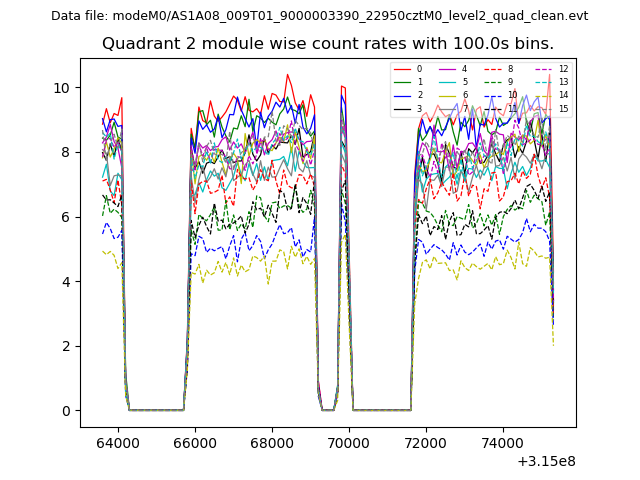
| Module-wise count rates for Quadrant B Data is divided into 100 sec bins |
 |
 |
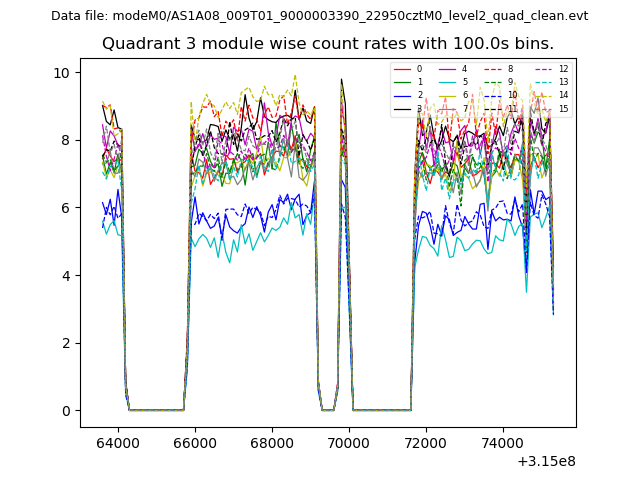
| Module-wise count rates for Quadrant C Data is divided into 100 sec bins |
 |
 |
| Module-wise count rates for Quadrant D Data is divided into 100 sec bins |
 |
 |
| Parameter | Plot |
|---|---|
| CZT HV Monitor | 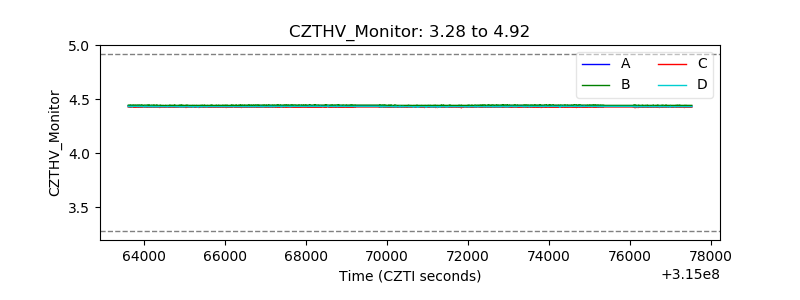 |
| D_VDD | 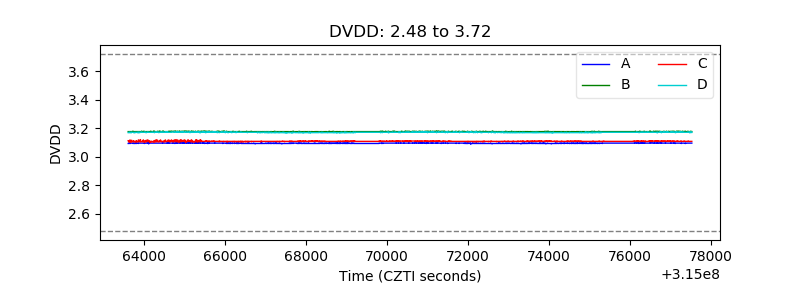 |
| Temperature 1 | 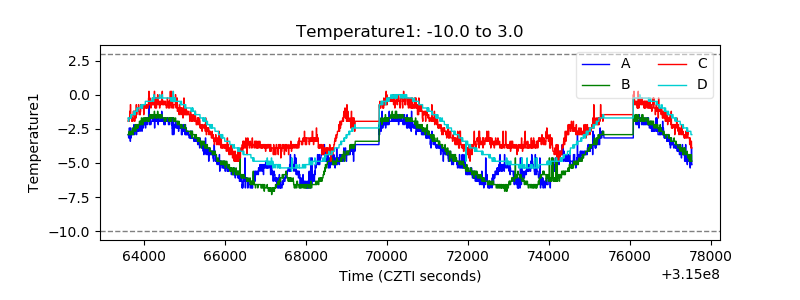 |
| Veto HV Monitor |  |
| Veto LLD | 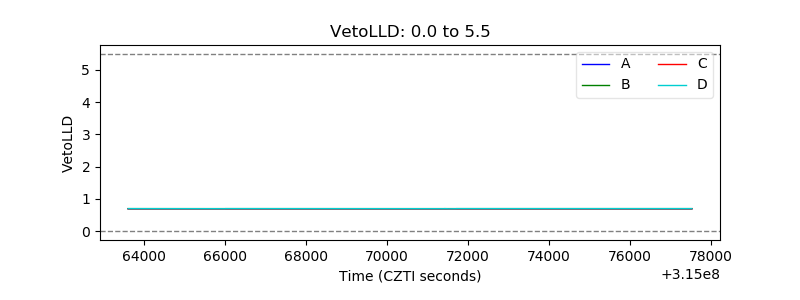 |
| Alpha Counter | 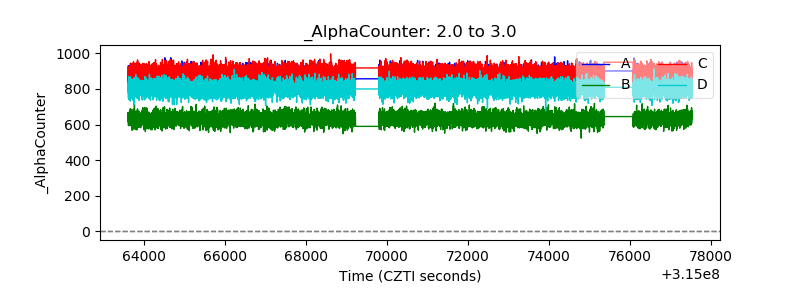 |
| _CPM_Rate | 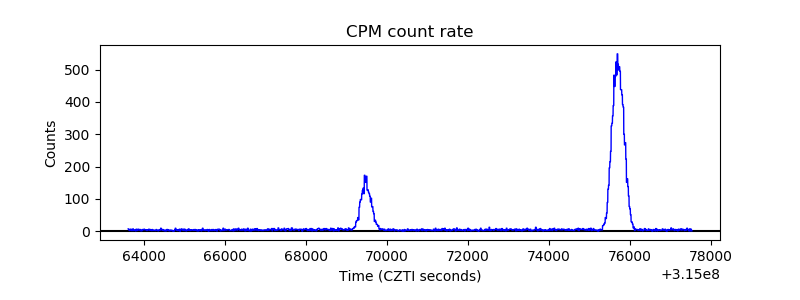 |
| CZT Counter | 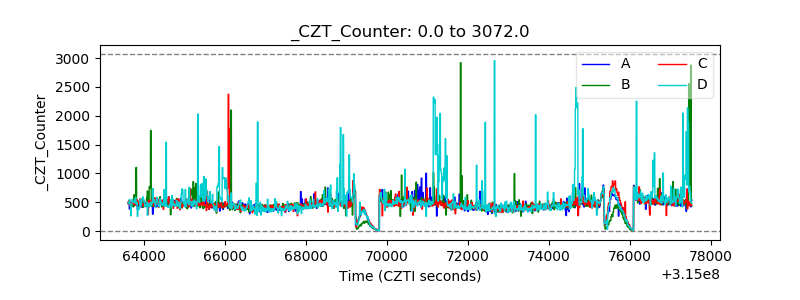 |
| +2.5 Volts monitor |  |
| +5 Volts monitor |  |
| _ROLL_ROT | 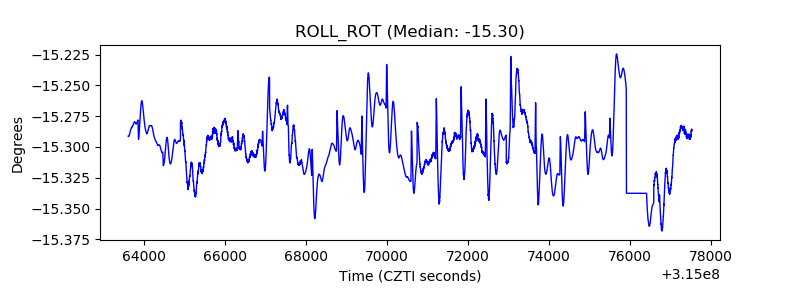 |
| _Roll_DEC | 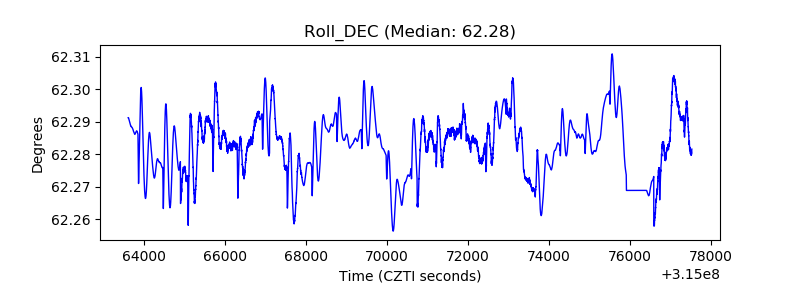 |
| _Roll_RA | 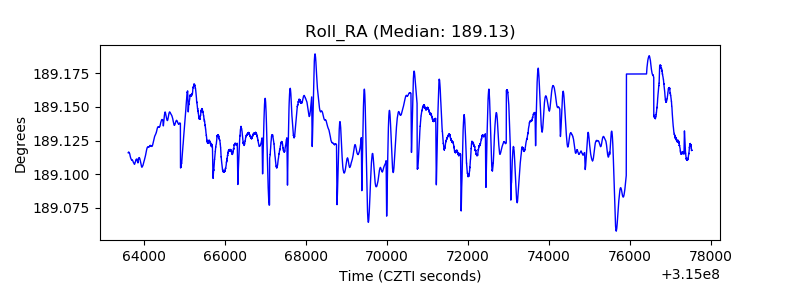 |
| Veto Counter | 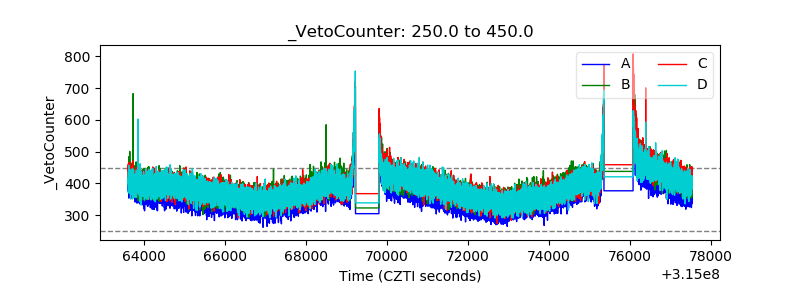 |