| Param | Original file | Final file |
|---|---|---|
| Filename | modeM0/AS1A08_009T01_9000003390_22951cztM0_level2.evt | modeM0/AS1A08_009T01_9000003390_22951cztM0_level2_quad_clean.evt |
| Size (bytes) | 465,488,640 | 82,270,080 |
| Size | 443.9 MB | 78.5 MB |
| Events in quadrant A | 2,969,174 | 520,341 |
| Events in quadrant B | 3,141,970 | 525,193 |
| Events in quadrant C | 3,003,485 | 507,798 |
| Events in quadrant D | 4,549,124 | 492,577 |
| Mode M9 | |||
|---|---|---|---|
| Quadrant | BADHDUFLAG | Total packets | Discarded packets |
| A | 0 | 9 | 0 |
| B | 0 | 9 | 0 |
| C | 0 | 9 | 0 |
| D | 0 | 9 | 0 |
| Mode SS | |||
|---|---|---|---|
| Quadrant | BADHDUFLAG | Total packets | Discarded packets |
| A | 0 | 130 | 0 |
| B | 0 | 130 | 0 |
| C | 0 | 130 | 0 |
| D | 0 | 130 | 0 |
| Mode M0 | |||
|---|---|---|---|
| Quadrant | BADHDUFLAG | Total packets | Discarded packets |
| A | 0 | 13096 | 1 |
| B | 0 | 13524 | 1 |
| C | 0 | 13118 | 1 |
| D | 0 | 18086 | 1 |
| Quadrant | Total seconds | Saturated seconds | Saturation percentage |
|---|---|---|---|
| A | 6380 | 33 | 0.517241% |
| B | 6381 | 79 | 1.238050% |
| C | 6380 | 72 | 1.128527% |
| D | 6380 | 469 | 7.351097% |
Noise dominated data is calculated using 1-second bins in cleaned event files. If a bin has >2000 counts, and if more than 50% of those come from <1% of pixels, then it is considered to be noise-dominated and hence unusable.
| Quadrant | # 1 sec bins | Bins with >0 counts | Bins with >2000 counts | High rate bins dominated by noise | Noise dominated (total time) | Noise dominated (detector-on time) | Marked lightcurve |
|---|---|---|---|---|---|---|---|
| A | 7275 | 6381 | 0 | 0 | 0.00% | 0.00% | 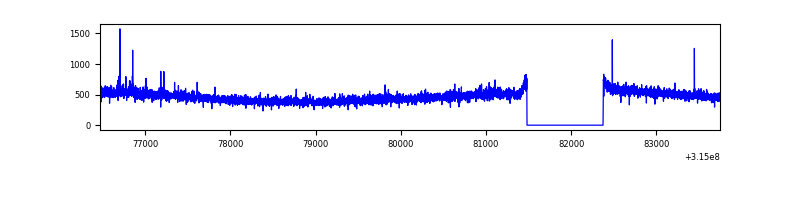 |
| B | 7276 | 6382 | 27 | 27 | 0.37% | 0.42% | 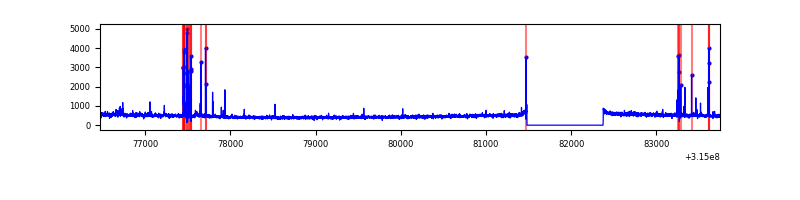 |
| C | 7275 | 6381 | 0 | 0 | 0.00% | 0.00% | 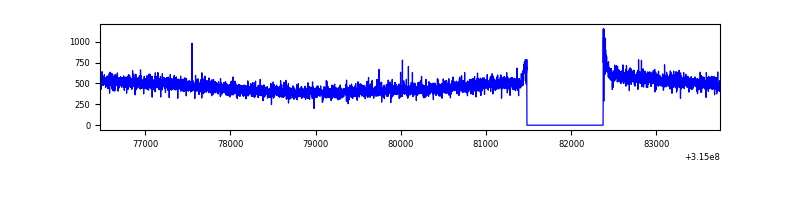 |
| D | 7275 | 6381 | 264 | 264 | 3.63% | 4.14% | 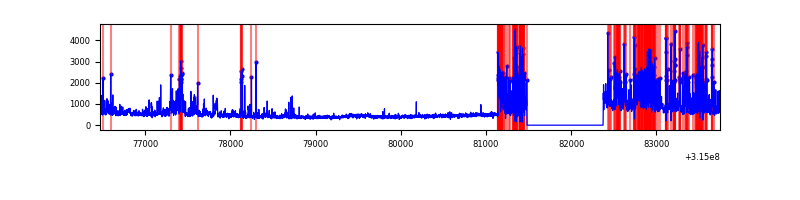 |
Top three noisy pixels from each quadrant. If the there are fewer than three noisy pixels in the level2.evt file, extra rows are filled as -1
| Pixel properties | Quadrant properties | ||||||
|---|---|---|---|---|---|---|---|
| Quadrant | DetID | PixID | Counts | Sigma | Mean | Median | Sigma |
| A | 13 | 170 | 16166 | 99.18 | 764 | 747 | 155.5 |
| A | 13 | 254 | 10298 | 61.44 | 764 | 747 | 155.5 |
| A | 3 | 137 | 6596 | 37.62 | 764 | 747 | 155.5 |
| B | 4 | 216 | 132502 | 909.0 | 759 | 738 | 145.0 |
| B | 0 | 189 | 19324 | 128.22 | 759 | 738 | 145.0 |
| B | 12 | 111 | 17304 | 114.28 | 759 | 738 | 145.0 |
| C | 14 | 238 | 115799 | 668.76 | 737 | 742 | 172.0 |
| C | 0 | 10 | 7121 | 37.08 | 737 | 742 | 172.0 |
| C | 13 | 61 | 5208 | 25.96 | 737 | 742 | 172.0 |
| D | 1 | 52 | 1123069 | 6304.46 | 730 | 708 | 178.0 |
| D | 13 | 153 | 291487 | 1633.34 | 730 | 708 | 178.0 |
| D | 13 | 172 | 207256 | 1160.21 | 730 | 708 | 178.0 |
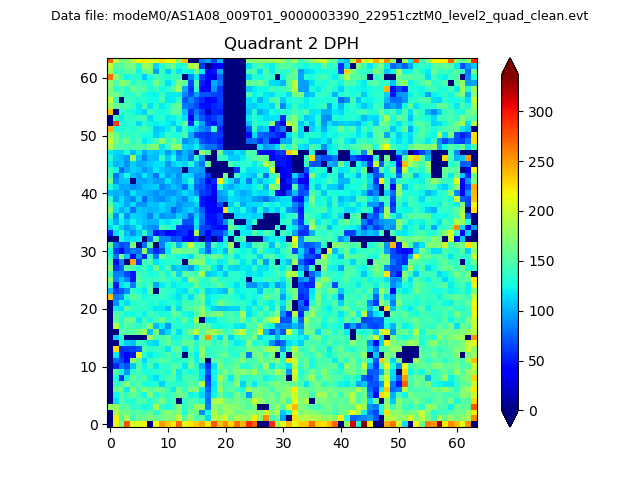
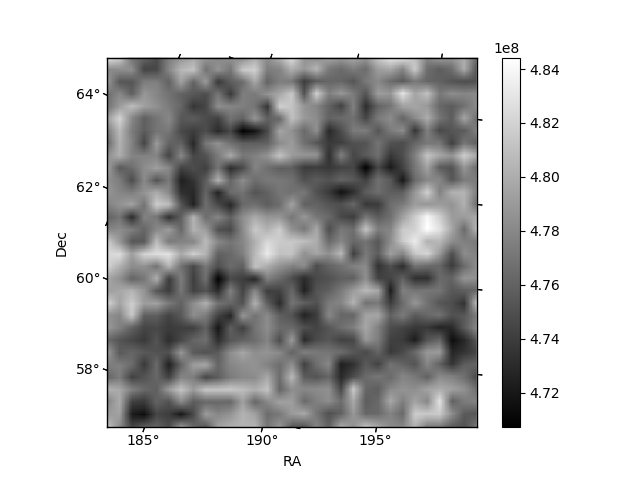
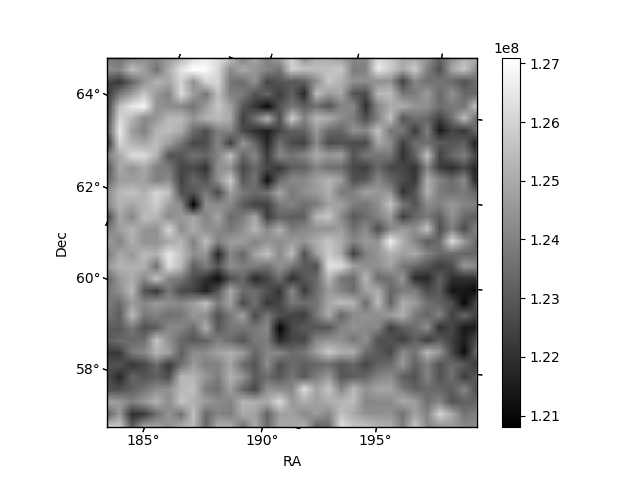
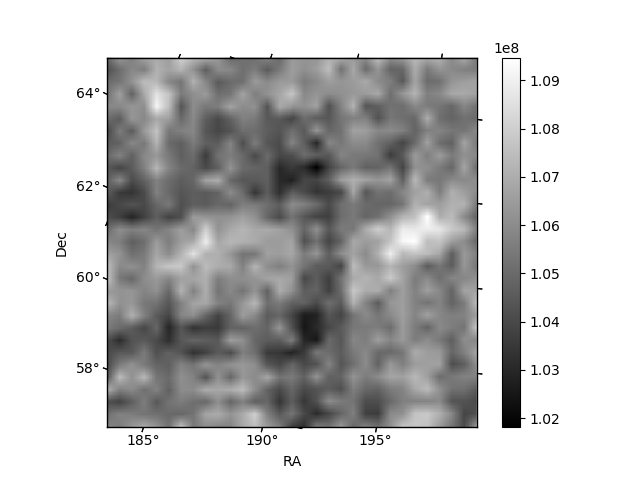
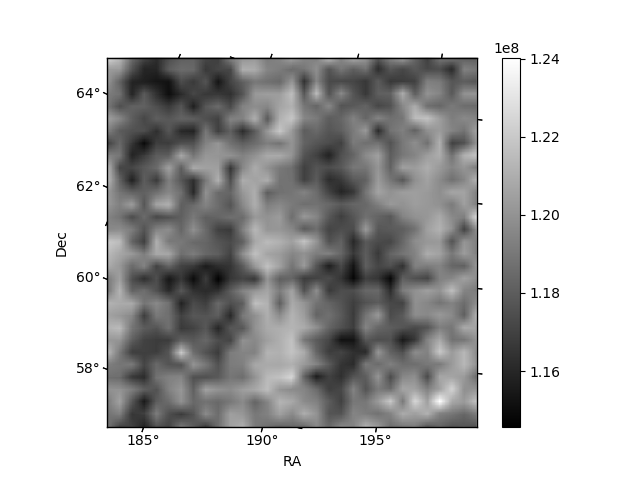
Histogram calculated using DETX and DETY for each event in the final _common_clean file
| Quadrant A | 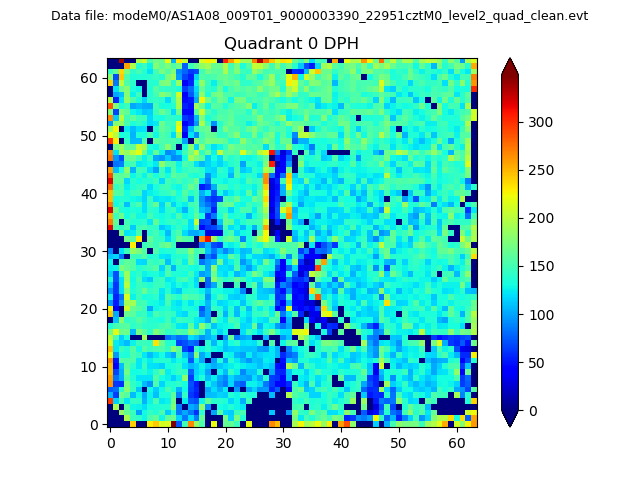 |
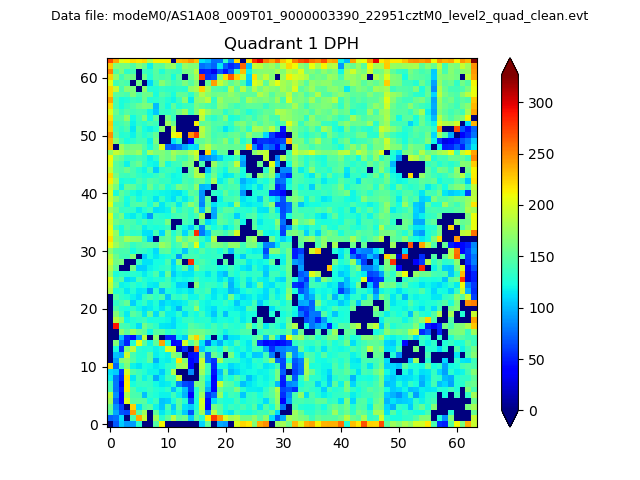 |
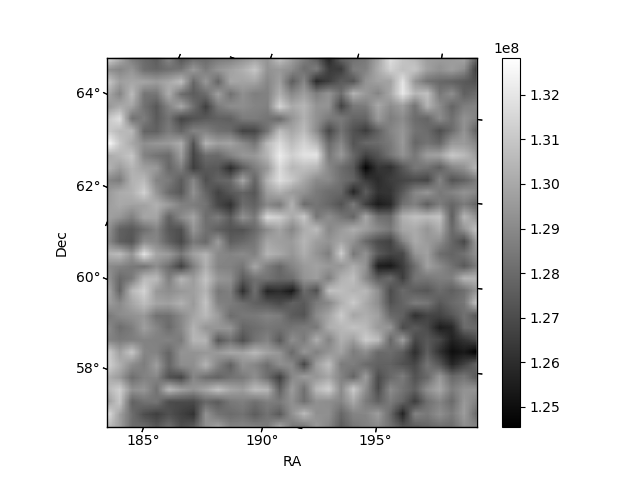
Quadrant B |
|---|---|---|---|
| Quadrant D | 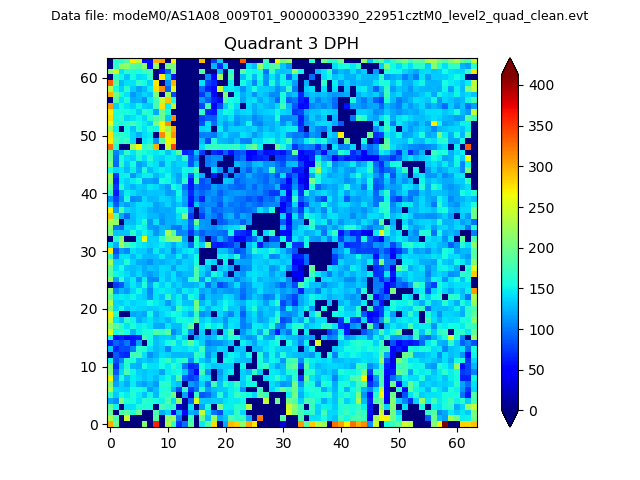 |
 |
Quadrant C |
| Plot type | Count rate plots | Images |
|---|---|---|
| Comparison with Poisson distribution Blue bars denote a histogram of data divided into 1 sec bins. Red curve is a Poisson curve with rate = median count rate of data. |
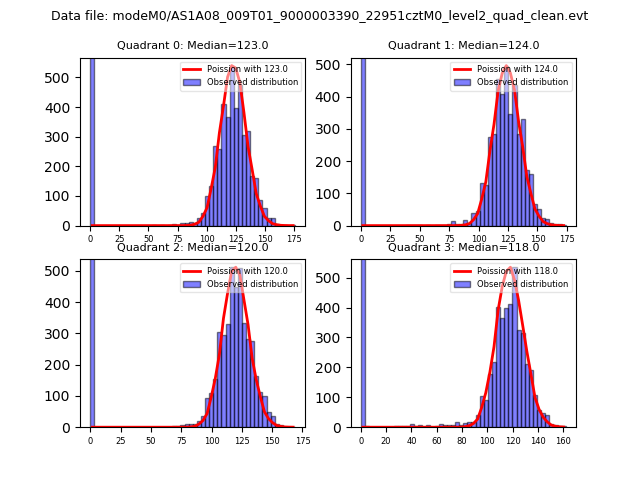 |
 |
| Quadrant-wise count rates Data is divided into 100 sec bins |
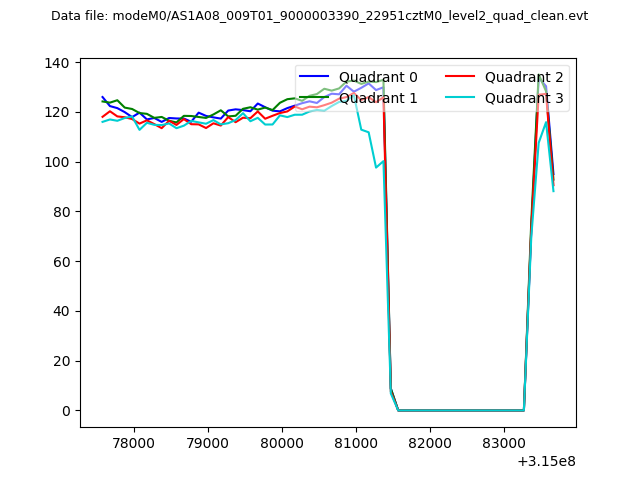 |
|
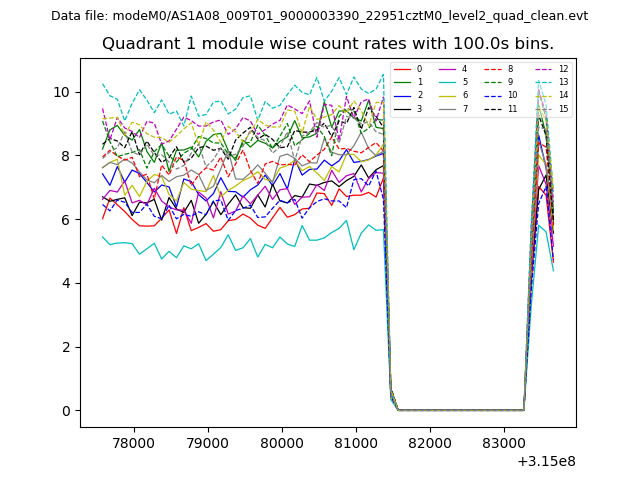
| Module-wise count rates for Quadrant A Data is divided into 100 sec bins |
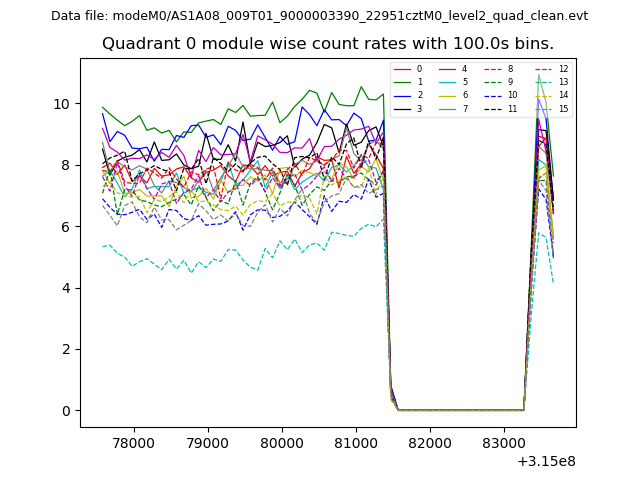 |
 |
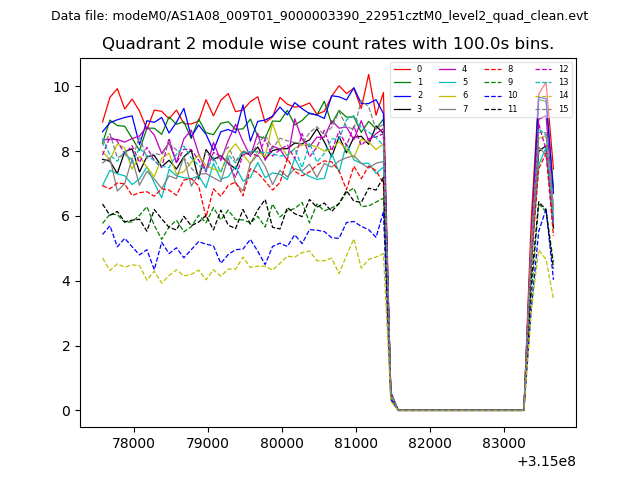
| Module-wise count rates for Quadrant B Data is divided into 100 sec bins |
 |
 |
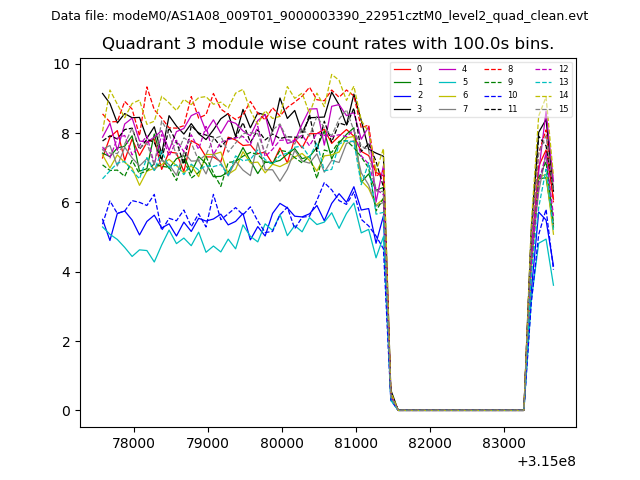
| Module-wise count rates for Quadrant C Data is divided into 100 sec bins |
 |
 |
| Module-wise count rates for Quadrant D Data is divided into 100 sec bins |
 |
 |
| Parameter | Plot |
|---|---|
| CZT HV Monitor | 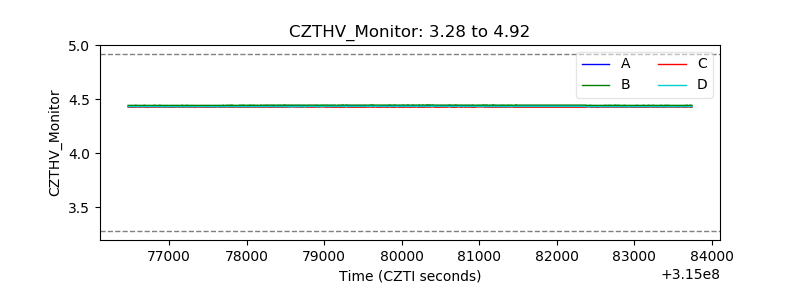 |
| D_VDD | 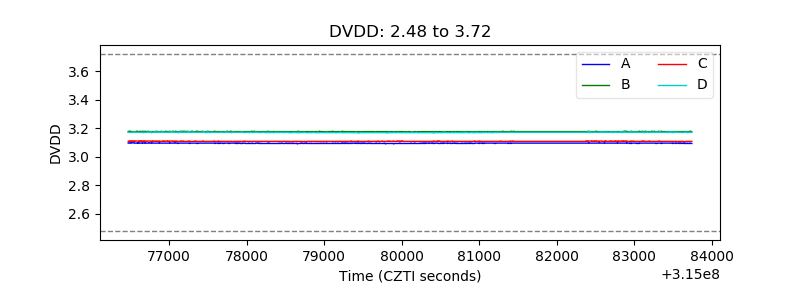 |
| Temperature 1 | 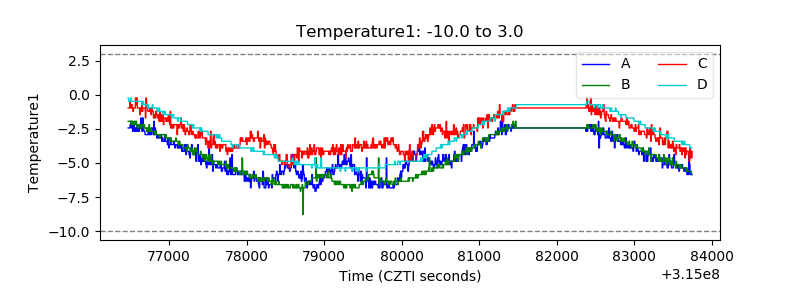 |
| Veto HV Monitor | 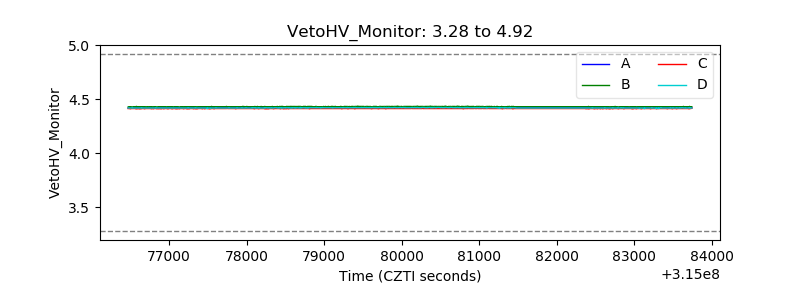 |
| Veto LLD | 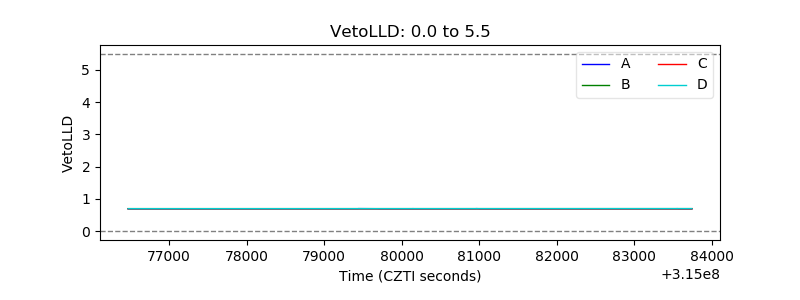 |
| Alpha Counter | 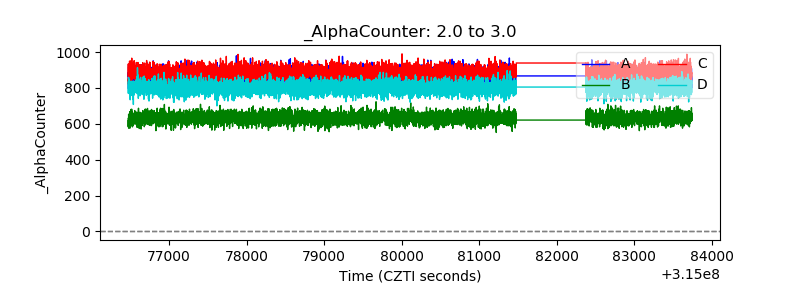 |
| _CPM_Rate | 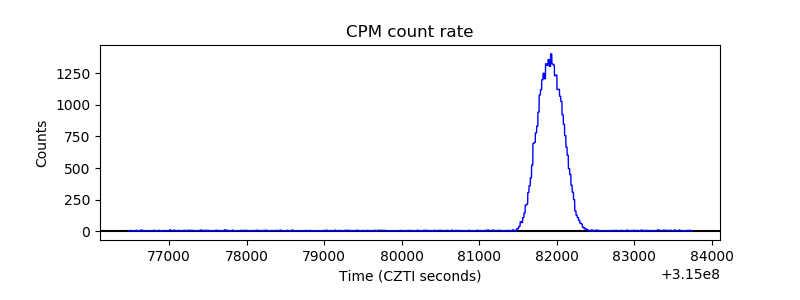 |
| CZT Counter | 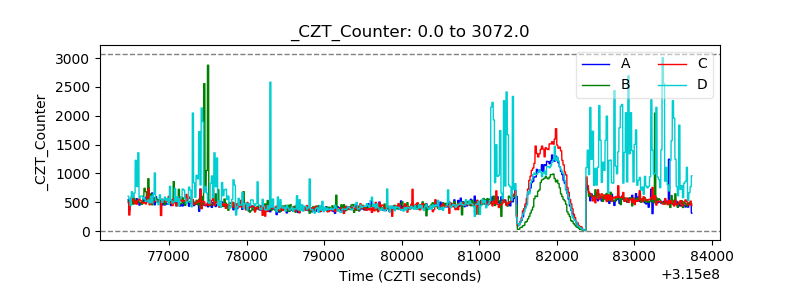 |
| +2.5 Volts monitor |  |
| +5 Volts monitor |  |
| _ROLL_ROT | 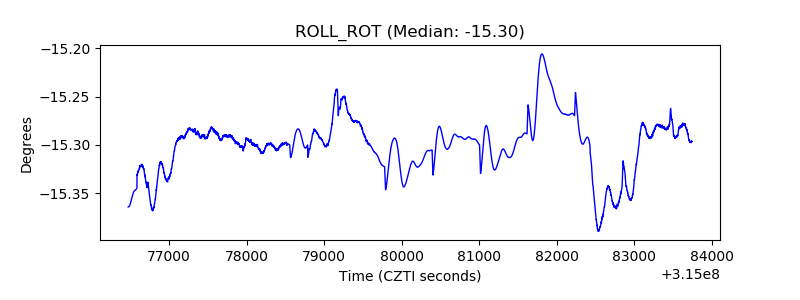 |
| _Roll_DEC |  |
| _Roll_RA | 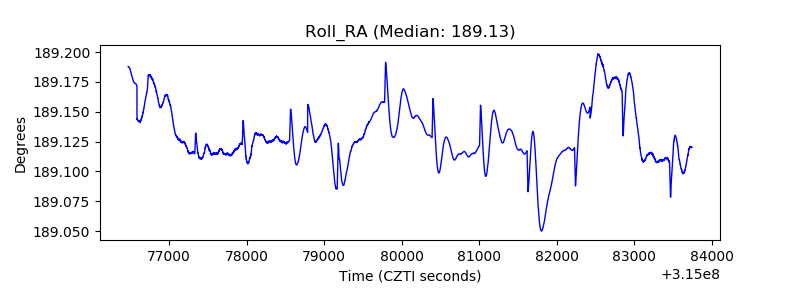 |
| Veto Counter | 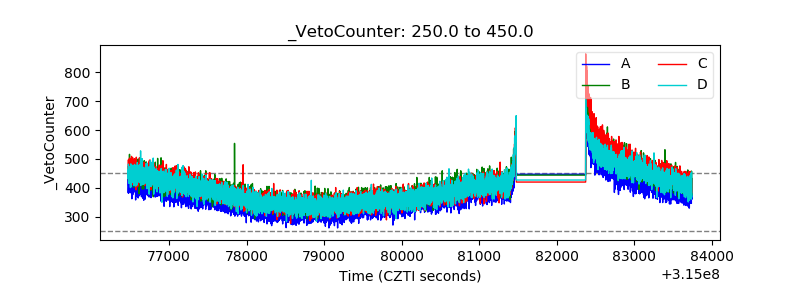 |