| Param | Original file | Final file |
|---|---|---|
| Filename | modeM0/AS1A08_009T01_9000003390_22952cztM0_level2.evt | modeM0/AS1A08_009T01_9000003390_22952cztM0_level2_quad_clean.evt |
| Size (bytes) | 528,842,880 | 96,926,400 |
| Size | 504.3 MB | 92.4 MB |
| Events in quadrant A | 3,123,288 | 630,720 |
| Events in quadrant B | 3,266,457 | 641,132 |
| Events in quadrant C | 3,222,684 | 621,650 |
| Events in quadrant D | 5,953,967 | 579,692 |
| Mode M9 | |||
|---|---|---|---|
| Quadrant | BADHDUFLAG | Total packets | Discarded packets |
| A | 0 | 18 | 0 |
| B | 0 | 19 | 0 |
| C | 0 | 19 | 0 |
| D | 0 | 19 | 0 |
| Mode SS | |||
|---|---|---|---|
| Quadrant | BADHDUFLAG | Total packets | Discarded packets |
| A | 0 | 134 | 0 |
| B | 0 | 134 | 0 |
| C | 0 | 134 | 0 |
| D | 0 | 134 | 0 |
| Mode M0 | |||
|---|---|---|---|
| Quadrant | BADHDUFLAG | Total packets | Discarded packets |
| A | 0 | 13771 | 2 |
| B | 0 | 14145 | 2 |
| C | 0 | 14026 | 2 |
| D | 0 | 22297 | 2 |
| Quadrant | Total seconds | Saturated seconds | Saturation percentage |
|---|---|---|---|
| A | 6628 | 34 | 0.512975% |
| B | 6628 | 75 | 1.131563% |
| C | 6628 | 92 | 1.388051% |
| D | 6628 | 806 | 12.160531% |
Noise dominated data is calculated using 1-second bins in cleaned event files. If a bin has >2000 counts, and if more than 50% of those come from <1% of pixels, then it is considered to be noise-dominated and hence unusable.
| Quadrant | # 1 sec bins | Bins with >0 counts | Bins with >2000 counts | High rate bins dominated by noise | Noise dominated (total time) | Noise dominated (detector-on time) | Marked lightcurve |
|---|---|---|---|---|---|---|---|
| A | 7693 | 6629 | 0 | 0 | 0.00% | 0.00% | 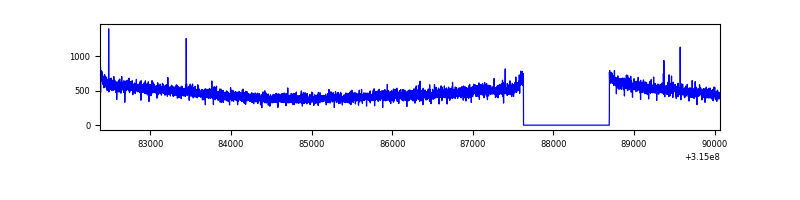 |
| B | 7693 | 6629 | 20 | 20 | 0.26% | 0.30% | 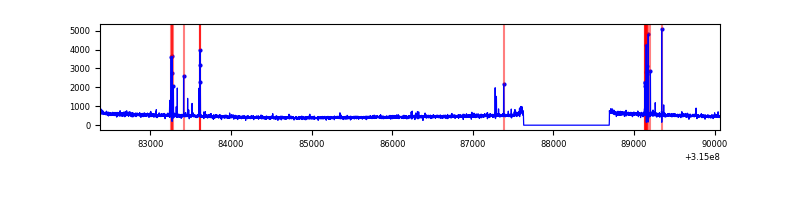 |
| C | 7693 | 6629 | 1 | 1 | 0.01% | 0.02% |  |
| D | 7693 | 6629 | 532 | 532 | 6.92% | 8.03% | 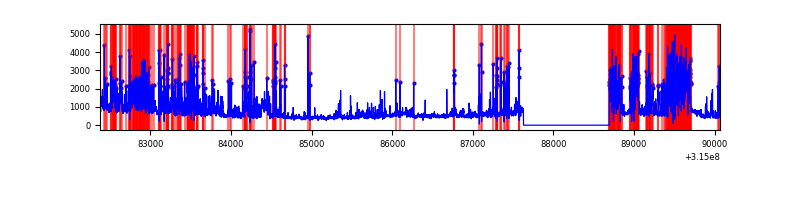 |
Top three noisy pixels from each quadrant. If the there are fewer than three noisy pixels in the level2.evt file, extra rows are filled as -1
| Pixel properties | Quadrant properties | ||||||
|---|---|---|---|---|---|---|---|
| Quadrant | DetID | PixID | Counts | Sigma | Mean | Median | Sigma |
| A | 13 | 254 | 10435 | 59.05 | 809 | 794 | 163.3 |
| A | 3 | 137 | 6986 | 37.93 | 809 | 794 | 163.3 |
| A | 0 | 226 | 6950 | 37.71 | 809 | 794 | 163.3 |
| B | 4 | 216 | 97515 | 631.73 | 807 | 787 | 153.1 |
| B | 12 | 111 | 18502 | 115.7 | 807 | 787 | 153.1 |
| B | 11 | 111 | 16208 | 100.72 | 807 | 787 | 153.1 |
| C | 14 | 238 | 124546 | 675.34 | 786 | 790 | 183.2 |
| C | 0 | 10 | 26651 | 141.13 | 786 | 790 | 183.2 |
| C | 13 | 61 | 5547 | 25.96 | 786 | 790 | 183.2 |
| D | 1 | 52 | 2701127 | 14779.82 | 750 | 729 | 182.7 |
| D | 13 | 153 | 240184 | 1310.59 | 750 | 729 | 182.7 |
| D | 13 | 172 | 52713 | 284.52 | 750 | 729 | 182.7 |
Histogram calculated using DETX and DETY for each event in the final _common_clean file
| Quadrant A |  |
 |
Quadrant B |
|---|---|---|---|
| Quadrant D |  |
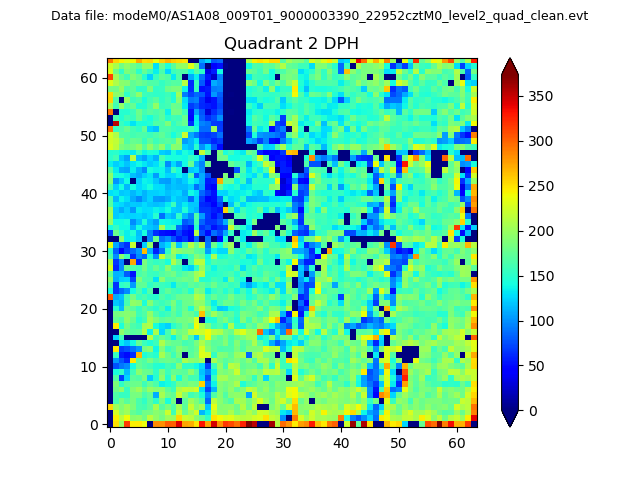 |
Quadrant C |
| Plot type | Count rate plots | Images |
|---|---|---|
| Comparison with Poisson distribution Blue bars denote a histogram of data divided into 1 sec bins. Red curve is a Poisson curve with rate = median count rate of data. |
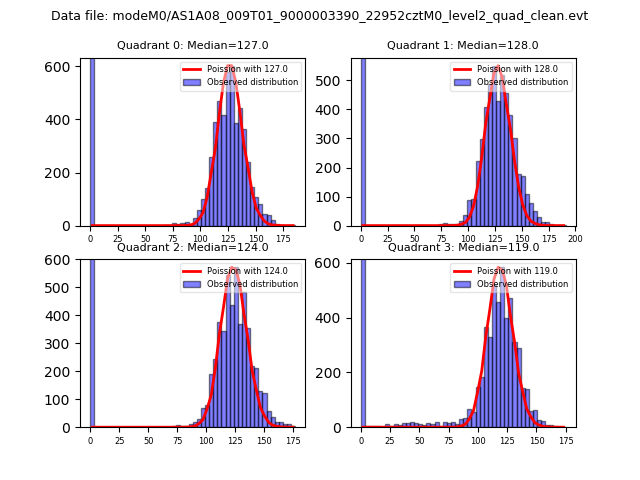 |
 |
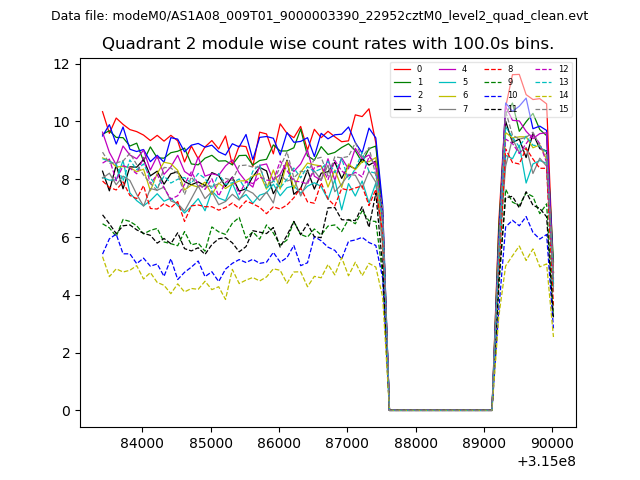
| Quadrant-wise count rates Data is divided into 100 sec bins |
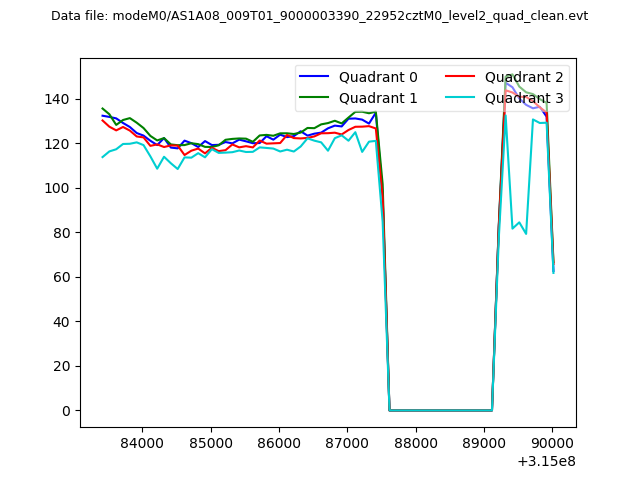 |
|
| Module-wise count rates for Quadrant A Data is divided into 100 sec bins |
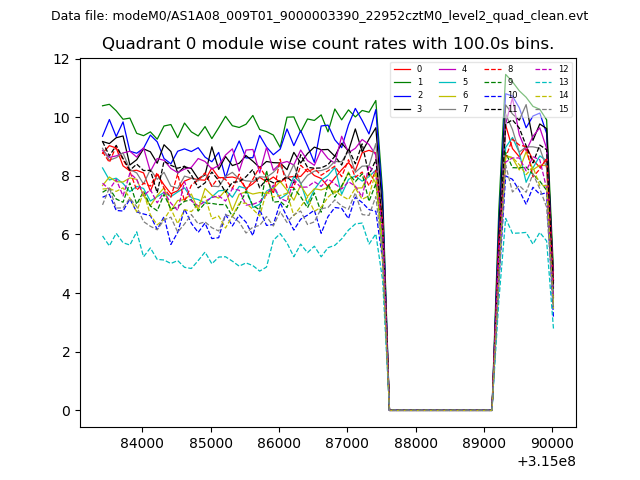 |
 |
| Module-wise count rates for Quadrant B Data is divided into 100 sec bins |
 |
 |
| Module-wise count rates for Quadrant C Data is divided into 100 sec bins |
 |
 |
| Module-wise count rates for Quadrant D Data is divided into 100 sec bins |
 |
 |
| Parameter | Plot |
|---|---|
| CZT HV Monitor |  |
| D_VDD | 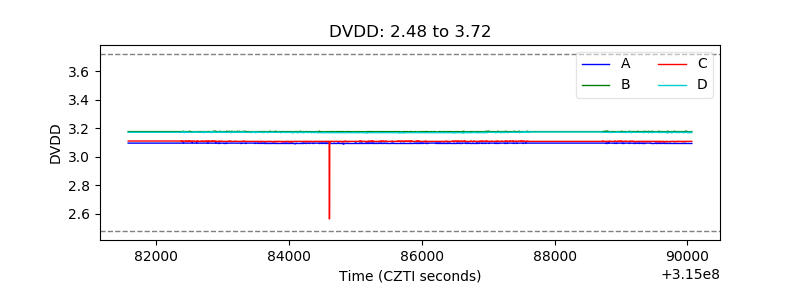 |
| Temperature 1 | 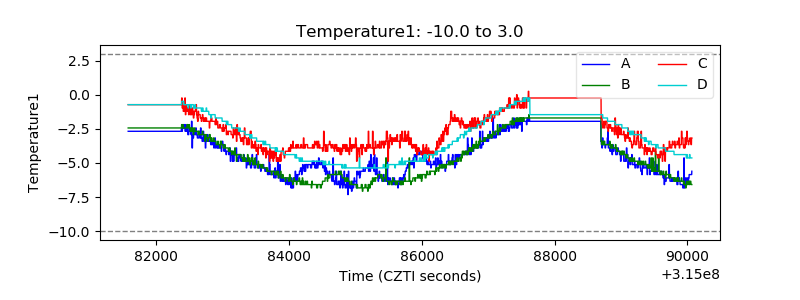 |
| Veto HV Monitor | 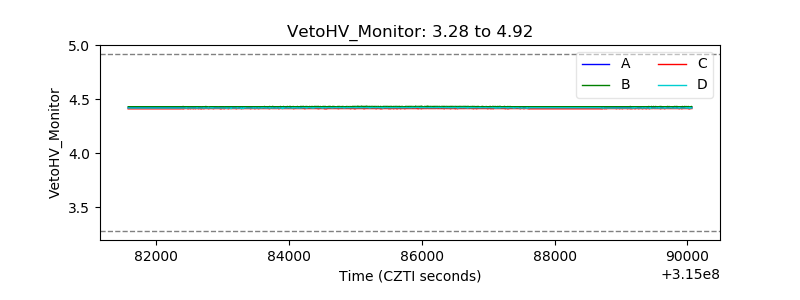 |
| Veto LLD | 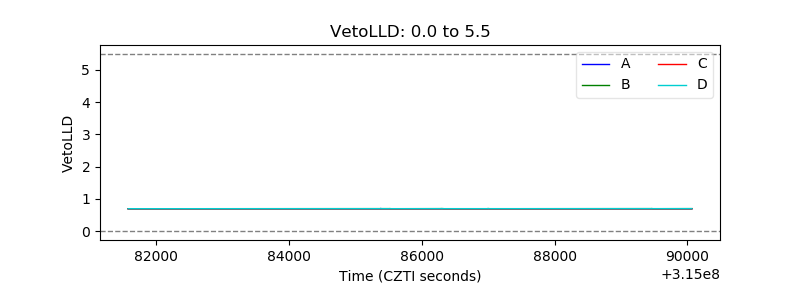 |
| Alpha Counter | 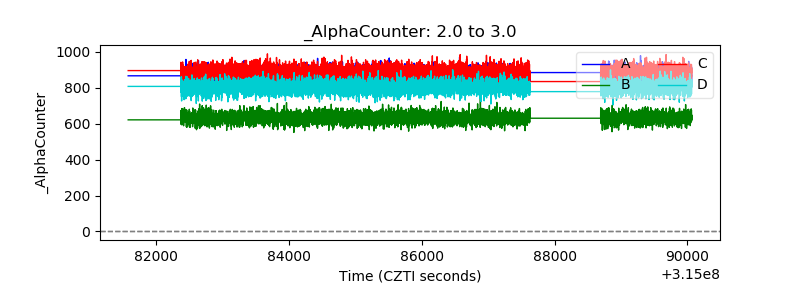 |
| _CPM_Rate | 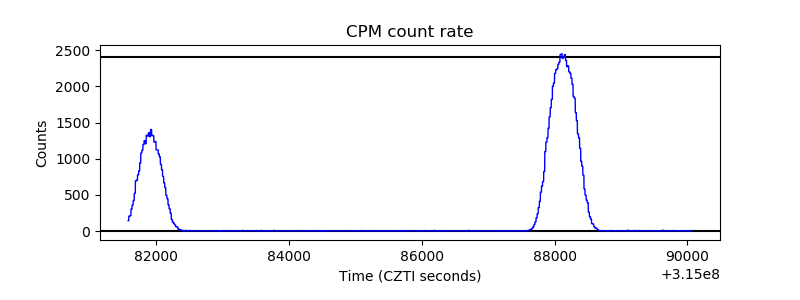 |
| CZT Counter | 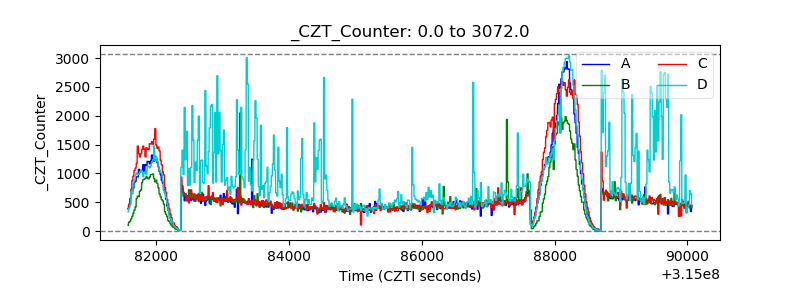 |
| +2.5 Volts monitor |  |
| +5 Volts monitor | 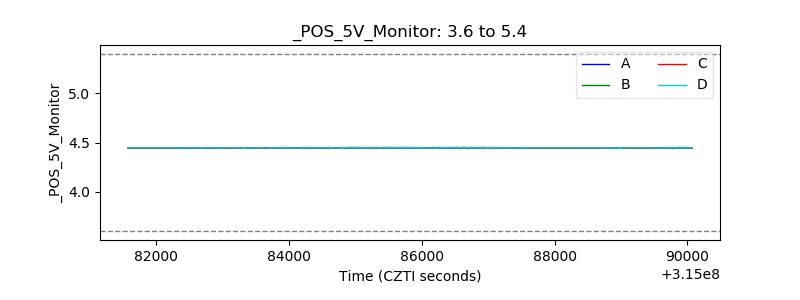 |
| _ROLL_ROT | 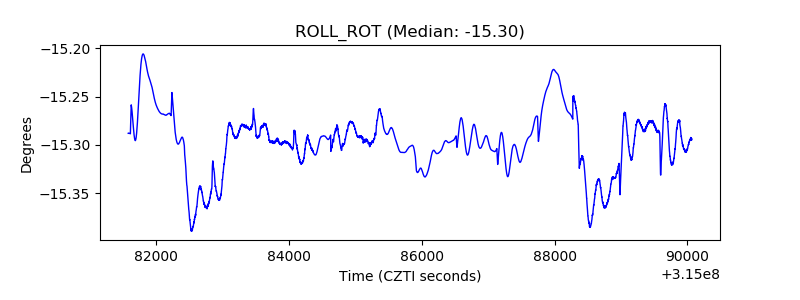 |
| _Roll_DEC | 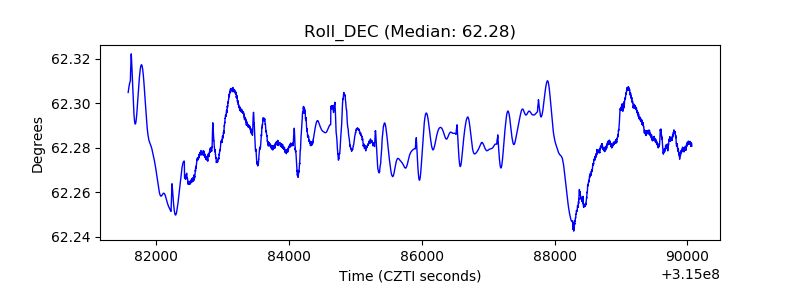 |
| _Roll_RA | 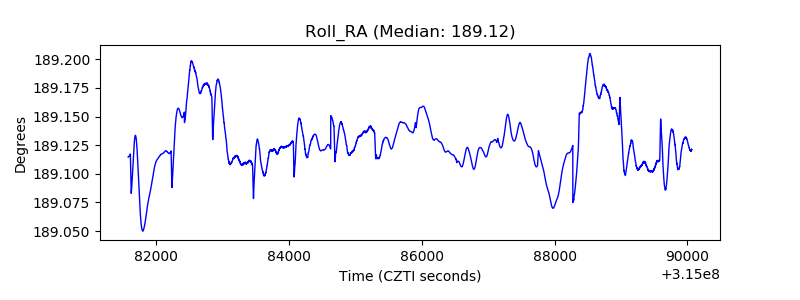 |
| Veto Counter | 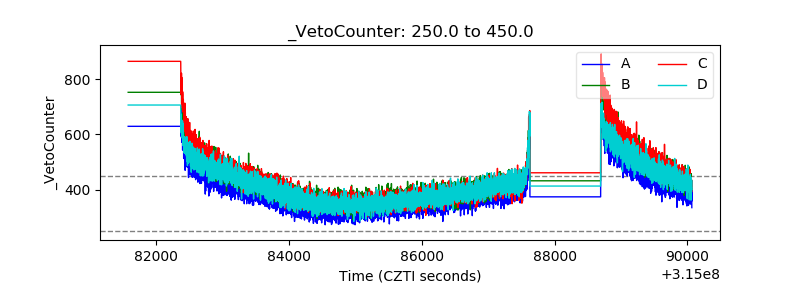 |