| Param | Original file | Final file |
|---|---|---|
| Filename | modeM0/AS1A08_009T01_9000003390_22954cztM0_level2.evt | modeM0/AS1A08_009T01_9000003390_22954cztM0_level2_quad_clean.evt |
| Size (bytes) | 509,670,720 | 104,558,400 |
| Size | 486.1 MB | 99.7 MB |
| Events in quadrant A | 2,983,321 | 695,032 |
| Events in quadrant B | 3,146,693 | 715,188 |
| Events in quadrant C | 3,096,987 | 690,249 |
| Events in quadrant D | 5,785,061 | 630,630 |
| Mode M9 | |||
|---|---|---|---|
| Quadrant | BADHDUFLAG | Total packets | Discarded packets |
| A | 0 | 19 | 0 |
| B | 0 | 20 | 0 |
| C | 0 | 20 | 0 |
| D | 0 | 20 | 0 |
| Mode SS | |||
|---|---|---|---|
| Quadrant | BADHDUFLAG | Total packets | Discarded packets |
| A | 0 | 126 | 0 |
| B | 0 | 126 | 0 |
| C | 0 | 126 | 0 |
| D | 0 | 126 | 0 |
| Mode M0 | |||
|---|---|---|---|
| Quadrant | BADHDUFLAG | Total packets | Discarded packets |
| A | 0 | 13101 | 2 |
| B | 0 | 13558 | 2 |
| C | 0 | 13444 | 3 |
| D | 0 | 21712 | 2 |
| Quadrant | Total seconds | Saturated seconds | Saturation percentage |
|---|---|---|---|
| A | 6241 | 15 | 0.240346% |
| B | 6241 | 59 | 0.945361% |
| C | 6240 | 89 | 1.426282% |
| D | 6240 | 796 | 12.756410% |
Noise dominated data is calculated using 1-second bins in cleaned event files. If a bin has >2000 counts, and if more than 50% of those come from <1% of pixels, then it is considered to be noise-dominated and hence unusable.
| Quadrant | # 1 sec bins | Bins with >0 counts | Bins with >2000 counts | High rate bins dominated by noise | Noise dominated (total time) | Noise dominated (detector-on time) | Marked lightcurve |
|---|---|---|---|---|---|---|---|
| A | 7426 | 6242 | 3 | 3 | 0.04% | 0.05% | 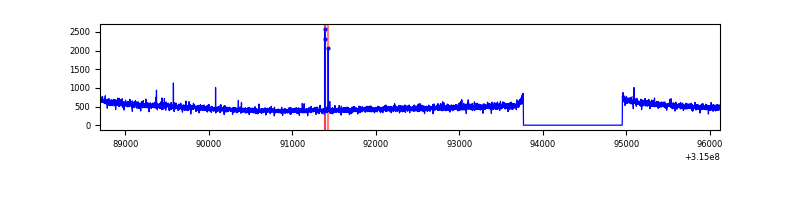 |
| B | 7426 | 6242 | 20 | 20 | 0.27% | 0.32% | 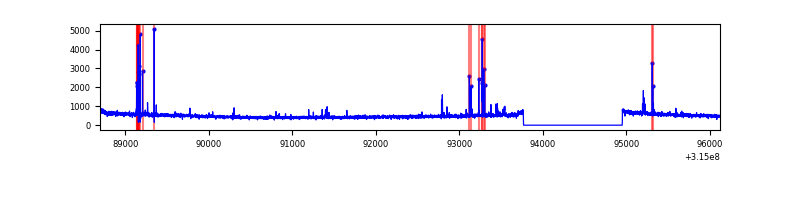 |
| C | 7425 | 6241 | 2 | 2 | 0.03% | 0.03% | 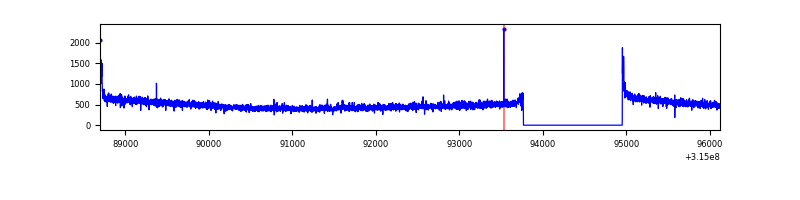 |
| D | 7425 | 6241 | 590 | 590 | 7.95% | 9.45% | 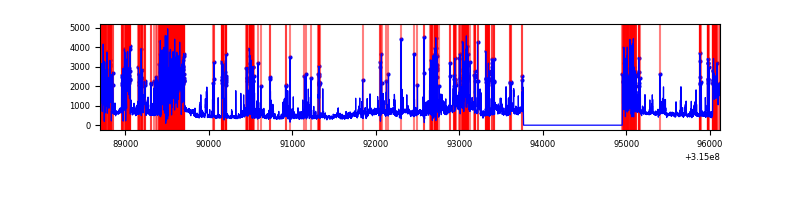 |
Top three noisy pixels from each quadrant. If the there are fewer than three noisy pixels in the level2.evt file, extra rows are filled as -1
| Pixel properties | Quadrant properties | ||||||
|---|---|---|---|---|---|---|---|
| Quadrant | DetID | PixID | Counts | Sigma | Mean | Median | Sigma |
| A | 13 | 254 | 10663 | 64.3 | 771 | 756 | 154.1 |
| A | 6 | 16 | 8918 | 52.97 | 771 | 756 | 154.1 |
| A | 0 | 226 | 6568 | 37.72 | 771 | 756 | 154.1 |
| B | 4 | 216 | 84849 | 575.27 | 775 | 755 | 146.2 |
| B | 12 | 111 | 17547 | 114.87 | 775 | 755 | 146.2 |
| B | 0 | 190 | 17276 | 113.02 | 775 | 755 | 146.2 |
| C | 14 | 238 | 119369 | 682.74 | 752 | 757 | 173.7 |
| C | 0 | 10 | 38501 | 217.26 | 752 | 757 | 173.7 |
| C | 7 | 247 | 7245 | 37.35 | 752 | 757 | 173.7 |
| D | 1 | 52 | 2762450 | 16275.16 | 707 | 688 | 169.7 |
| D | 2 | 152 | 150383 | 882.16 | 707 | 688 | 169.7 |
| D | 13 | 172 | 72731 | 424.55 | 707 | 688 | 169.7 |
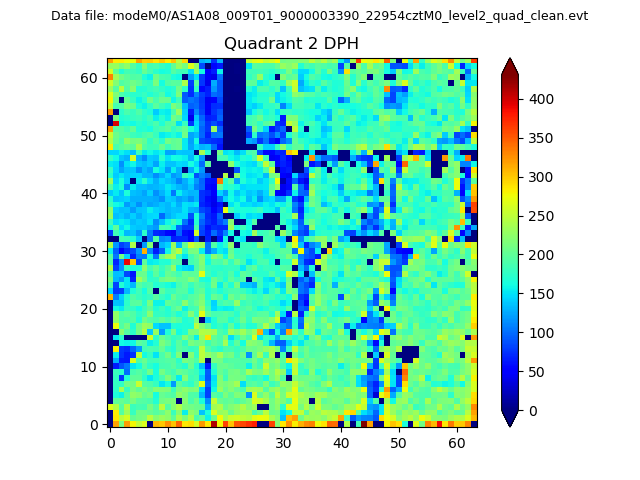
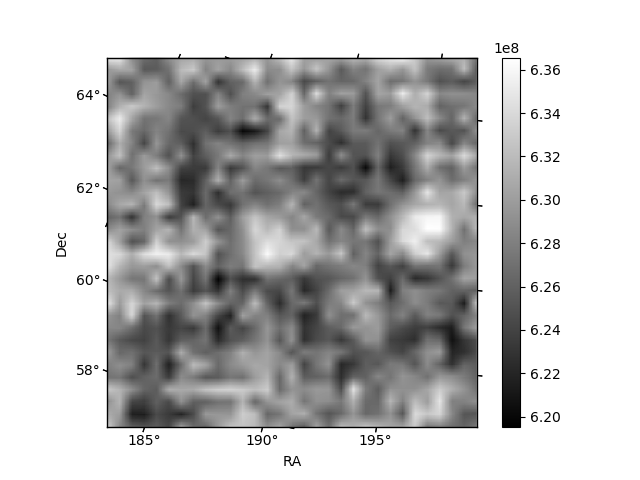
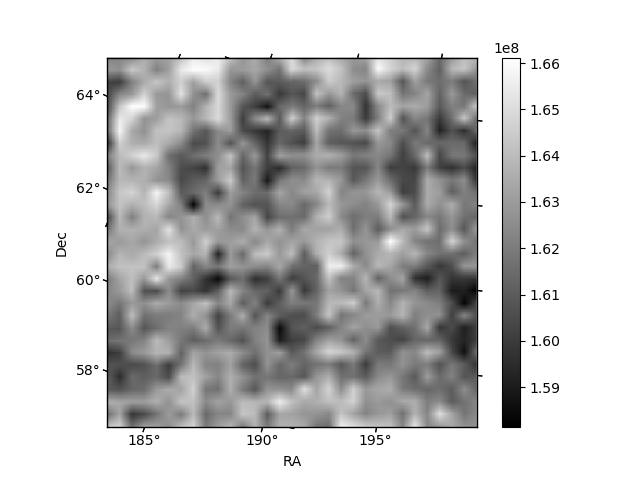
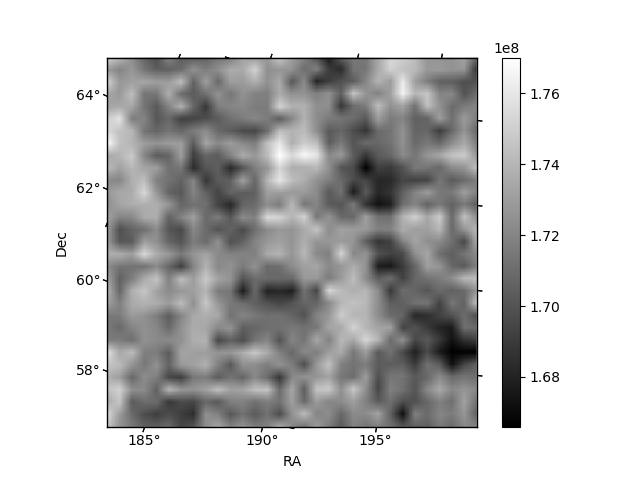
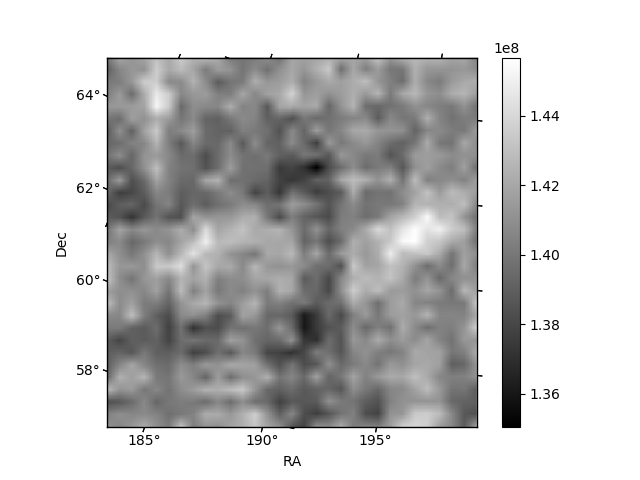
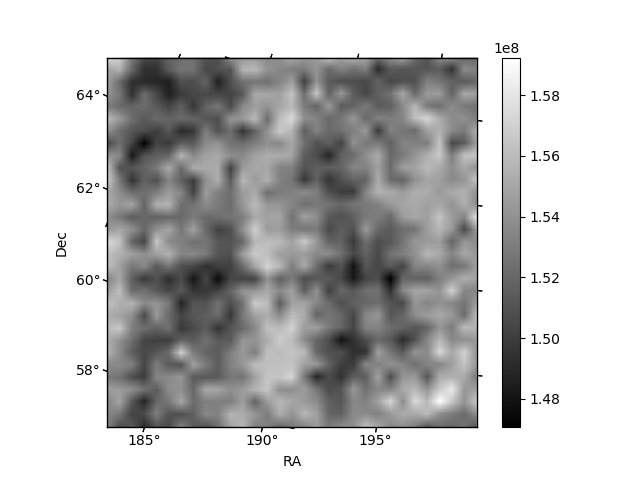
Histogram calculated using DETX and DETY for each event in the final _common_clean file
| Quadrant A | 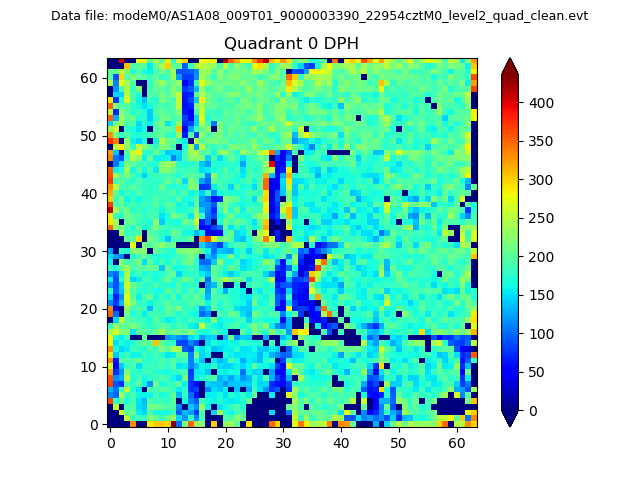 |
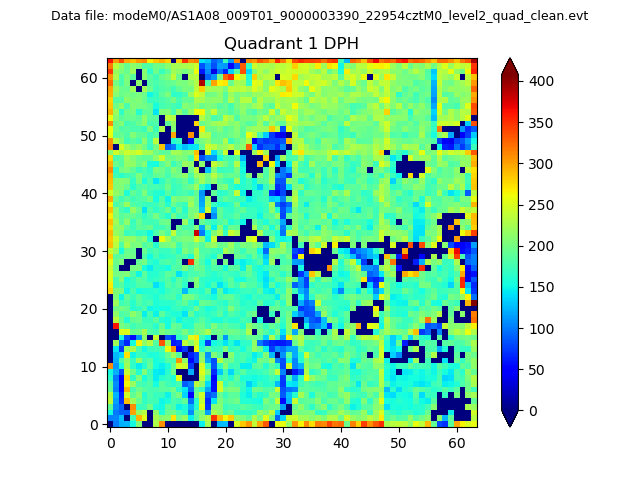 |
Quadrant B |
|---|---|---|---|
| Quadrant D | 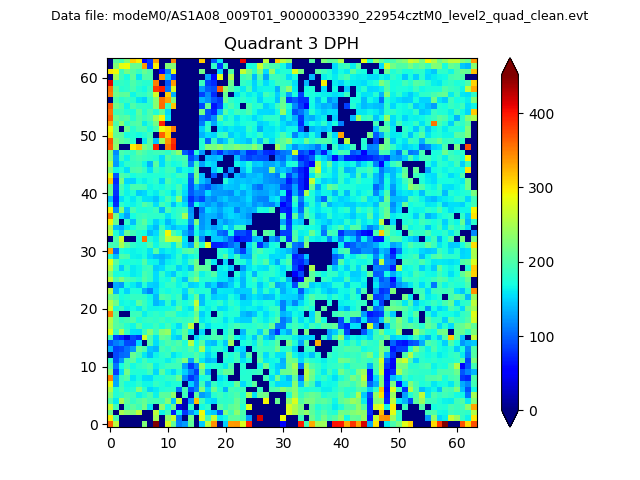 |
 |
Quadrant C |
| Plot type | Count rate plots | Images |
|---|---|---|
| Comparison with Poisson distribution Blue bars denote a histogram of data divided into 1 sec bins. Red curve is a Poisson curve with rate = median count rate of data. |
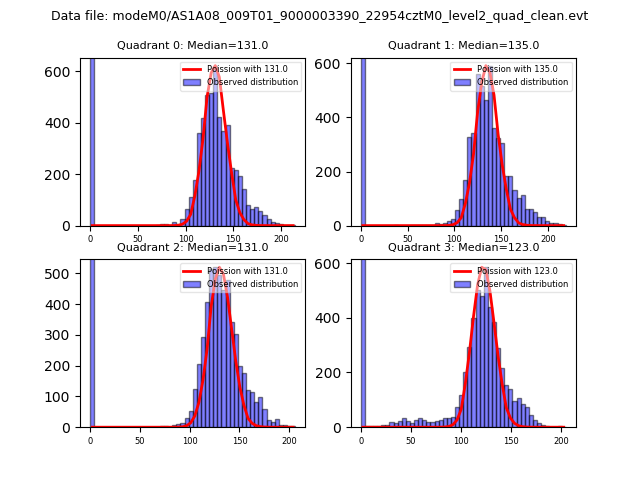 |
 |
| Quadrant-wise count rates Data is divided into 100 sec bins |
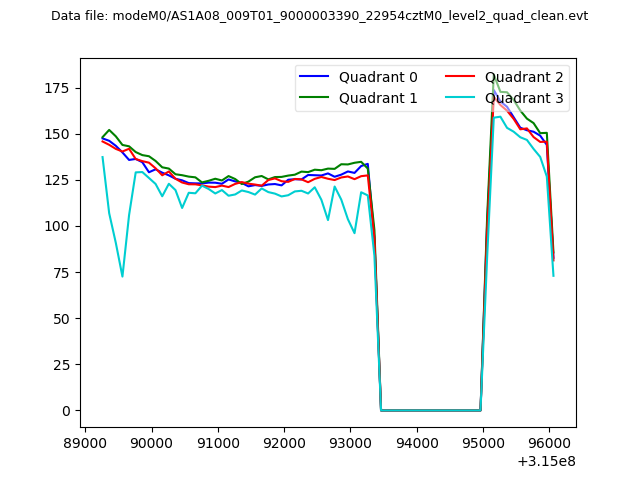 |
|
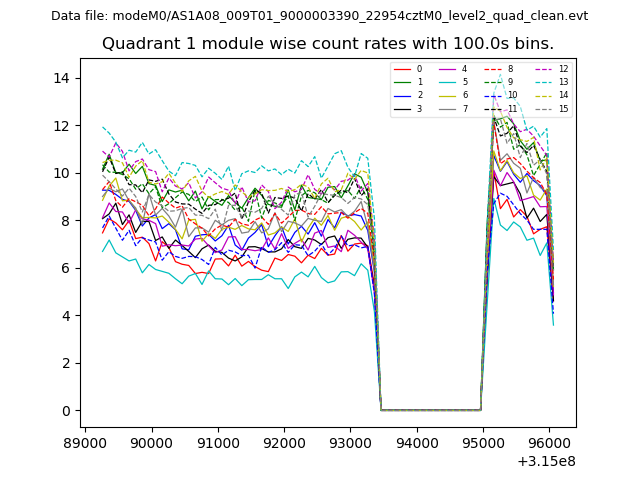
| Module-wise count rates for Quadrant A Data is divided into 100 sec bins |
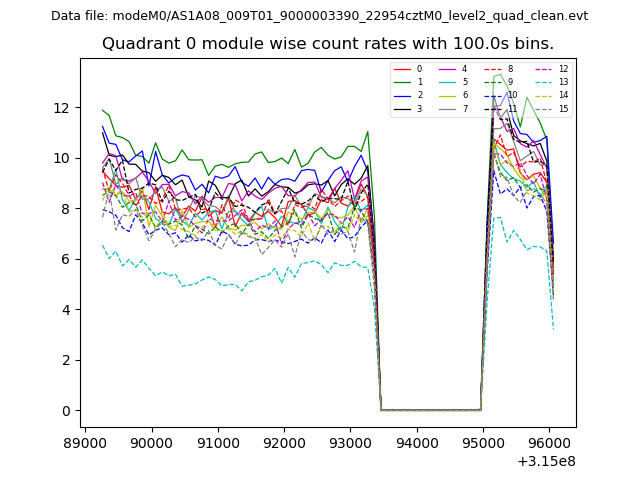 |
 |
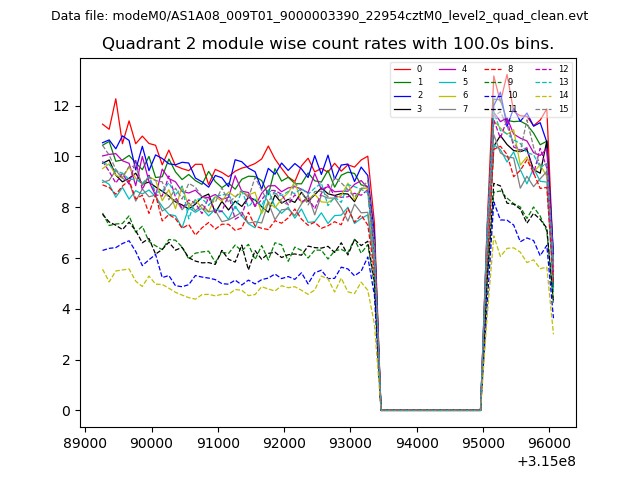
| Module-wise count rates for Quadrant B Data is divided into 100 sec bins |
 |
 |
| Module-wise count rates for Quadrant C Data is divided into 100 sec bins |
 |
 |
| Module-wise count rates for Quadrant D Data is divided into 100 sec bins |
 |
 |
| Parameter | Plot |
|---|---|
| CZT HV Monitor | 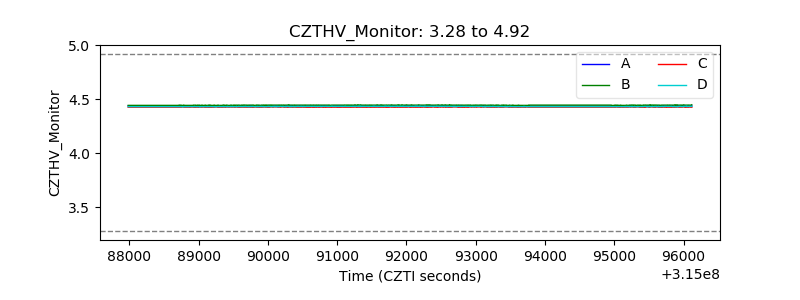 |
| D_VDD | 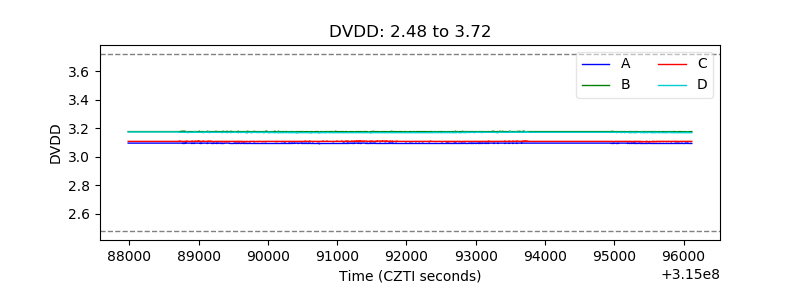 |
| Temperature 1 |  |
| Veto HV Monitor | 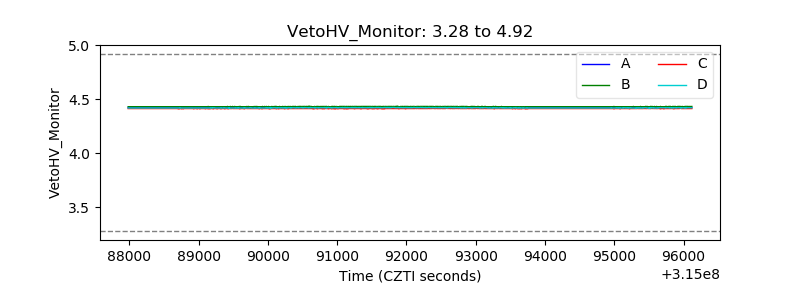 |
| Veto LLD | 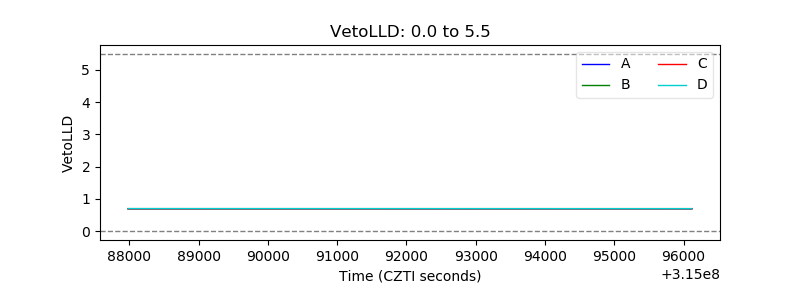 |
| Alpha Counter | 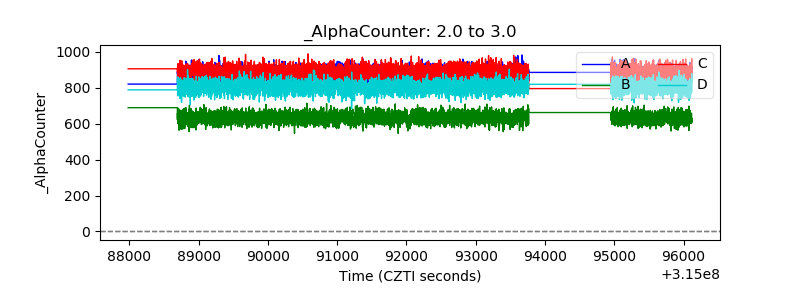 |
| _CPM_Rate | 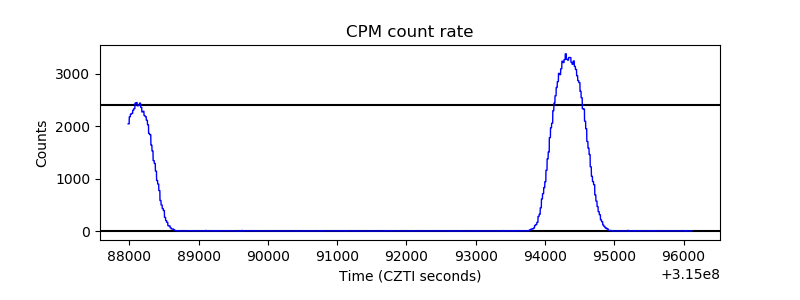 |
| CZT Counter | 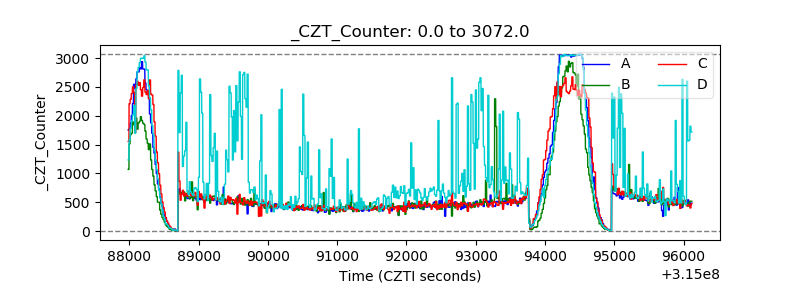 |
| +2.5 Volts monitor |  |
| +5 Volts monitor |  |
| _ROLL_ROT |  |
| _Roll_DEC |  |
| _Roll_RA | 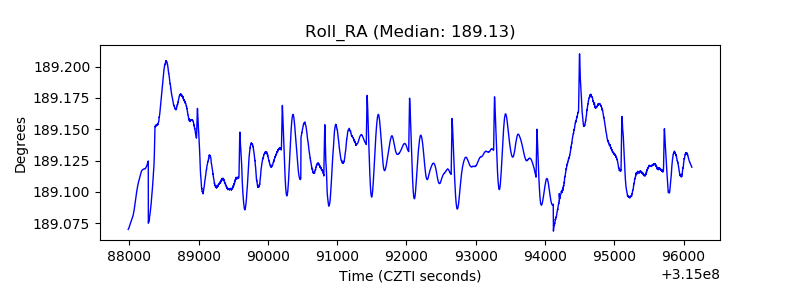 |
| Veto Counter | 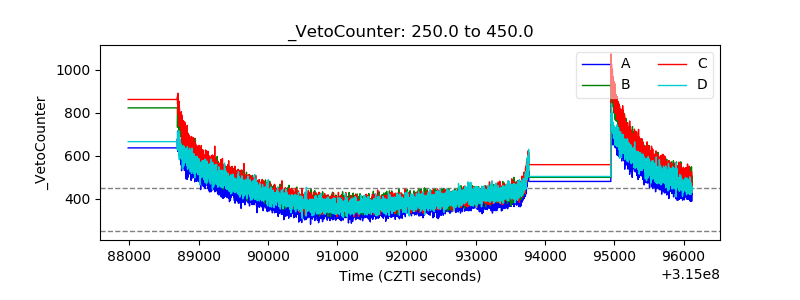 |