| Param | Original file | Final file |
|---|---|---|
| Filename | modeM0/AS1A08_009T01_9000003390_22958cztM0_level2.evt | modeM0/AS1A08_009T01_9000003390_22958cztM0_level2_quad_clean.evt |
| Size (bytes) | 515,511,360 | 97,344,000 |
| Size | 491.6 MB | 92.8 MB |
| Events in quadrant A | 2,992,280 | 647,351 |
| Events in quadrant B | 3,104,048 | 662,504 |
| Events in quadrant C | 3,860,430 | 614,712 |
| Events in quadrant D | 5,225,760 | 581,368 |
| Mode M9 | |||
|---|---|---|---|
| Quadrant | BADHDUFLAG | Total packets | Discarded packets |
| A | 0 | 13 | 0 |
| B | 0 | 13 | 0 |
| C | 0 | 13 | 0 |
| D | 0 | 13 | 0 |
| Mode SS | |||
|---|---|---|---|
| Quadrant | BADHDUFLAG | Total packets | Discarded packets |
| A | 0 | 128 | 0 |
| B | 0 | 128 | 0 |
| C | 0 | 128 | 0 |
| D | 0 | 128 | 0 |
| Mode M0 | |||
|---|---|---|---|
| Quadrant | BADHDUFLAG | Total packets | Discarded packets |
| A | 0 | 12954 | 1 |
| B | 0 | 13242 | 1 |
| C | 0 | 15766 | 1 |
| D | 0 | 19888 | 1 |
| Quadrant | Total seconds | Saturated seconds | Saturation percentage |
|---|---|---|---|
| A | 6335 | 16 | 0.252565% |
| B | 6335 | 41 | 0.647198% |
| C | 6335 | 133 | 2.099448% |
| D | 6335 | 565 | 8.918706% |
Noise dominated data is calculated using 1-second bins in cleaned event files. If a bin has >2000 counts, and if more than 50% of those come from <1% of pixels, then it is considered to be noise-dominated and hence unusable.
| Quadrant | # 1 sec bins | Bins with >0 counts | Bins with >2000 counts | High rate bins dominated by noise | Noise dominated (total time) | Noise dominated (detector-on time) | Marked lightcurve |
|---|---|---|---|---|---|---|---|
| A | 7575 | 6336 | 0 | 0 | 0.00% | 0.00% | 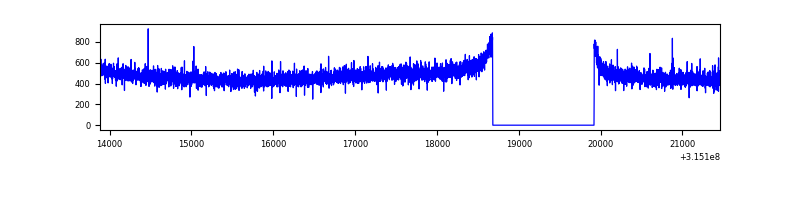 |
| B | 7575 | 6336 | 6 | 6 | 0.08% | 0.09% | 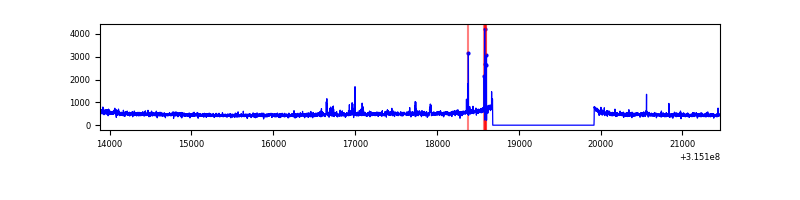 |
| C | 7575 | 6336 | 38 | 38 | 0.50% | 0.60% | 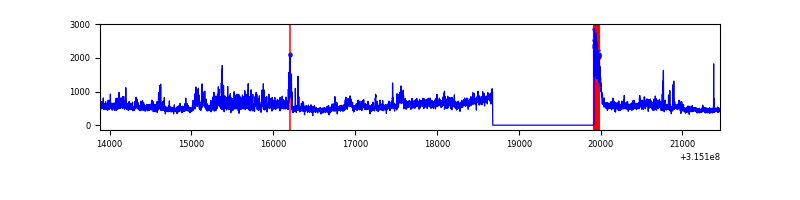 |
| D | 7575 | 6336 | 551 | 551 | 7.27% | 8.70% | 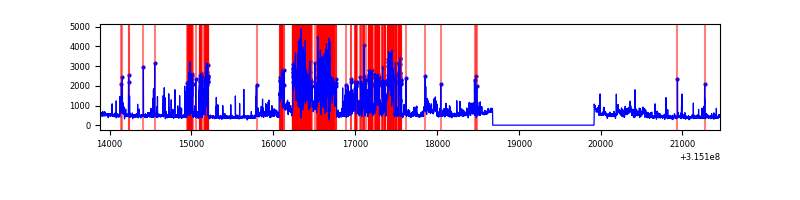 |
Top three noisy pixels from each quadrant. If the there are fewer than three noisy pixels in the level2.evt file, extra rows are filled as -1
| Pixel properties | Quadrant properties | ||||||
|---|---|---|---|---|---|---|---|
| Quadrant | DetID | PixID | Counts | Sigma | Mean | Median | Sigma |
| A | 13 | 254 | 10765 | 65.13 | 774 | 760 | 153.6 |
| A | 13 | 170 | 7604 | 44.55 | 774 | 760 | 153.6 |
| A | 0 | 226 | 6811 | 39.39 | 774 | 760 | 153.6 |
| B | 4 | 216 | 36885 | 251.01 | 771 | 755 | 143.9 |
| B | 0 | 190 | 31432 | 213.13 | 771 | 755 | 143.9 |
| B | 12 | 111 | 16831 | 111.69 | 771 | 755 | 143.9 |
| C | 0 | 10 | 874365 | 5210.85 | 726 | 731 | 167.7 |
| C | 14 | 238 | 118775 | 704.08 | 726 | 731 | 167.7 |
| C | 0 | 239 | 16003 | 91.09 | 726 | 731 | 167.7 |
| D | 1 | 52 | 2211213 | 12798.37 | 713 | 692 | 172.7 |
| D | 13 | 153 | 154556 | 890.83 | 713 | 692 | 172.7 |
| D | 13 | 174 | 75522 | 433.25 | 713 | 692 | 172.7 |
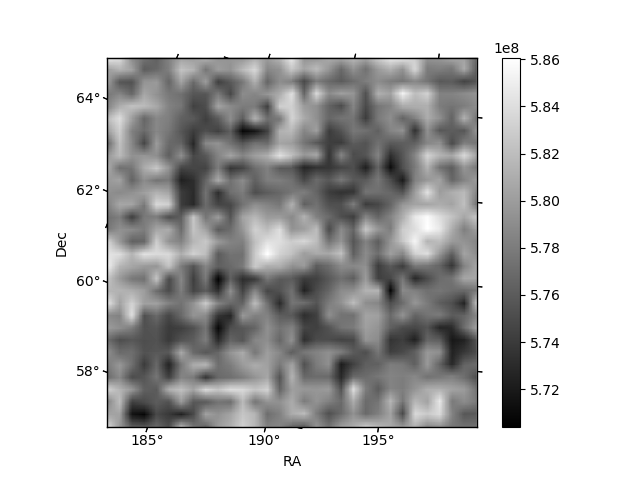
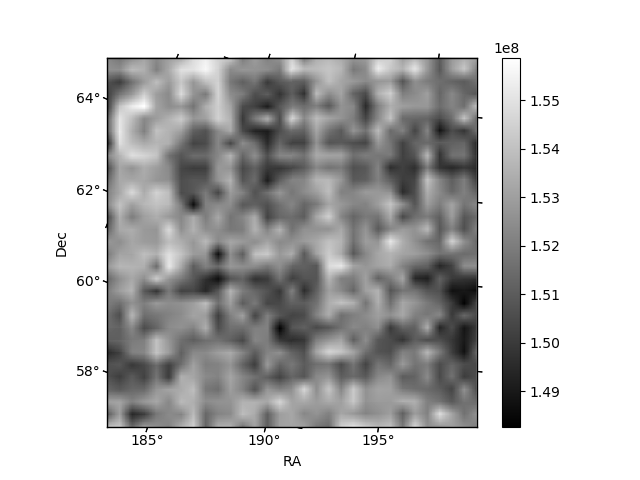
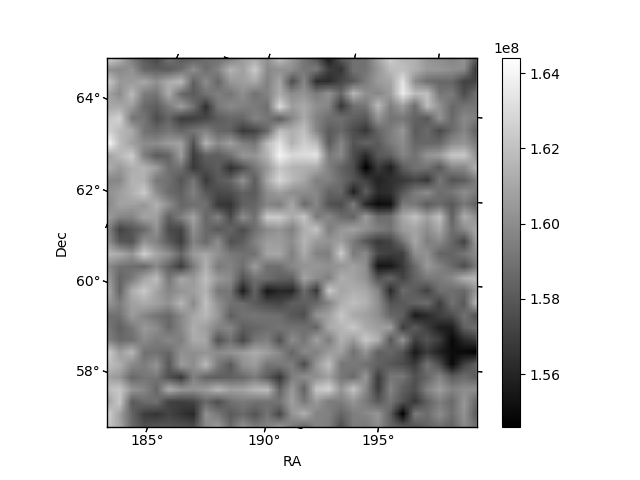
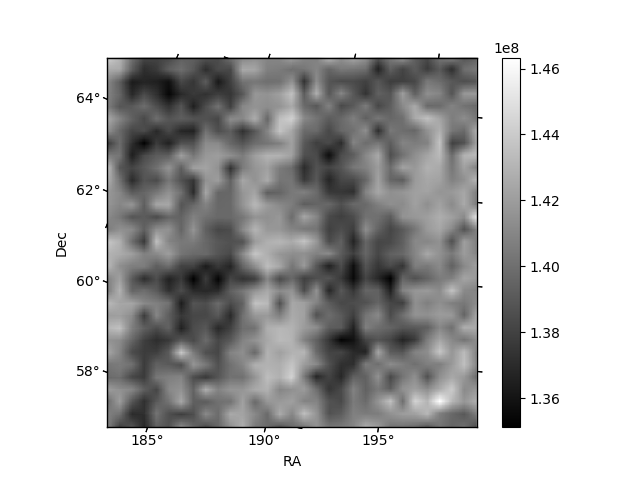
Histogram calculated using DETX and DETY for each event in the final _common_clean file
| Quadrant A | 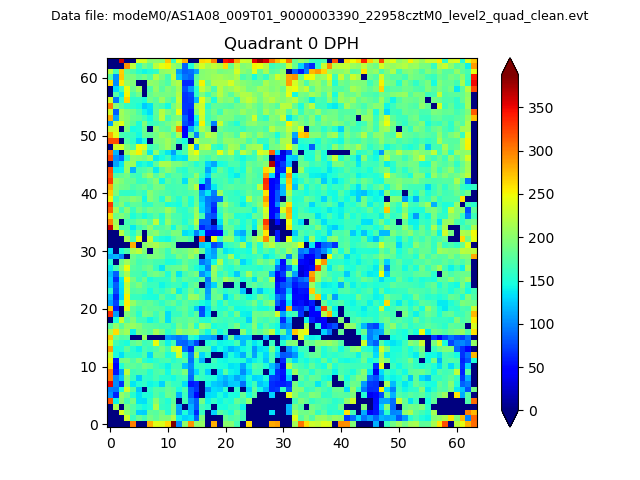 |
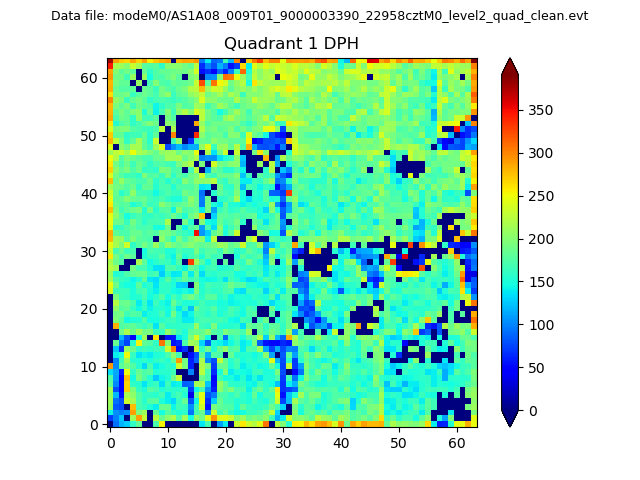 |
Quadrant B |
|---|---|---|---|
| Quadrant D | 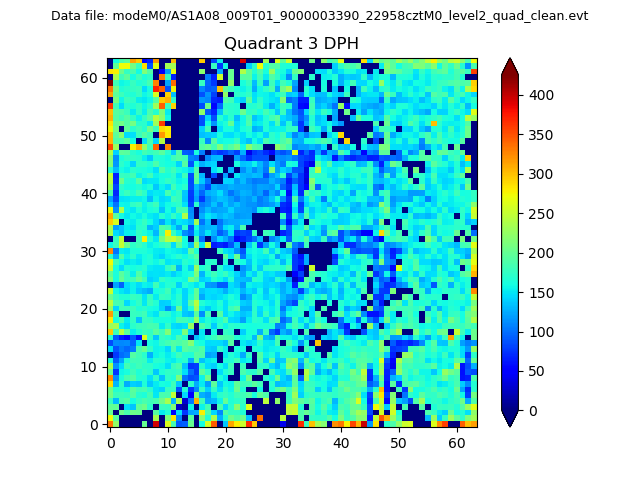 |
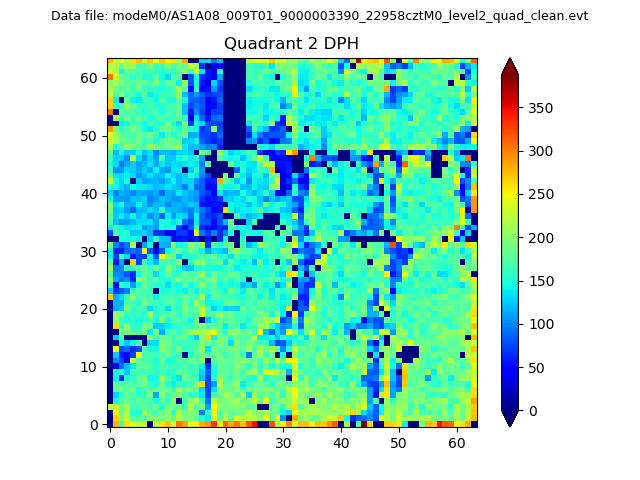 |
Quadrant C |
| Plot type | Count rate plots | Images |
|---|---|---|
| Comparison with Poisson distribution Blue bars denote a histogram of data divided into 1 sec bins. Red curve is a Poisson curve with rate = median count rate of data. |
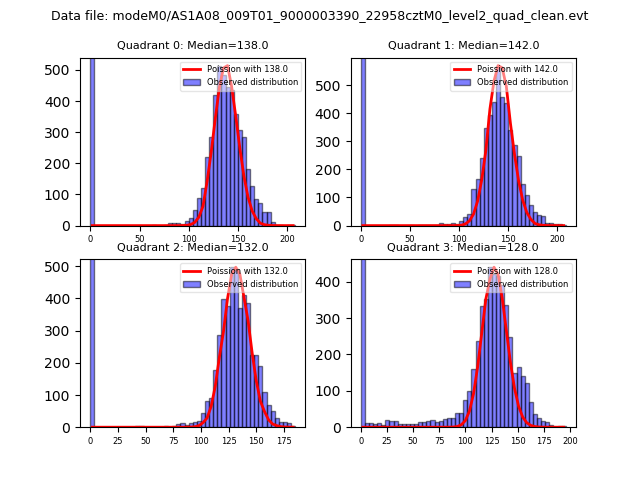 |
 |
| Quadrant-wise count rates Data is divided into 100 sec bins |
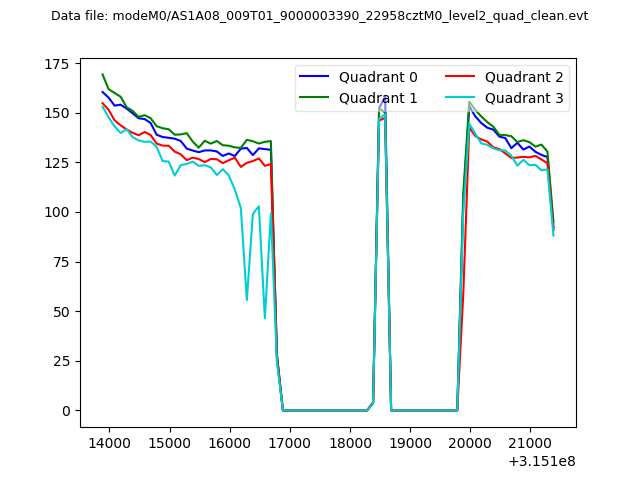 |
|
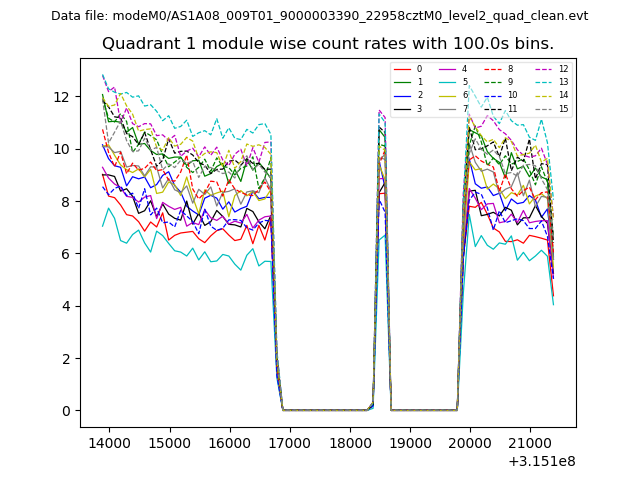
| Module-wise count rates for Quadrant A Data is divided into 100 sec bins |
 |
 |
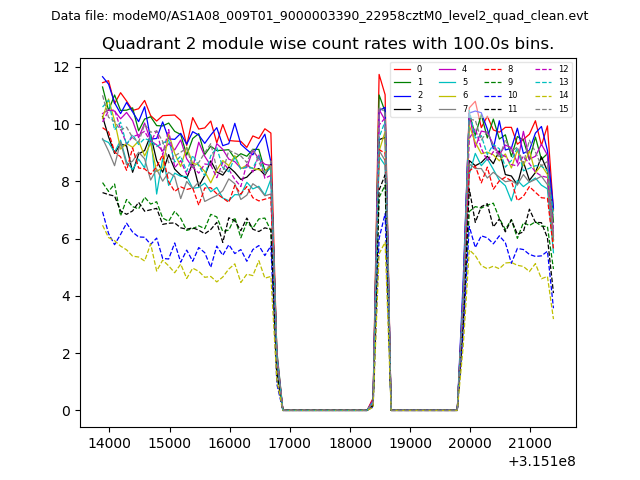
| Module-wise count rates for Quadrant B Data is divided into 100 sec bins |
 |
 |
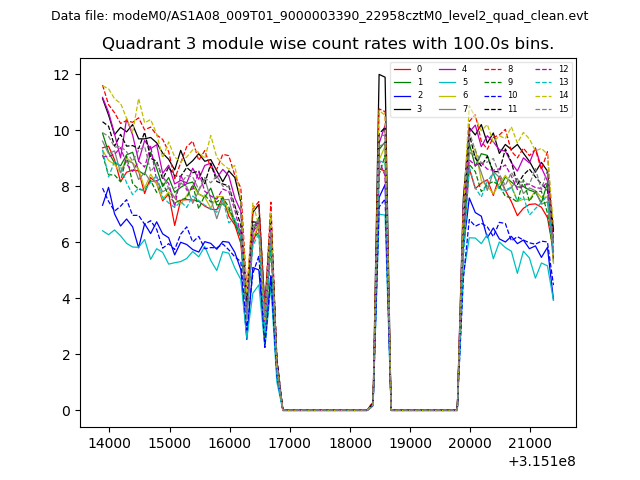
| Module-wise count rates for Quadrant C Data is divided into 100 sec bins |
 |
 |
| Module-wise count rates for Quadrant D Data is divided into 100 sec bins |
 |
 |
| Parameter | Plot |
|---|---|
| CZT HV Monitor |  |
| D_VDD | 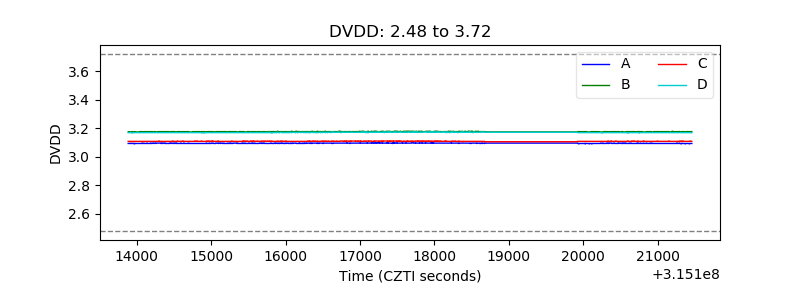 |
| Temperature 1 | 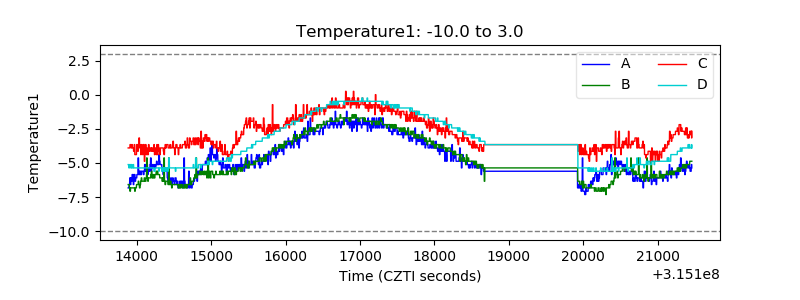 |
| Veto HV Monitor | 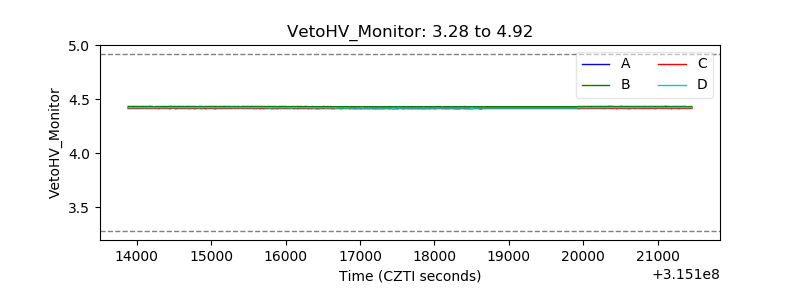 |
| Veto LLD | 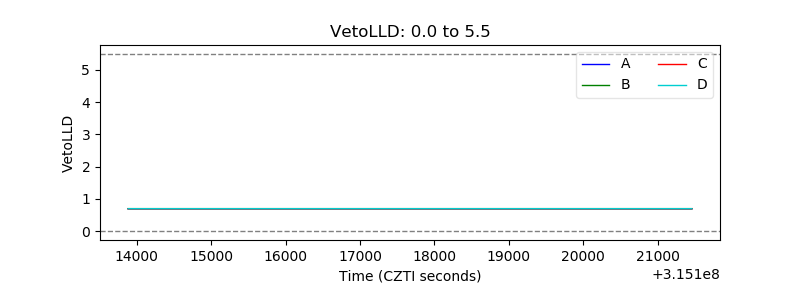 |
| Alpha Counter | 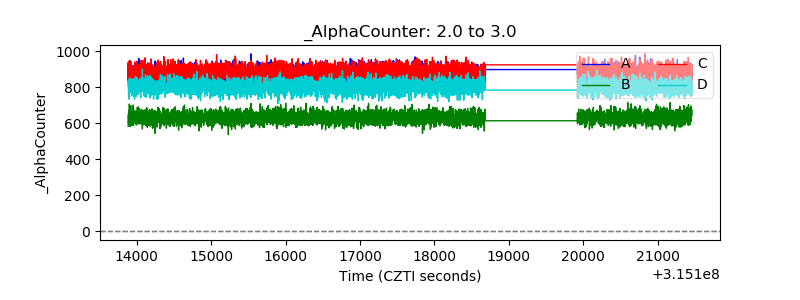 |
| _CPM_Rate | 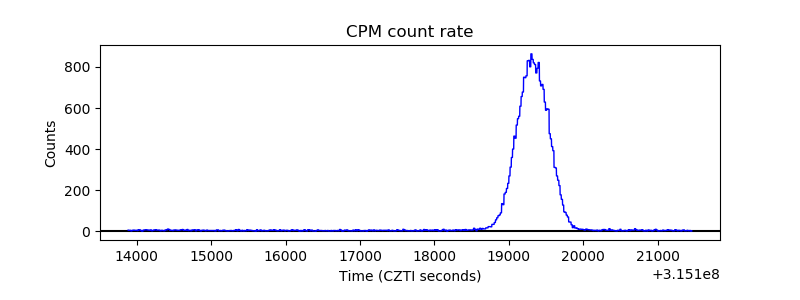 |
| CZT Counter | 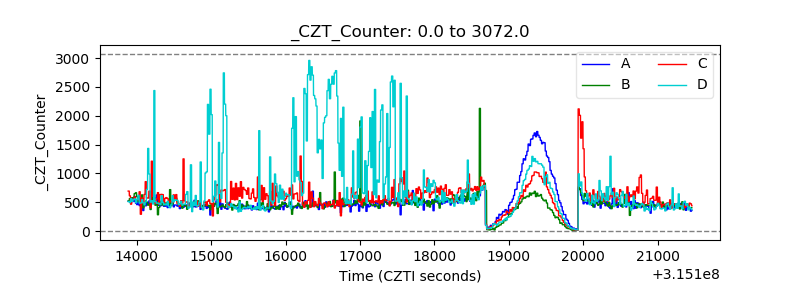 |
| +2.5 Volts monitor |  |
| +5 Volts monitor |  |
| _ROLL_ROT | 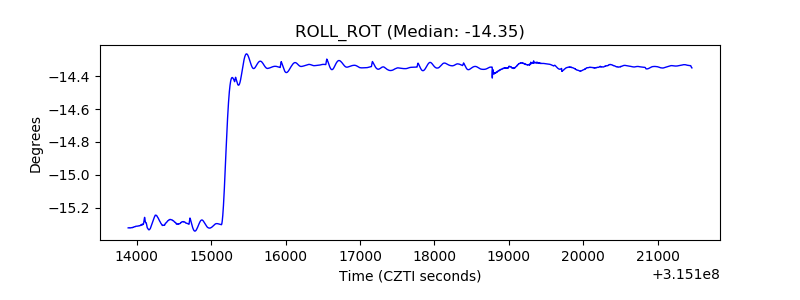 |
| _Roll_DEC | 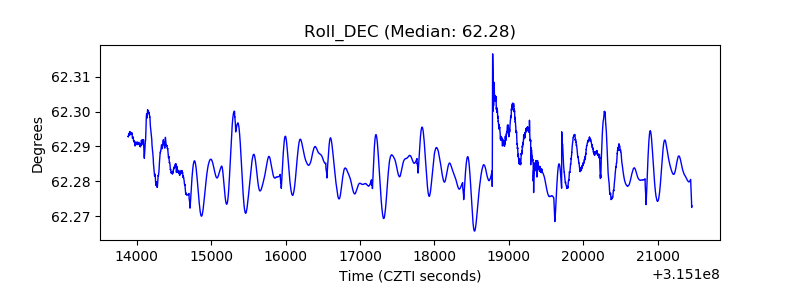 |
| _Roll_RA | 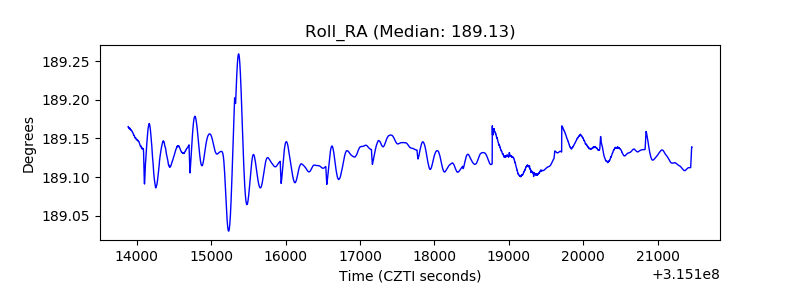 |
| Veto Counter | 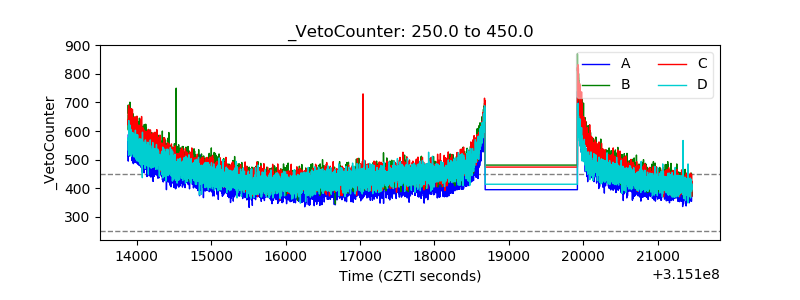 |