| Param | Original file | Final file |
|---|---|---|
| Filename | modeM0/AS1A08_009T01_9000003390_22962cztM0_level2.evt | modeM0/AS1A08_009T01_9000003390_22962cztM0_level2_quad_clean.evt |
| Size (bytes) | 696,384,000 | 88,761,600 |
| Size | 664.1 MB | 84.6 MB |
| Events in quadrant A | 3,190,957 | 586,931 |
| Events in quadrant B | 3,304,241 | 596,133 |
| Events in quadrant C | 3,174,766 | 568,733 |
| Events in quadrant D | 10,950,932 | 453,192 |
| Mode M9 | |||
|---|---|---|---|
| Quadrant | BADHDUFLAG | Total packets | Discarded packets |
| A | 0 | 3 | 0 |
| B | 0 | 3 | 0 |
| C | 0 | 3 | 0 |
| D | 0 | 3 | 0 |
| Mode SS | |||
|---|---|---|---|
| Quadrant | BADHDUFLAG | Total packets | Discarded packets |
| A | 0 | 140 | 0 |
| B | 0 | 140 | 0 |
| C | 0 | 140 | 0 |
| D | 0 | 140 | 0 |
| Mode M0 | |||
|---|---|---|---|
| Quadrant | BADHDUFLAG | Total packets | Discarded packets |
| A | 0 | 14090 | 1 |
| B | 0 | 14359 | 1 |
| C | 0 | 14086 | 1 |
| D | 0 | 37333 | 3 |
| Quadrant | Total seconds | Saturated seconds | Saturation percentage |
|---|---|---|---|
| A | 6924 | 95 | 1.372039% |
| B | 6924 | 112 | 1.617562% |
| C | 6925 | 118 | 1.703971% |
| D | 6924 | 2803 | 40.482380% |
Noise dominated data is calculated using 1-second bins in cleaned event files. If a bin has >2000 counts, and if more than 50% of those come from <1% of pixels, then it is considered to be noise-dominated and hence unusable.
| Quadrant | # 1 sec bins | Bins with >0 counts | Bins with >2000 counts | High rate bins dominated by noise | Noise dominated (total time) | Noise dominated (detector-on time) | Marked lightcurve |
|---|---|---|---|---|---|---|---|
| A | 7214 | 6925 | 0 | 0 | 0.00% | 0.00% | 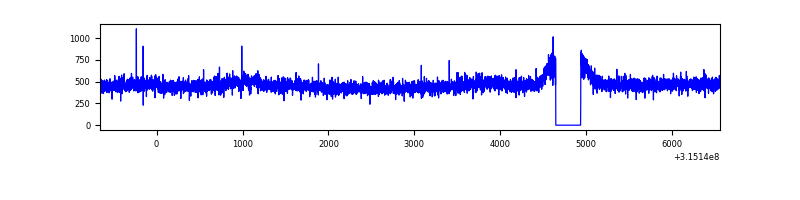 |
| B | 7214 | 6925 | 4 | 4 | 0.06% | 0.06% | 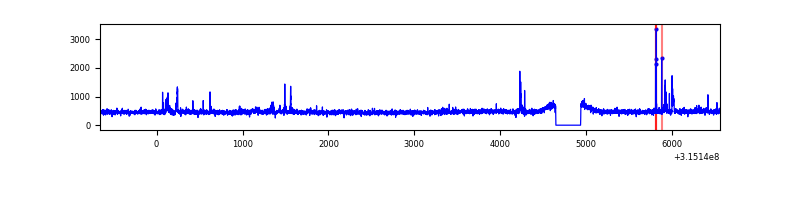 |
| C | 7215 | 6926 | 0 | 0 | 0.00% | 0.00% | 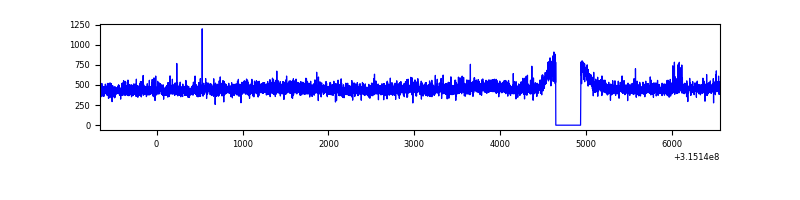 |
| D | 7214 | 6925 | 2333 | 2333 | 32.34% | 33.69% | 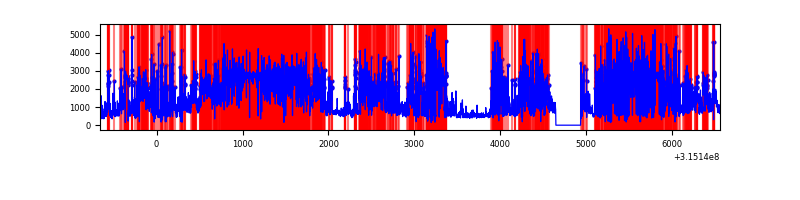 |
Top three noisy pixels from each quadrant. If the there are fewer than three noisy pixels in the level2.evt file, extra rows are filled as -1
| Pixel properties | Quadrant properties | ||||||
|---|---|---|---|---|---|---|---|
| Quadrant | DetID | PixID | Counts | Sigma | Mean | Median | Sigma |
| A | 13 | 170 | 39875 | 235.17 | 817 | 799 | 166.2 |
| A | 13 | 254 | 12392 | 69.77 | 817 | 799 | 166.2 |
| A | 3 | 137 | 7258 | 38.87 | 817 | 799 | 166.2 |
| B | 0 | 190 | 71255 | 453.74 | 809 | 788 | 155.3 |
| B | 0 | 189 | 29000 | 181.66 | 809 | 788 | 155.3 |
| B | 12 | 111 | 18855 | 116.33 | 809 | 788 | 155.3 |
| C | 14 | 238 | 123165 | 674.33 | 775 | 779 | 181.5 |
| C | 0 | 239 | 14920 | 77.92 | 775 | 779 | 181.5 |
| C | 7 | 247 | 11182 | 57.32 | 775 | 779 | 181.5 |
| D | 1 | 52 | 6692274 | 43231.0 | 637 | 615 | 154.8 |
| D | 13 | 172 | 1603313 | 10354.12 | 637 | 615 | 154.8 |
| D | 13 | 153 | 151600 | 975.43 | 637 | 615 | 154.8 |
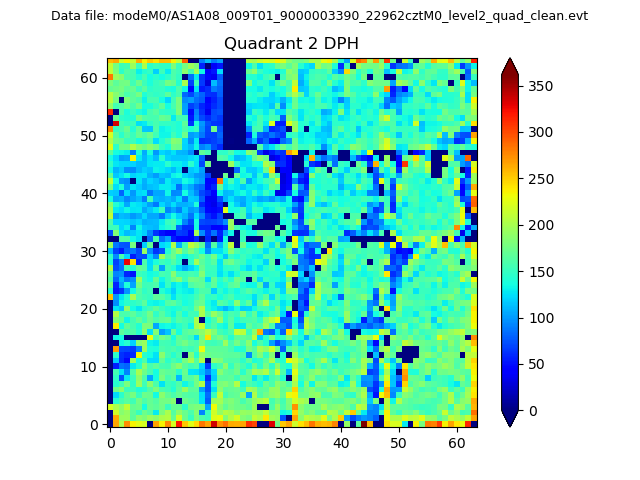
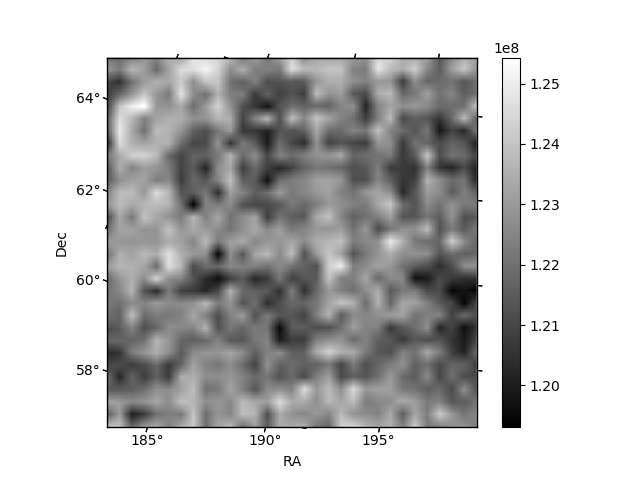
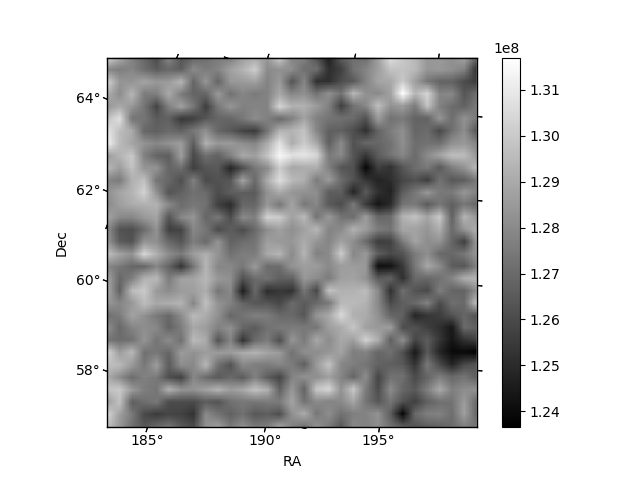
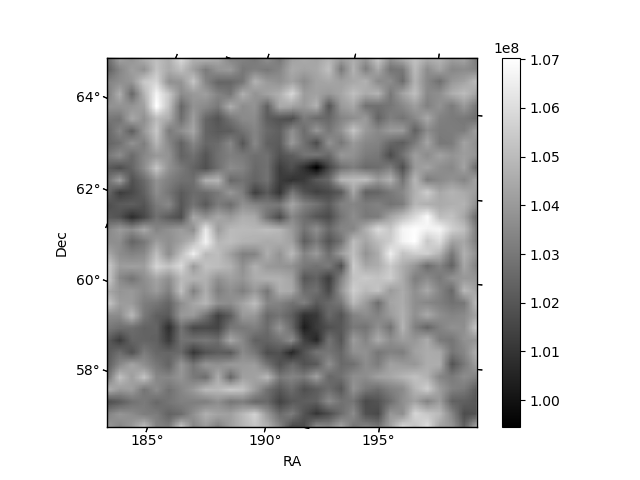
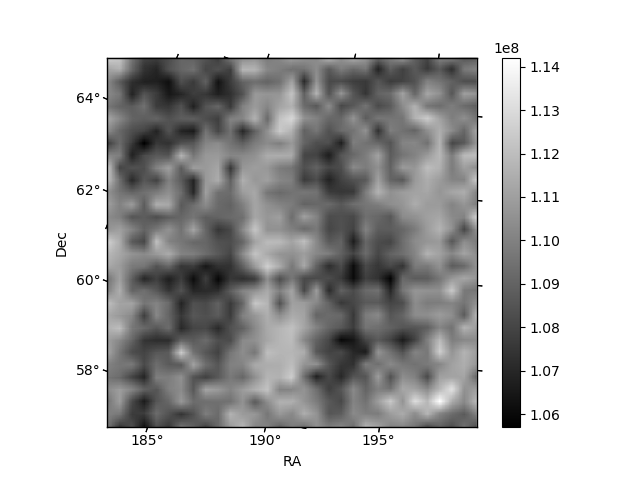
Histogram calculated using DETX and DETY for each event in the final _common_clean file
| Quadrant A | 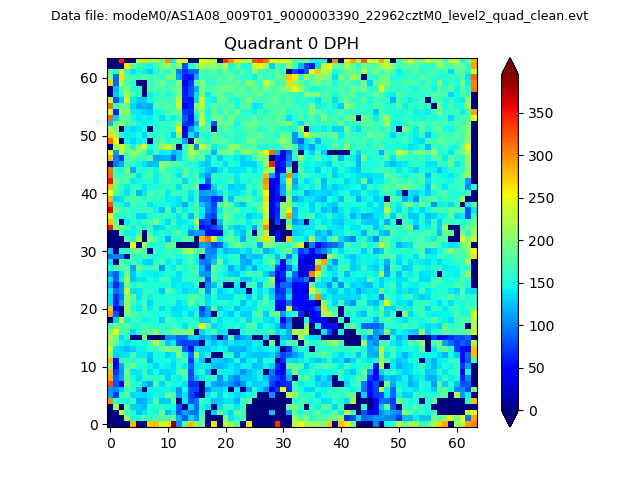 |
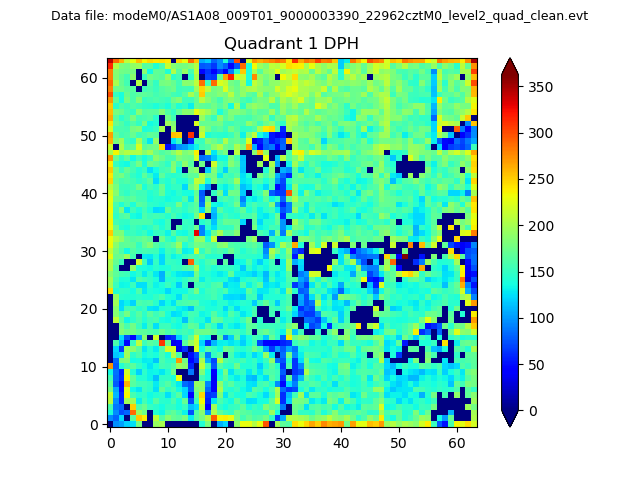 |
Quadrant B |
|---|---|---|---|
| Quadrant D | 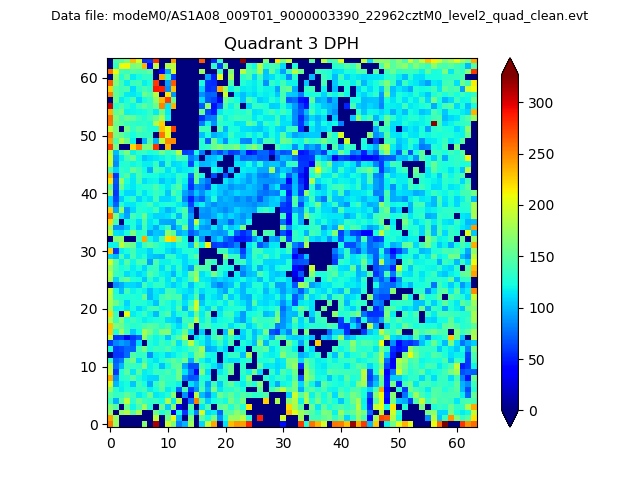 |
 |
Quadrant C |
| Plot type | Count rate plots | Images |
|---|---|---|
| Comparison with Poisson distribution Blue bars denote a histogram of data divided into 1 sec bins. Red curve is a Poisson curve with rate = median count rate of data. |
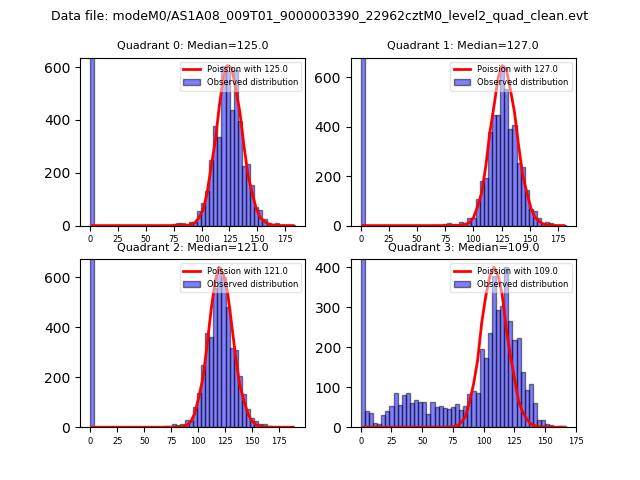 |
 |
| Quadrant-wise count rates Data is divided into 100 sec bins |
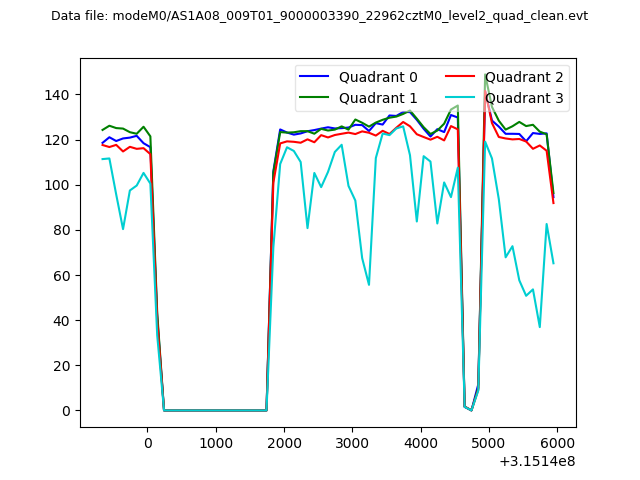 |
|
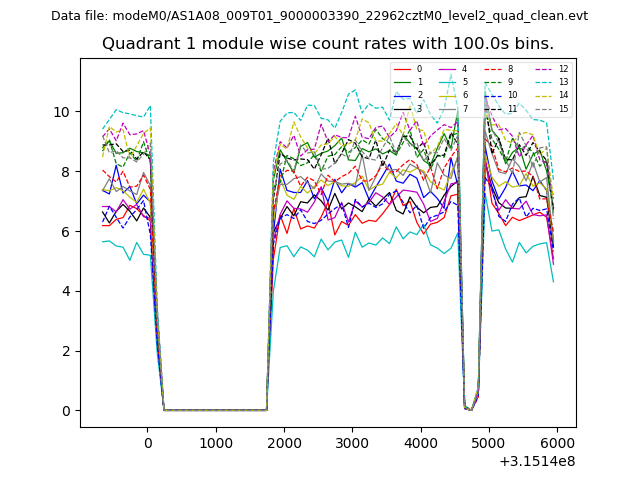
| Module-wise count rates for Quadrant A Data is divided into 100 sec bins |
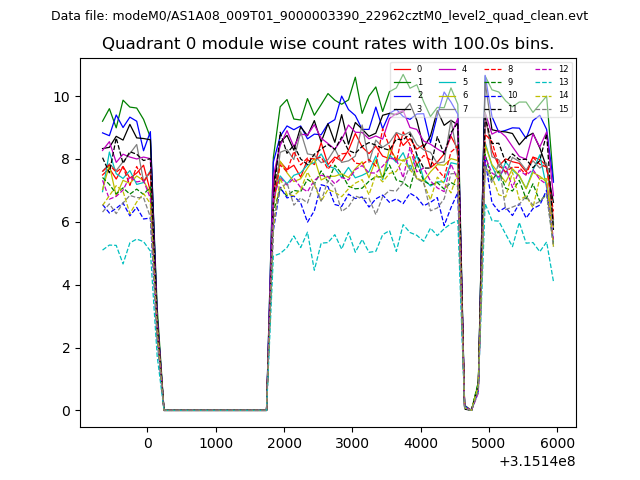 |
 |
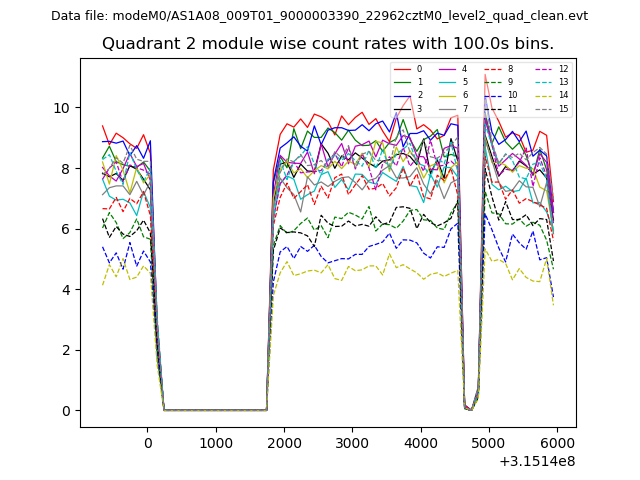
| Module-wise count rates for Quadrant B Data is divided into 100 sec bins |
 |
 |
| Module-wise count rates for Quadrant C Data is divided into 100 sec bins |
 |
 |
| Module-wise count rates for Quadrant D Data is divided into 100 sec bins |
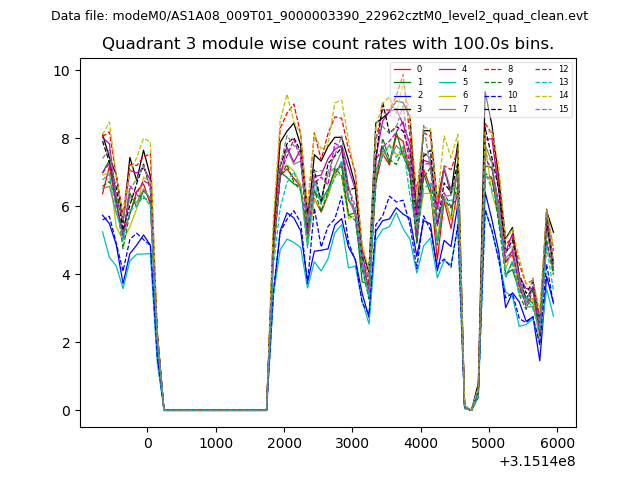 |
 |
| Parameter | Plot |
|---|---|
| CZT HV Monitor | 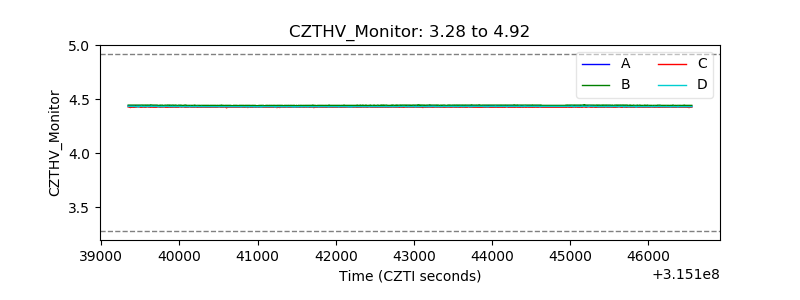 |
| D_VDD |  |
| Temperature 1 | 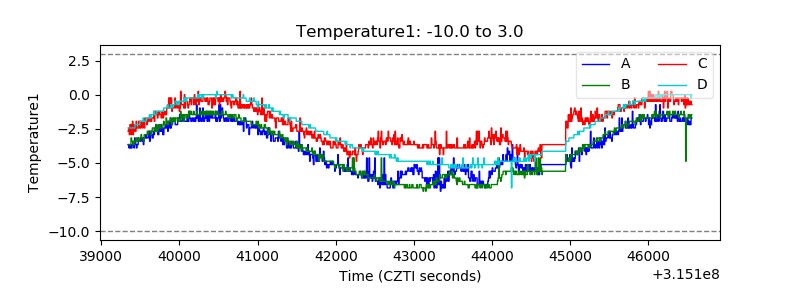 |
| Veto HV Monitor | 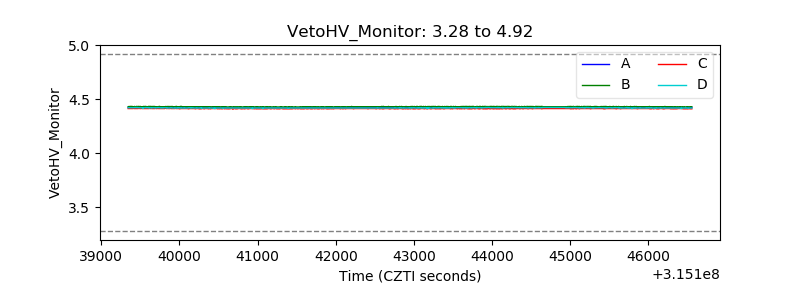 |
| Veto LLD | 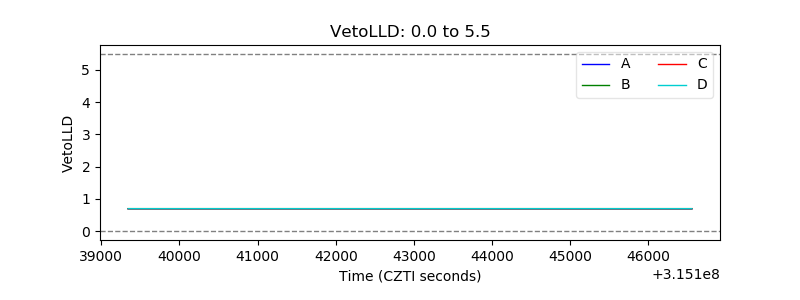 |
| Alpha Counter | 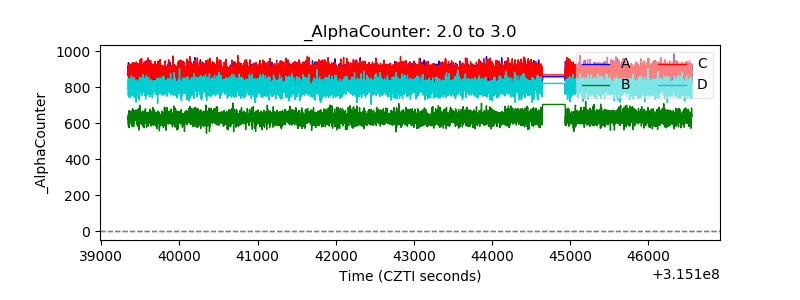 |
| _CPM_Rate | 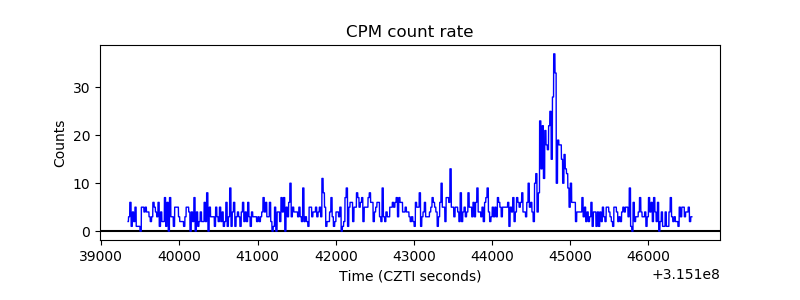 |
| CZT Counter | 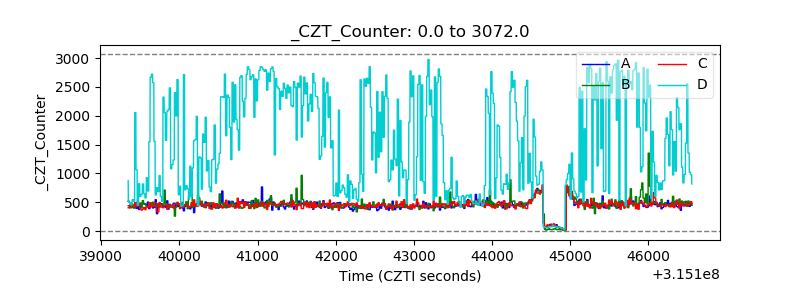 |
| +2.5 Volts monitor |  |
| +5 Volts monitor |  |
| _ROLL_ROT | 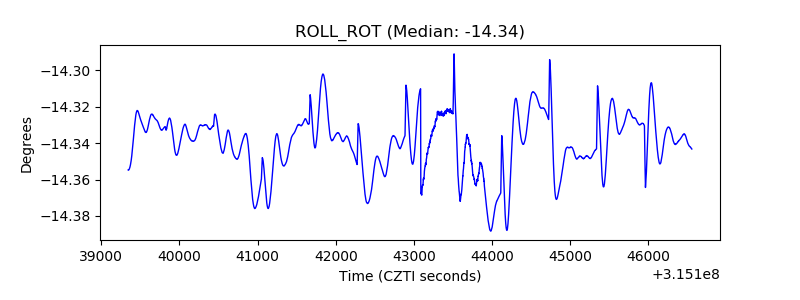 |
| _Roll_DEC | 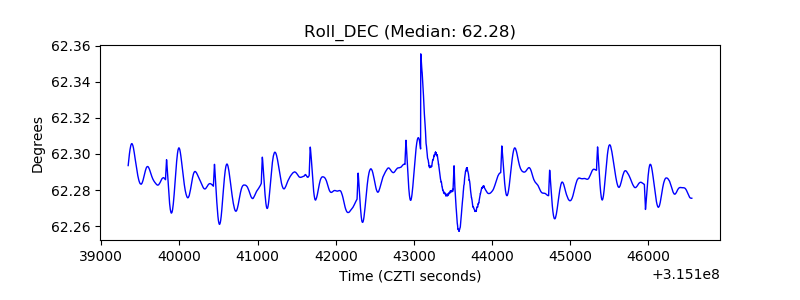 |
| _Roll_RA |  |
| Veto Counter | 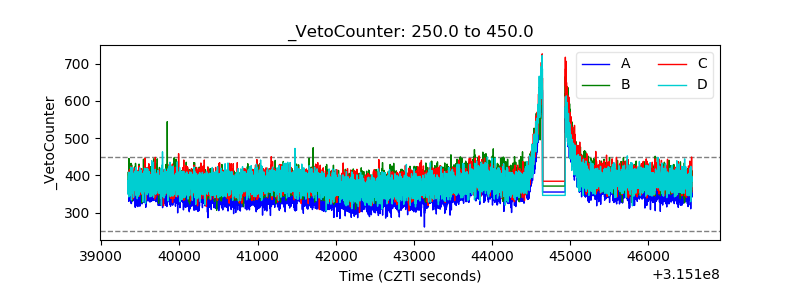 |