| Param | Original file | Final file |
|---|---|---|
| Filename | modeM0/AS1A08_009T01_9000003390_22965cztM0_level2.evt | modeM0/AS1A08_009T01_9000003390_22965cztM0_level2_quad_clean.evt |
| Size (bytes) | 689,345,280 | 106,076,160 |
| Size | 657.4 MB | 101.2 MB |
| Events in quadrant A | 4,017,269 | 671,392 |
| Events in quadrant B | 4,212,759 | 680,359 |
| Events in quadrant C | 4,052,163 | 653,114 |
| Events in quadrant D | 7,996,199 | 594,274 |
| Mode M9 | |||
|---|---|---|---|
| Quadrant | BADHDUFLAG | Total packets | Discarded packets |
| A | 0 | 4 | 0 |
| B | 0 | 4 | 0 |
| C | 0 | 4 | 0 |
| D | 0 | 4 | 0 |
| Mode SS | |||
|---|---|---|---|
| Quadrant | BADHDUFLAG | Total packets | Discarded packets |
| A | 0 | 180 | 0 |
| B | 0 | 180 | 0 |
| C | 0 | 180 | 0 |
| D | 0 | 180 | 0 |
| Mode M0 | |||
|---|---|---|---|
| Quadrant | BADHDUFLAG | Total packets | Discarded packets |
| A | 0 | 17849 | 1 |
| B | 0 | 18265 | 1 |
| C | 0 | 17910 | 1 |
| D | 0 | 29835 | 1 |
| Quadrant | Total seconds | Saturated seconds | Saturation percentage |
|---|---|---|---|
| A | 8823 | 63 | 0.714043% |
| B | 8824 | 96 | 1.087942% |
| C | 8824 | 98 | 1.110607% |
| D | 8824 | 1053 | 11.933364% |
Noise dominated data is calculated using 1-second bins in cleaned event files. If a bin has >2000 counts, and if more than 50% of those come from <1% of pixels, then it is considered to be noise-dominated and hence unusable.
| Quadrant | # 1 sec bins | Bins with >0 counts | Bins with >2000 counts | High rate bins dominated by noise | Noise dominated (total time) | Noise dominated (detector-on time) | Marked lightcurve |
|---|---|---|---|---|---|---|---|
| A | 9293 | 8824 | 0 | 0 | 0.00% | 0.00% | 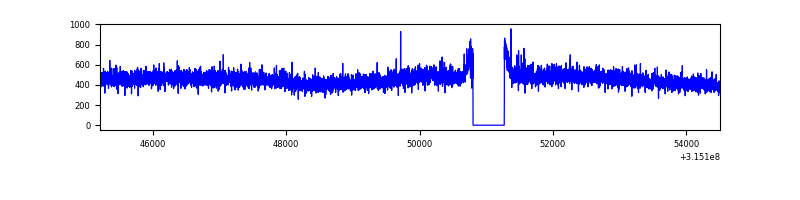 |
| B | 9294 | 8825 | 9 | 9 | 0.10% | 0.10% | 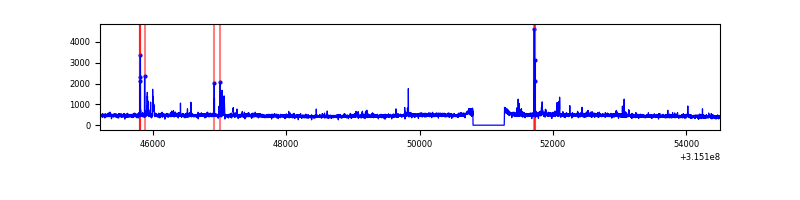 |
| C | 9294 | 8825 | 0 | 0 | 0.00% | 0.00% | 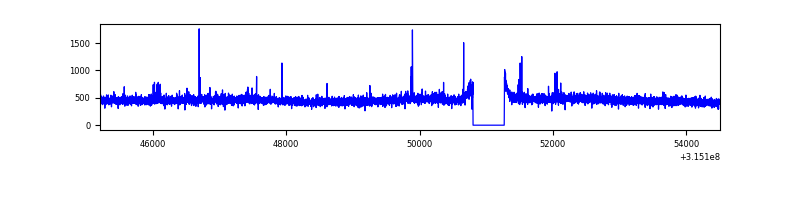 |
| D | 9294 | 8825 | 824 | 824 | 8.87% | 9.34% | 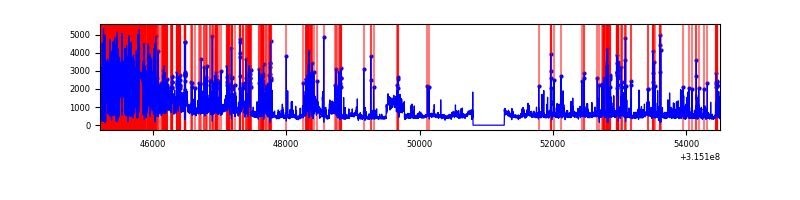 |
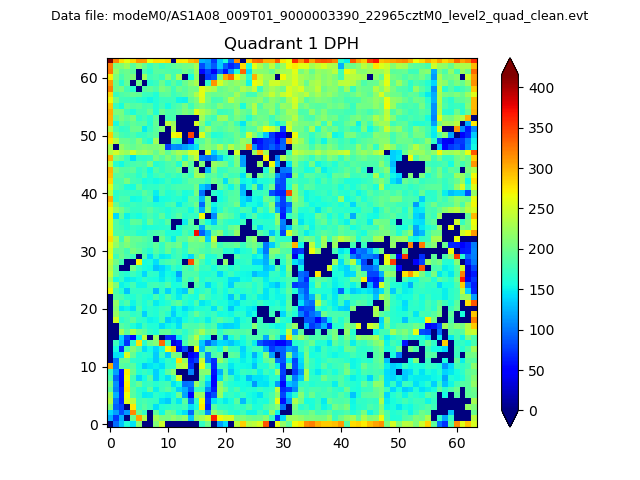
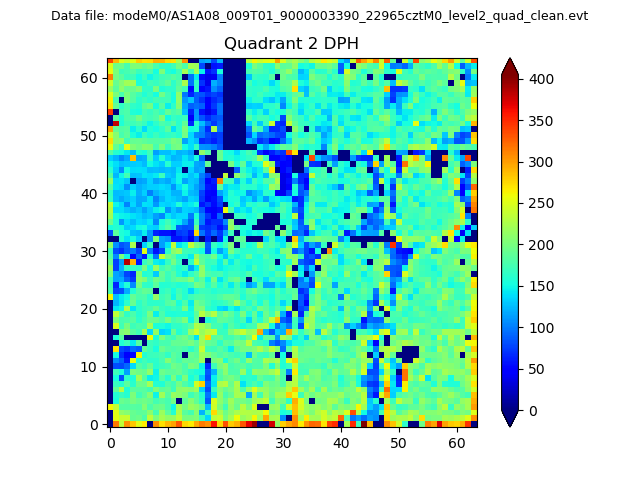
Top three noisy pixels from each quadrant. If the there are fewer than three noisy pixels in the level2.evt file, extra rows are filled as -1
| Pixel properties | Quadrant properties | ||||||
|---|---|---|---|---|---|---|---|
| Quadrant | DetID | PixID | Counts | Sigma | Mean | Median | Sigma |
| A | 13 | 170 | 30530 | 141.89 | 1031 | 1008 | 208.1 |
| A | 13 | 254 | 16357 | 73.77 | 1031 | 1008 | 208.1 |
| A | 0 | 226 | 8933 | 38.09 | 1031 | 1008 | 208.1 |
| B | 0 | 190 | 99561 | 503.38 | 1025 | 1000 | 195.8 |
| B | 0 | 189 | 37195 | 184.86 | 1025 | 1000 | 195.8 |
| B | 4 | 216 | 30504 | 150.69 | 1025 | 1000 | 195.8 |
| C | 14 | 238 | 154864 | 668.3 | 984 | 990 | 230.2 |
| C | 7 | 247 | 31647 | 133.15 | 984 | 990 | 230.2 |
| C | 0 | 239 | 14448 | 58.45 | 984 | 990 | 230.2 |
| D | 1 | 52 | 3508326 | 15075.19 | 948 | 919 | 232.7 |
| D | 13 | 172 | 407615 | 1748.02 | 948 | 919 | 232.7 |
| D | 13 | 153 | 163230 | 697.63 | 948 | 919 | 232.7 |
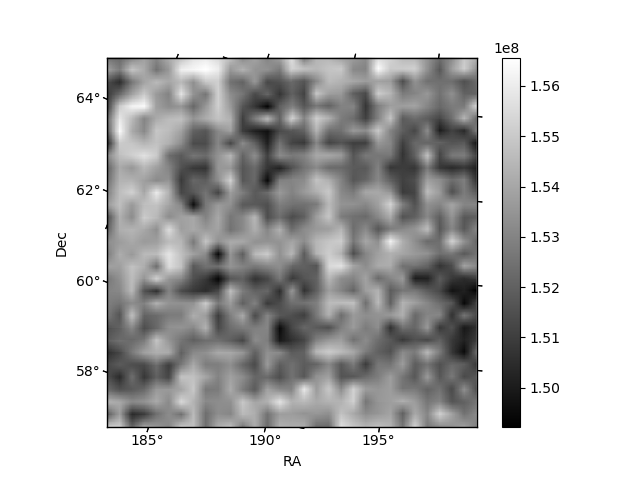
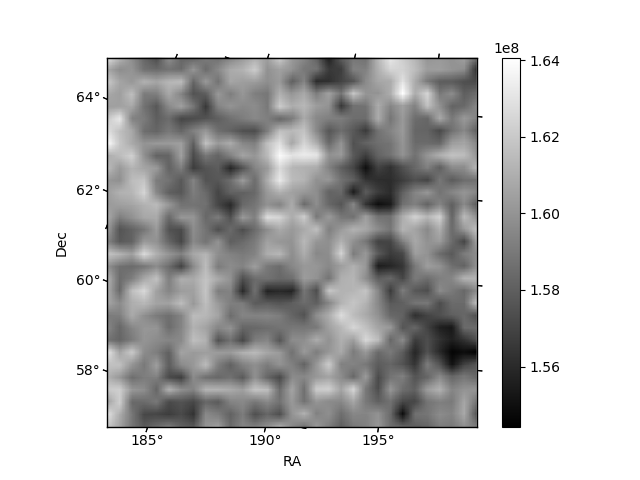
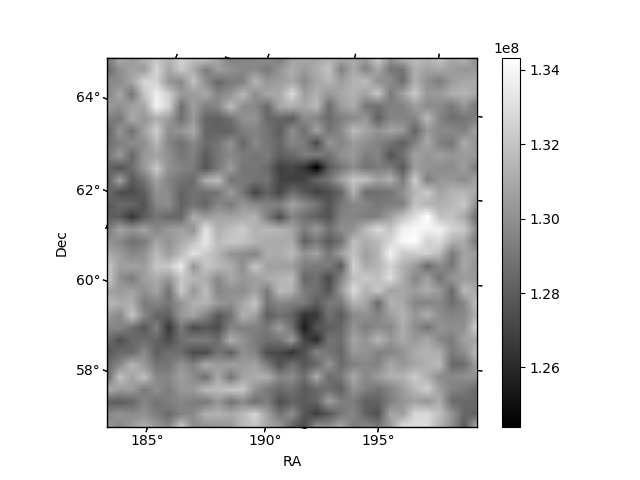
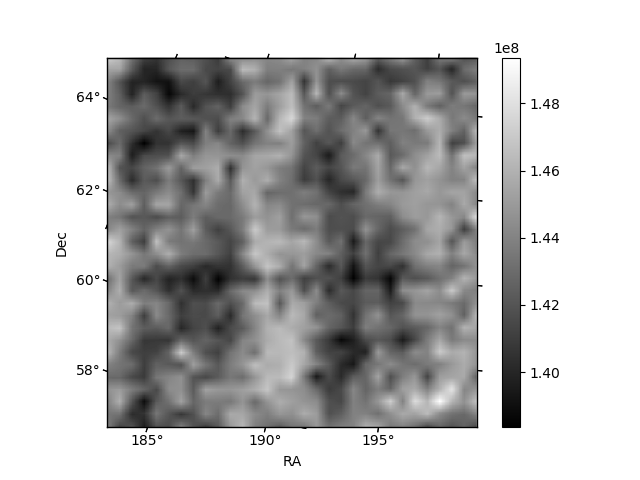
Histogram calculated using DETX and DETY for each event in the final _common_clean file
| Quadrant A | 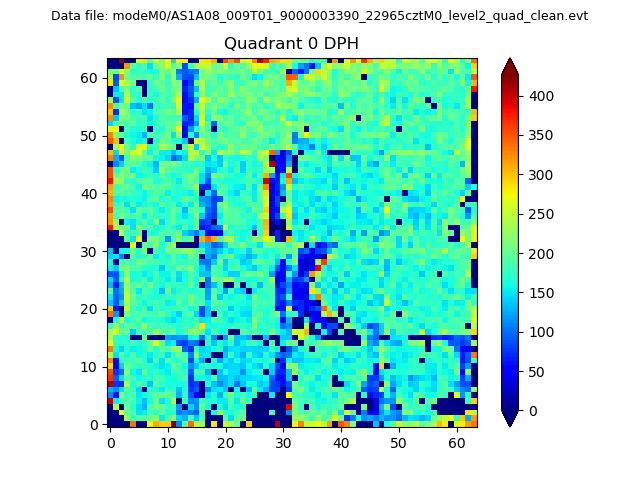 |
 |
Quadrant B |
|---|---|---|---|
| Quadrant D | 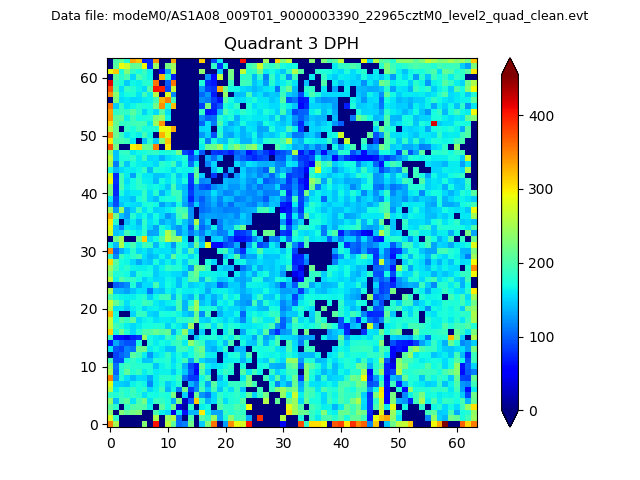 |
 |
Quadrant C |
| Plot type | Count rate plots | Images |
|---|---|---|
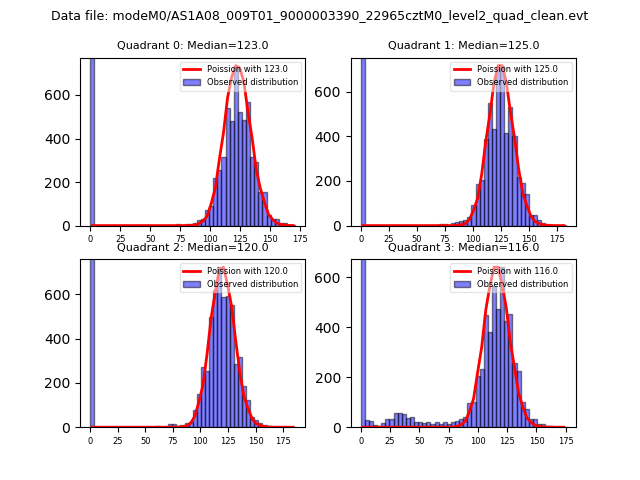
| Comparison with Poisson distribution Blue bars denote a histogram of data divided into 1 sec bins. Red curve is a Poisson curve with rate = median count rate of data. |
 |
 |
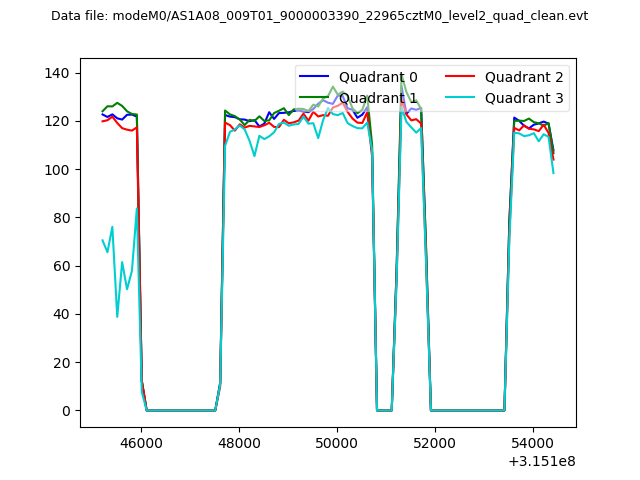
| Quadrant-wise count rates Data is divided into 100 sec bins |
 |
|
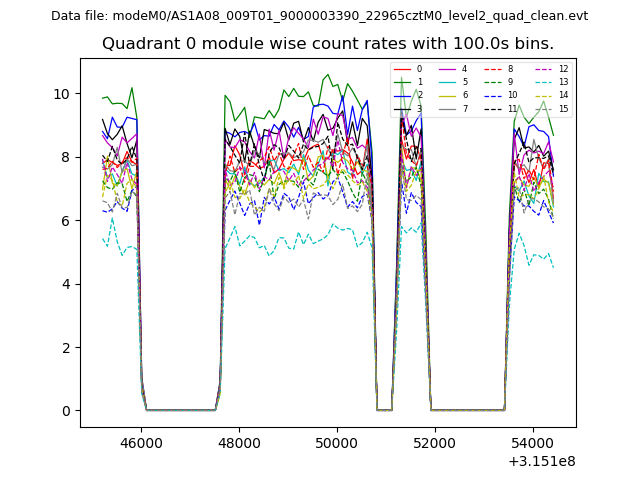
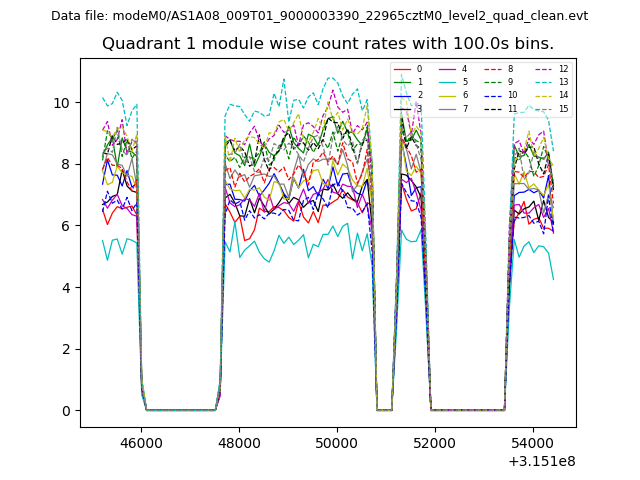
| Module-wise count rates for Quadrant A Data is divided into 100 sec bins |
 |
 |
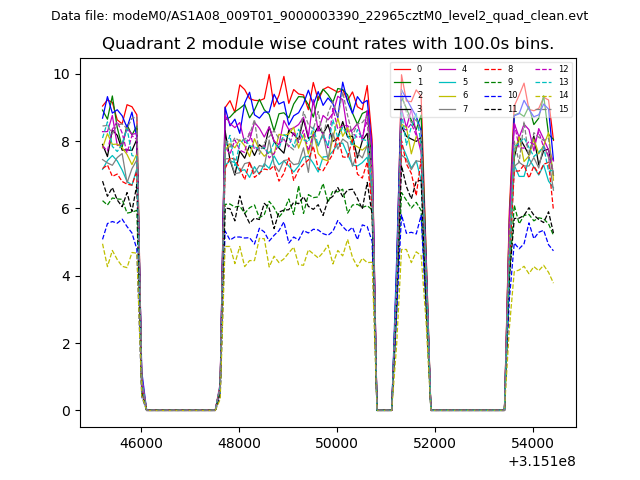
| Module-wise count rates for Quadrant B Data is divided into 100 sec bins |
 |
 |
| Module-wise count rates for Quadrant C Data is divided into 100 sec bins |
 |
 |
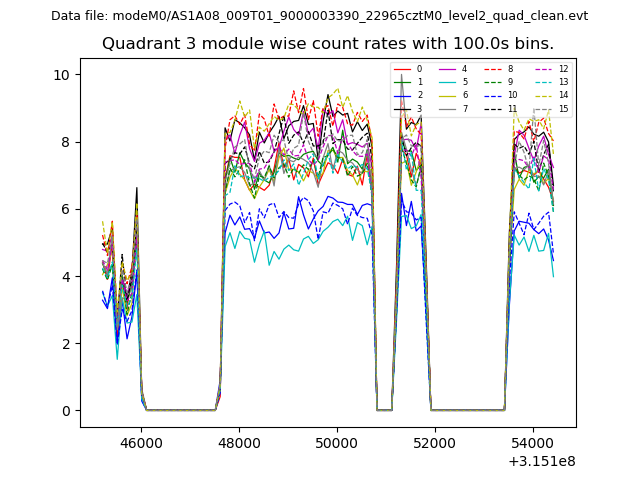
| Module-wise count rates for Quadrant D Data is divided into 100 sec bins |
 |
 |
| Parameter | Plot |
|---|---|
| CZT HV Monitor |  |
| D_VDD | 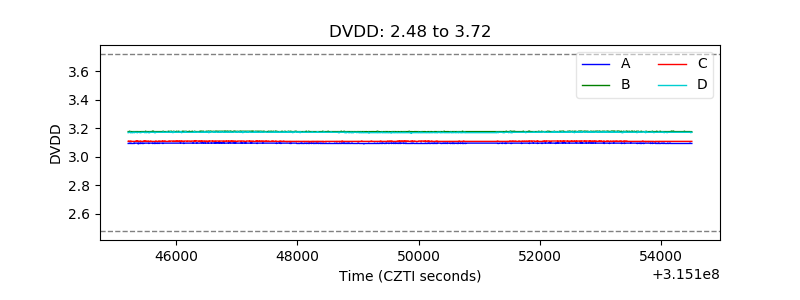 |
| Temperature 1 | 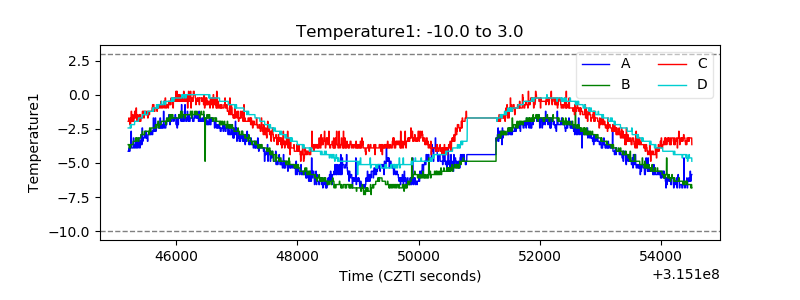 |
| Veto HV Monitor | 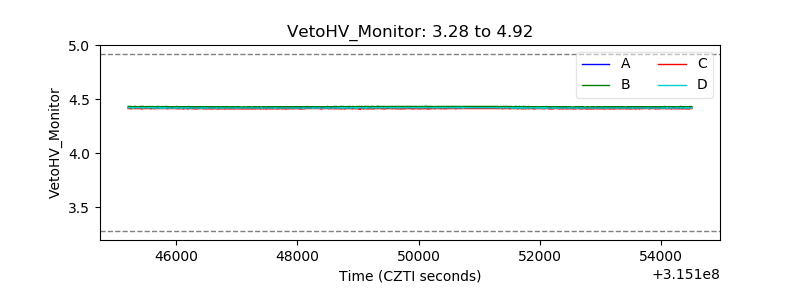 |
| Veto LLD | 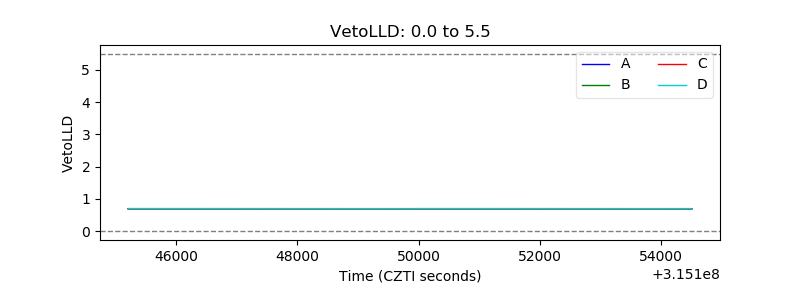 |
| Alpha Counter | 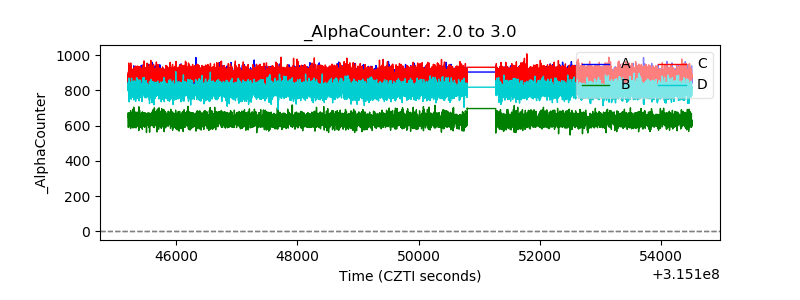 |
| _CPM_Rate | 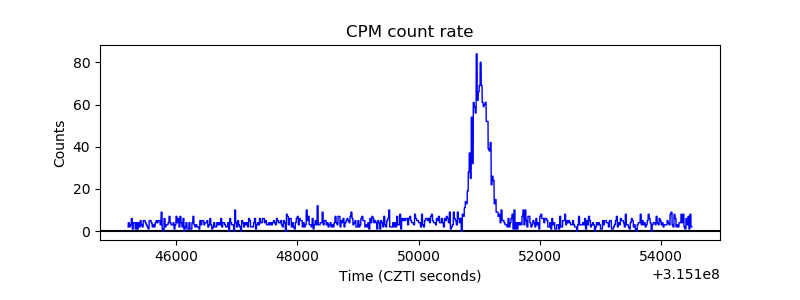 |
| CZT Counter | 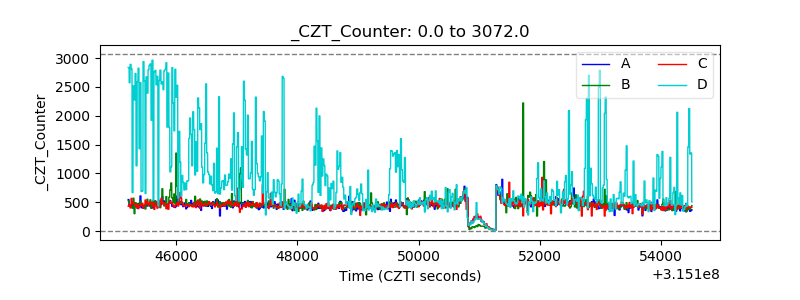 |
| +2.5 Volts monitor |  |
| +5 Volts monitor |  |
| _ROLL_ROT | 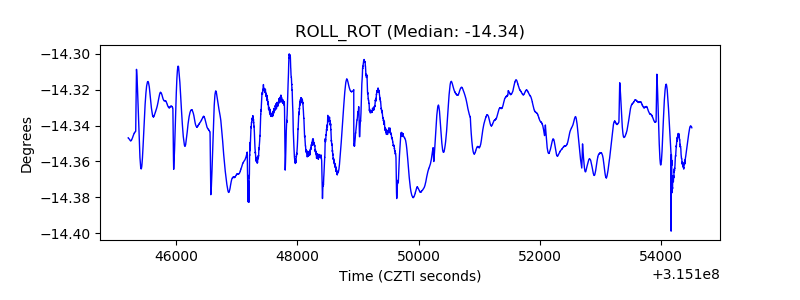 |
| _Roll_DEC | 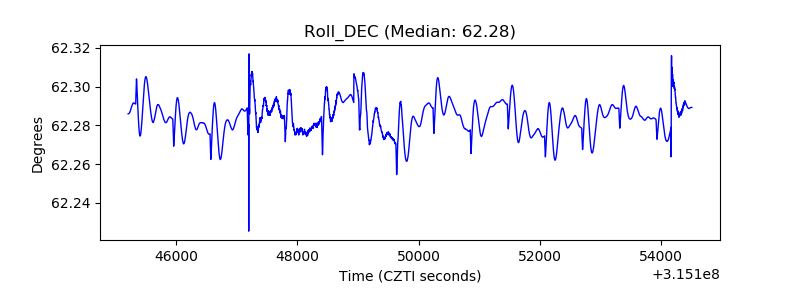 |
| _Roll_RA | 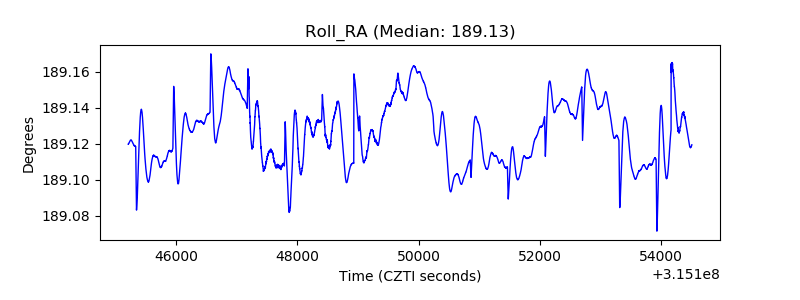 |
| Veto Counter | 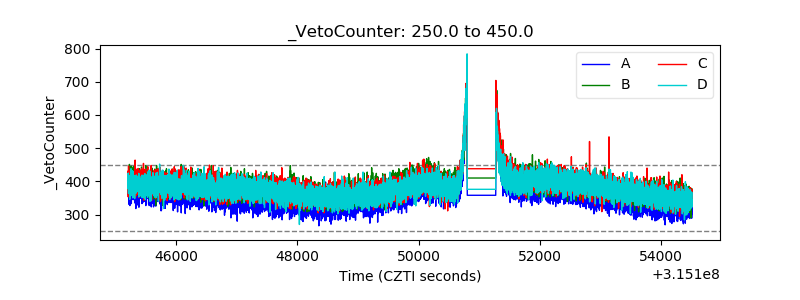 |