| Param | Original file | Final file |
|---|---|---|
| Filename | modeM0/AS1A07_062T01_9000003392cztM0_level2.fits | modeM0/AS1A07_062T01_9000003392cztM0_level2_quad_clean.evt |
| Size (bytes) | 574,084,800 | 474,330,240 |
| Size | 547.5 MB | 452.4 MB |
| Events in quadrant A | 3,557,098 | 2,735,893 |
| Events in quadrant B | 3,431,148 | 2,725,878 |
| Events in quadrant C | 3,419,930 | 2,565,035 |
| Events in quadrant D | 2,995,886 | 2,354,359 |
| Mode M9 | |||
|---|---|---|---|
| Quadrant | BADHDUFLAG | Total packets | Discarded packets |
| A | 0 | 112 | 0 |
| B | 0 | 112 | 0 |
| C | 0 | 112 | 0 |
| D | 0 | 112 | 0 |
| Mode SS | |||
|---|---|---|---|
| Quadrant | BADHDUFLAG | Total packets | Discarded packets |
| A | 0 | 1184 | 0 |
| B | 0 | 1184 | 0 |
| C | 0 | 1184 | 0 |
| D | 0 | 1184 | 0 |
| Mode M0 | |||
|---|---|---|---|
| Quadrant | BADHDUFLAG | Total packets | Discarded packets |
| A | 0 | 120705 | 0 |
| B | 0 | 121157 | 0 |
| C | 0 | 122199 | 0 |
| D | 0 | 137126 | 0 |
| Quadrant | Total seconds | Saturated seconds | Saturation percentage |
|---|---|---|---|
| A | 58052 | 435 | 0.749328% |
| B | 58052 | 558 | 0.961207% |
| C | 58052 | 980 | 1.688142% |
| D | 58052 | 1143 | 1.968924% |
Noise dominated data is calculated using 1-second bins in cleaned event files. If a bin has >2000 counts, and if more than 50% of those come from <1% of pixels, then it is considered to be noise-dominated and hence unusable.
| Quadrant | # 1 sec bins | Bins with >0 counts | Bins with >2000 counts | High rate bins dominated by noise | Noise dominated (total time) | Noise dominated (detector-on time) | Marked lightcurve |
|---|---|---|---|---|---|---|---|
| A | 69232 | 58051 | 0 | 0 | 0.00% | 0.00% |  |
| B | 69232 | 58050 | 0 | 0 | 0.00% | 0.00% |  |
| C | 69232 | 58051 | 0 | 0 | 0.00% | 0.00% |  |
| D | 69232 | 58039 | 0 | 0 | 0.00% | 0.00% |  |
Top three noisy pixels from each quadrant. If the there are fewer than three noisy pixels in the level2.evt file, extra rows are filled as -1
| Pixel properties | Quadrant properties | ||||||
|---|---|---|---|---|---|---|---|
| Quadrant | DetID | PixID | Counts | Sigma | Mean | Median | Sigma |
| A | 0 | 29 | 3431 | 11.1 | 925 | 870 | 230.7 |
| A | 7 | 110 | 2791 | 8.33 | 925 | 870 | 230.7 |
| A | 9 | 19 | 2723 | 8.03 | 925 | 870 | 230.7 |
| B | 2 | 9 | 2819 | 11.04 | 906 | 868 | 176.8 |
| B | 3 | 80 | 2342 | 8.34 | 906 | 868 | 176.8 |
| B | 2 | 8 | 2296 | 8.08 | 906 | 868 | 176.8 |
| C | 12 | 241 | 2474 | 7.04 | 905 | 850 | 230.8 |
| C | 3 | 126 | 2340 | 6.46 | 905 | 850 | 230.8 |
| C | 3 | 187 | 2271 | 6.16 | 905 | 850 | 230.8 |
| D | 3 | 14 | 2163 | 6.06 | 854 | 778 | 228.5 |
| D | 6 | 231 | 2140 | 5.96 | 854 | 778 | 228.5 |
| D | 7 | 3 | 2130 | 5.92 | 854 | 778 | 228.5 |
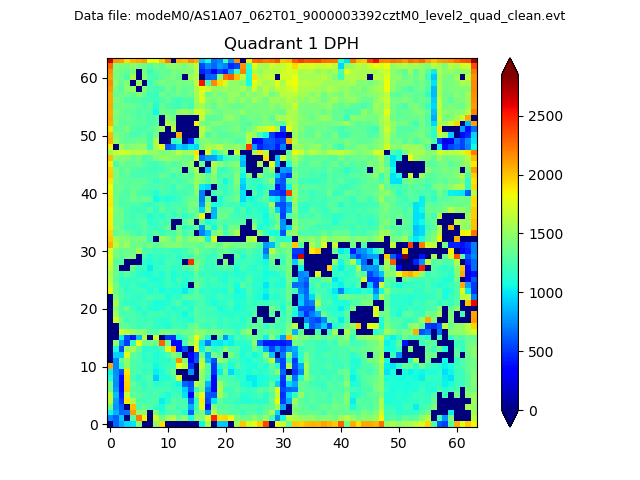
Histogram calculated using DETX and DETY for each event in the final _common_clean file
| Quadrant A |  |
 |
Quadrant B |
|---|---|---|---|
| Quadrant D | 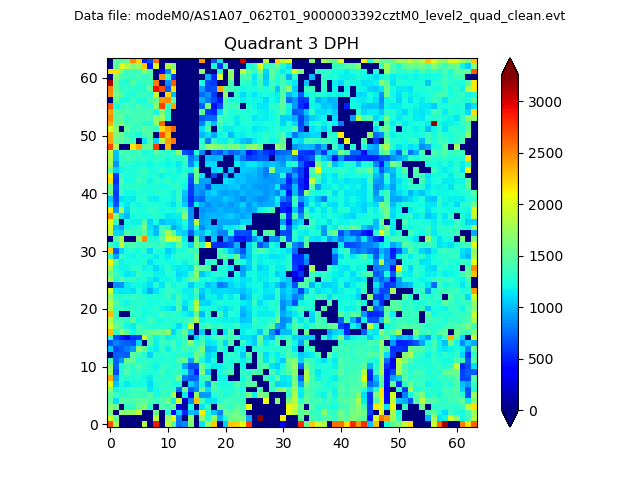 |
 |
Quadrant C |
| Plot type | Count rate plots | Images |
|---|---|---|
| Comparison with Poisson distribution Blue bars denote a histogram of data divided into 1 sec bins. Red curve is a Poisson curve with rate = median count rate of data. |
 |
 |
| Quadrant-wise count rates Data is divided into 100 sec bins |
 |
|
| Module-wise count rates for Quadrant A Data is divided into 100 sec bins |
 |
 |
| Module-wise count rates for Quadrant B Data is divided into 100 sec bins |
 |
 |
| Module-wise count rates for Quadrant C Data is divided into 100 sec bins |
 |
 |
| Module-wise count rates for Quadrant D Data is divided into 100 sec bins |
 |
 |
| Parameter | Plot |
|---|---|
| CZT HV Monitor |  |
| D_VDD | 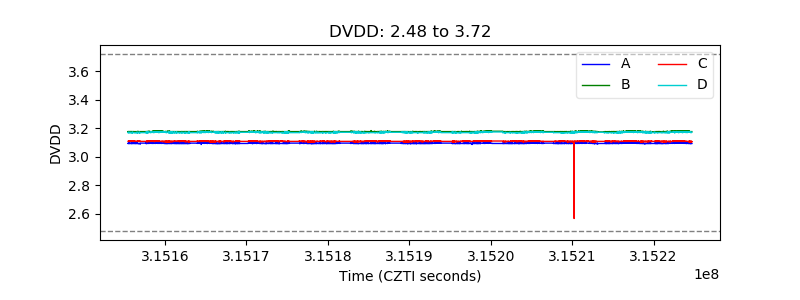 |
| Temperature 1 |  |
| Veto HV Monitor |  |
| Veto LLD |  |
| Alpha Counter |  |
| _CPM_Rate |  |
| CZT Counter |  |
| +2.5 Volts monitor |  |
| +5 Volts monitor |  |
| _ROLL_ROT |  |
| _Roll_DEC |  |
| _Roll_RA |  |
| Veto Counter |  |