| Param | Original file | Final file |
|---|---|---|
| Filename | modeM0/AS1A07_062T01_9000003392_22965cztM0_level2.evt | modeM0/AS1A07_062T01_9000003392_22965cztM0_level2_quad_clean.evt |
| Size (bytes) | 590,964,480 | 102,015,360 |
| Size | 563.6 MB | 97.3 MB |
| Events in quadrant A | 4,047,301 | 644,348 |
| Events in quadrant B | 4,111,551 | 642,304 |
| Events in quadrant C | 4,090,338 | 613,715 |
| Events in quadrant D | 5,075,321 | 602,357 |
| Mode M9 | |||
|---|---|---|---|
| Quadrant | BADHDUFLAG | Total packets | Discarded packets |
| A | 0 | 16 | 0 |
| B | 0 | 16 | 0 |
| C | 0 | 16 | 0 |
| D | 0 | 16 | 0 |
| Mode SS | |||
|---|---|---|---|
| Quadrant | BADHDUFLAG | Total packets | Discarded packets |
| A | 0 | 172 | 0 |
| B | 0 | 172 | 0 |
| C | 0 | 172 | 0 |
| D | 0 | 172 | 0 |
| Mode M0 | |||
|---|---|---|---|
| Quadrant | BADHDUFLAG | Total packets | Discarded packets |
| A | 0 | 17554 | 2 |
| B | 0 | 17545 | 2 |
| C | 0 | 17564 | 2 |
| D | 0 | 20779 | 2 |
| Quadrant | Total seconds | Saturated seconds | Saturation percentage |
|---|---|---|---|
| A | 8448 | 93 | 1.100852% |
| B | 8448 | 106 | 1.254735% |
| C | 8448 | 145 | 1.716383% |
| D | 8448 | 268 | 3.172348% |
Noise dominated data is calculated using 1-second bins in cleaned event files. If a bin has >2000 counts, and if more than 50% of those come from <1% of pixels, then it is considered to be noise-dominated and hence unusable.
| Quadrant | # 1 sec bins | Bins with >0 counts | Bins with >2000 counts | High rate bins dominated by noise | Noise dominated (total time) | Noise dominated (detector-on time) | Marked lightcurve |
|---|---|---|---|---|---|---|---|
| A | 9963 | 8450 | 1 | 1 | 0.01% | 0.01% | 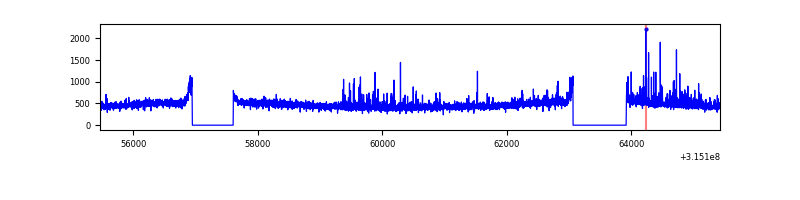 |
| B | 9963 | 8450 | 4 | 4 | 0.04% | 0.05% | 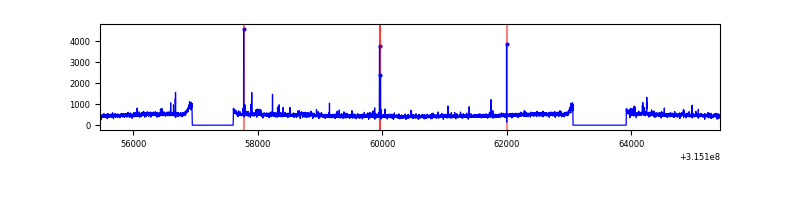 |
| C | 9963 | 8450 | 5 | 5 | 0.05% | 0.06% | 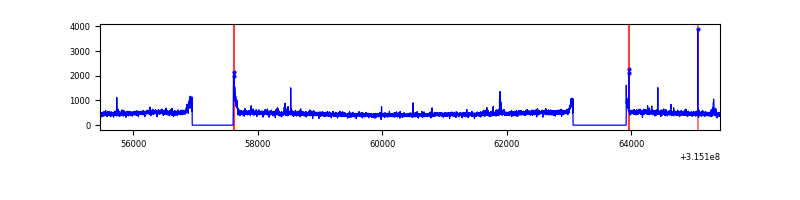 |
| D | 9963 | 8450 | 148 | 148 | 1.49% | 1.75% | 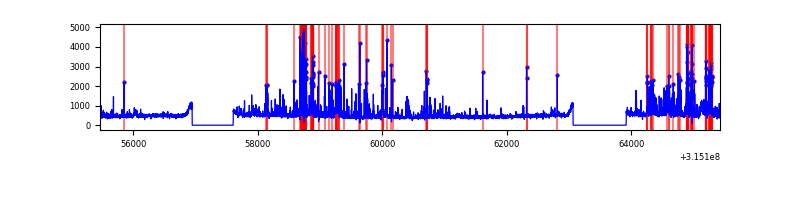 |
Top three noisy pixels from each quadrant. If the there are fewer than three noisy pixels in the level2.evt file, extra rows are filled as -1
| Pixel properties | Quadrant properties | ||||||
|---|---|---|---|---|---|---|---|
| Quadrant | DetID | PixID | Counts | Sigma | Mean | Median | Sigma |
| A | 6 | 16 | 93233 | 448.22 | 1022 | 997 | 205.8 |
| A | 13 | 254 | 14356 | 64.92 | 1022 | 997 | 205.8 |
| A | 13 | 170 | 11827 | 52.63 | 1022 | 997 | 205.8 |
| B | 0 | 189 | 54011 | 269.19 | 1017 | 992 | 197.0 |
| B | 12 | 111 | 24202 | 117.84 | 1017 | 992 | 197.0 |
| B | 0 | 190 | 21926 | 106.29 | 1017 | 992 | 197.0 |
| C | 14 | 238 | 155217 | 673.06 | 978 | 985 | 229.1 |
| C | 0 | 10 | 61029 | 262.03 | 978 | 985 | 229.1 |
| C | 7 | 247 | 46355 | 197.99 | 978 | 985 | 229.1 |
| D | 1 | 52 | 543248 | 2257.26 | 994 | 964 | 240.2 |
| D | 13 | 153 | 293207 | 1216.46 | 994 | 964 | 240.2 |
| D | 2 | 136 | 103598 | 427.21 | 994 | 964 | 240.2 |
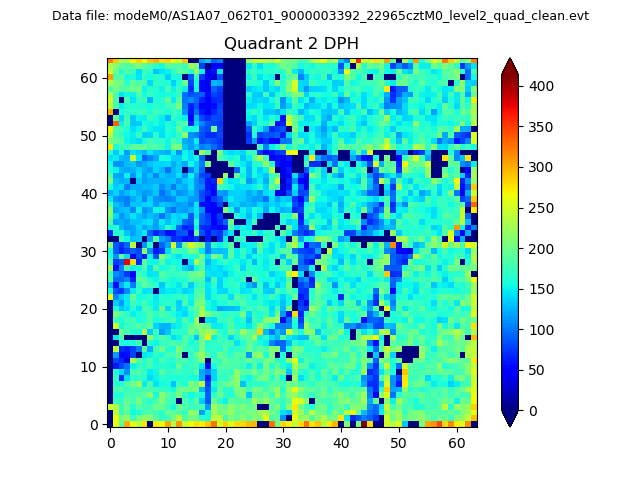
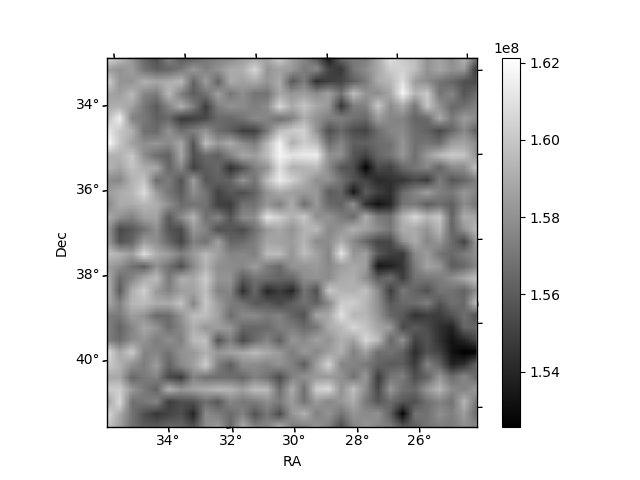
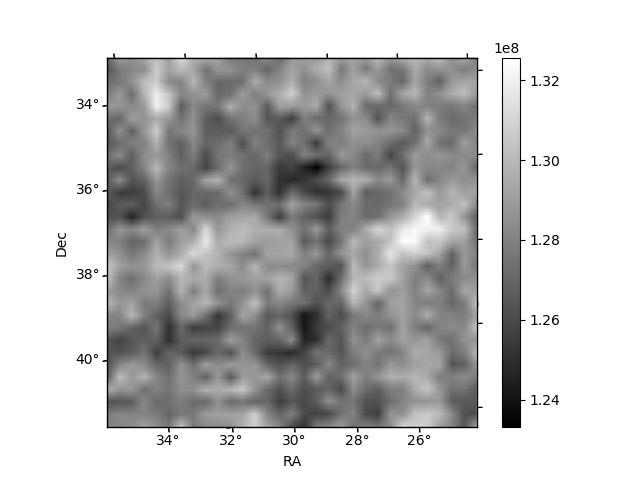
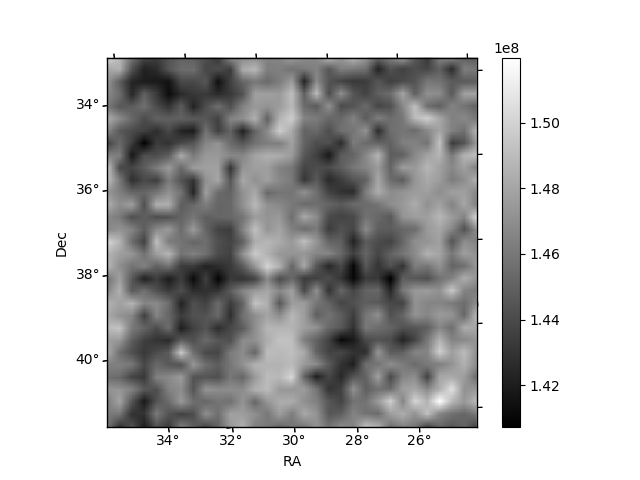
Histogram calculated using DETX and DETY for each event in the final _common_clean file
| Quadrant A | 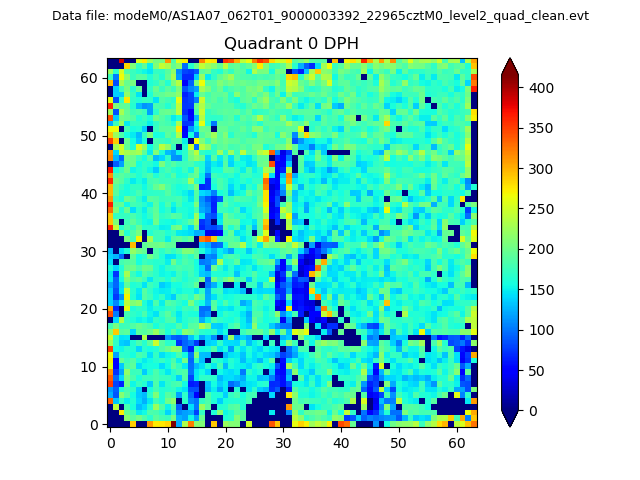 |
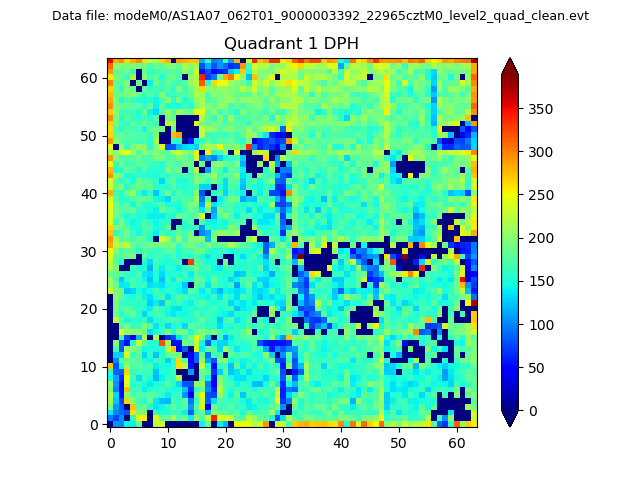 |
Quadrant B |
|---|---|---|---|
| Quadrant D | 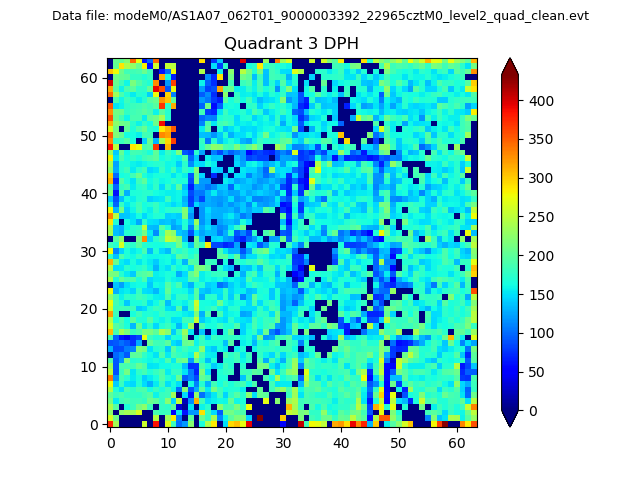 |
 |
Quadrant C |
| Plot type | Count rate plots | Images |
|---|---|---|
| Comparison with Poisson distribution Blue bars denote a histogram of data divided into 1 sec bins. Red curve is a Poisson curve with rate = median count rate of data. |
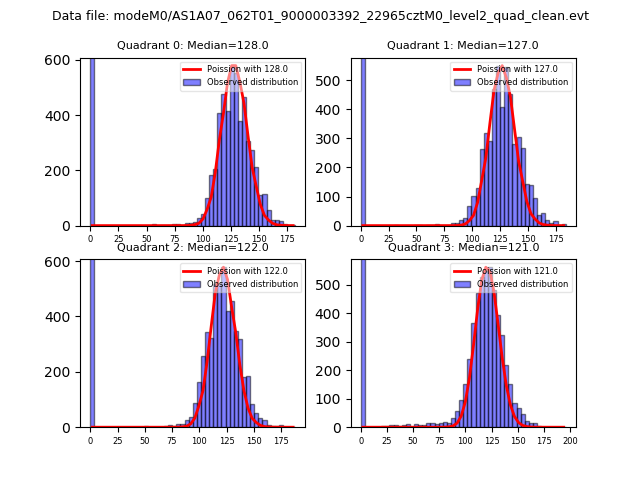 |
 |
| Quadrant-wise count rates Data is divided into 100 sec bins |
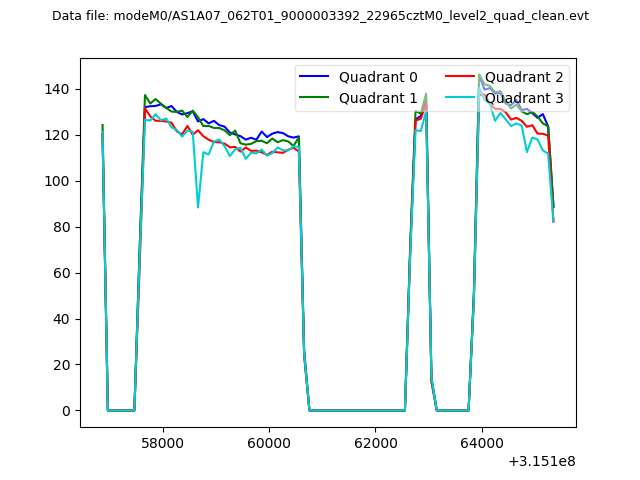 |
|
| Module-wise count rates for Quadrant A Data is divided into 100 sec bins |
 |
 |
| Module-wise count rates for Quadrant B Data is divided into 100 sec bins |
 |
 |
| Module-wise count rates for Quadrant C Data is divided into 100 sec bins |
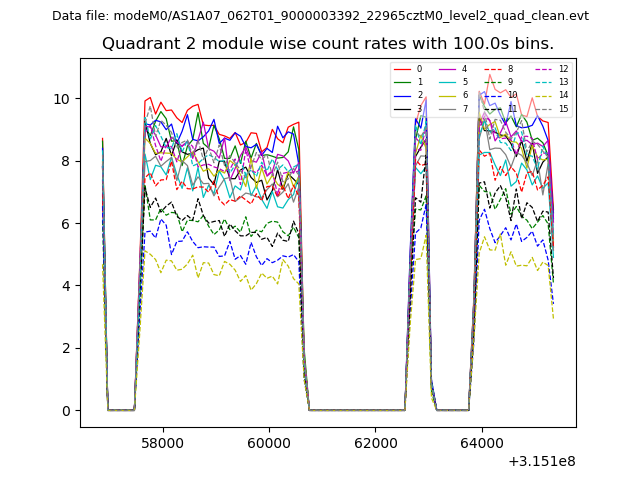 |
 |
| Module-wise count rates for Quadrant D Data is divided into 100 sec bins |
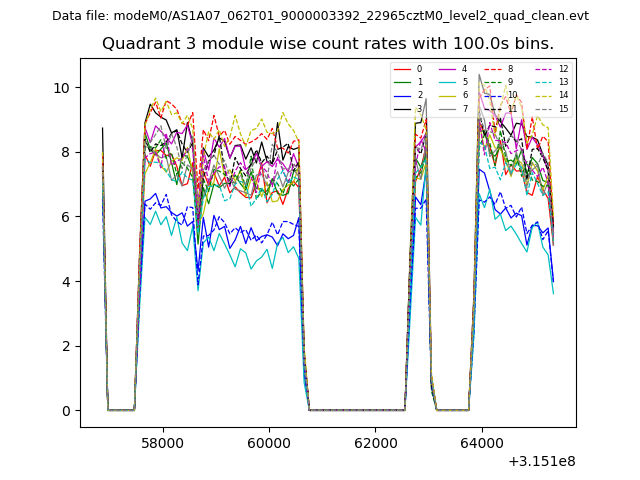 |
 |
| Parameter | Plot |
|---|---|
| CZT HV Monitor |  |
| D_VDD | 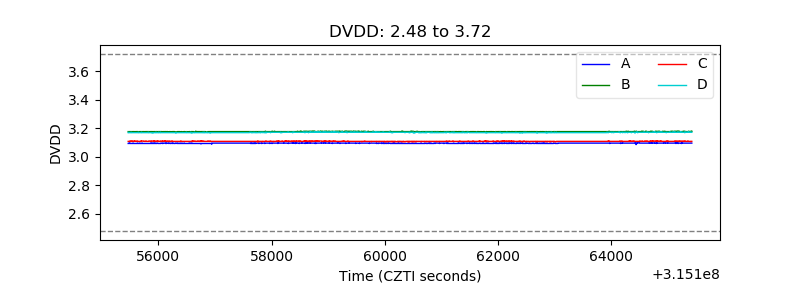 |
| Temperature 1 | 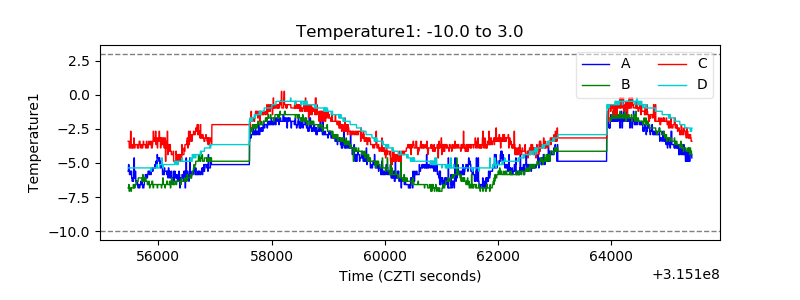 |
| Veto HV Monitor | 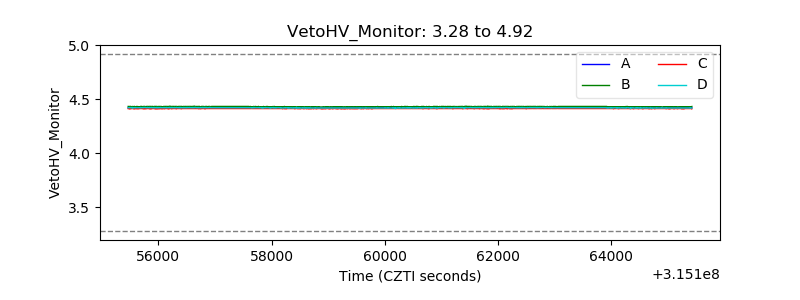 |
| Veto LLD | 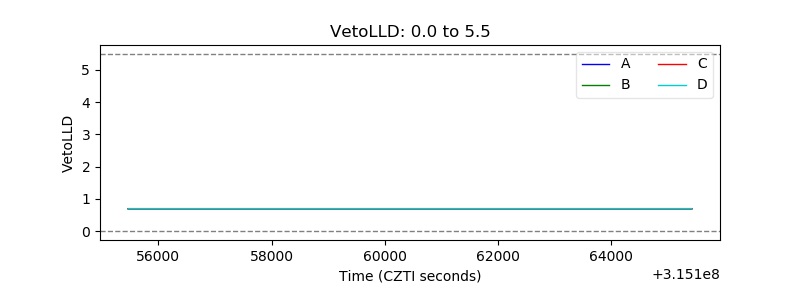 |
| Alpha Counter | 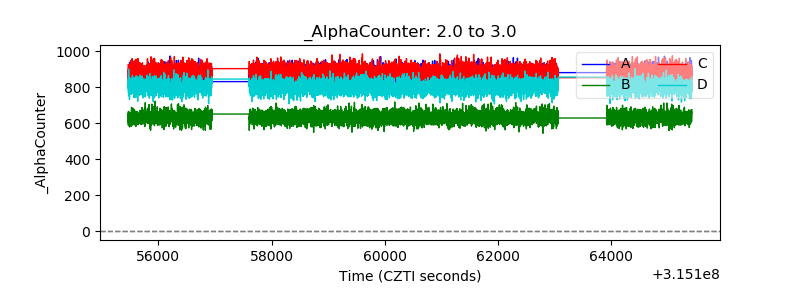 |
| _CPM_Rate | 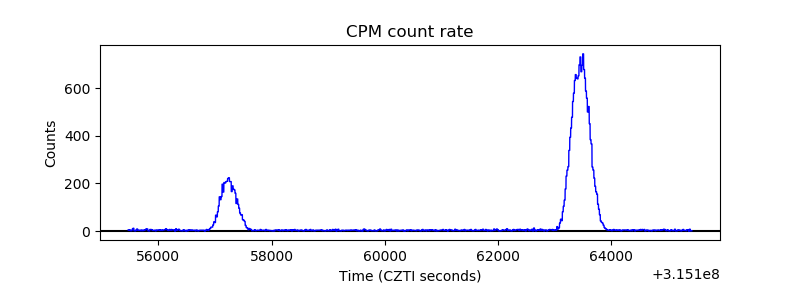 |
| CZT Counter | 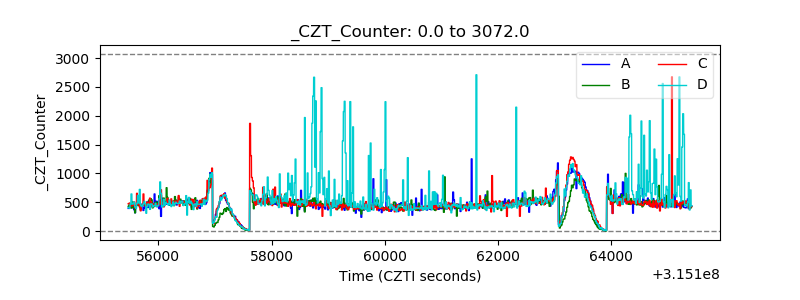 |
| +2.5 Volts monitor |  |
| +5 Volts monitor | 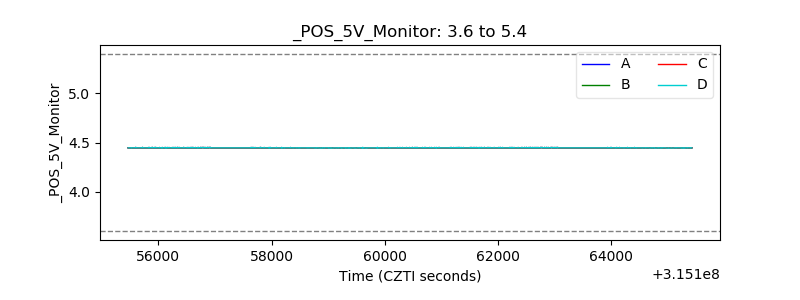 |
| _ROLL_ROT | 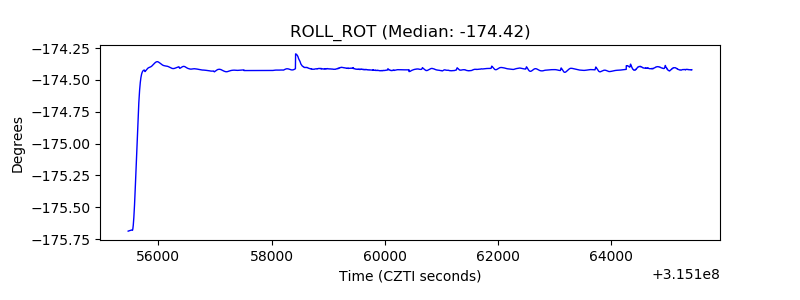 |
| _Roll_DEC | 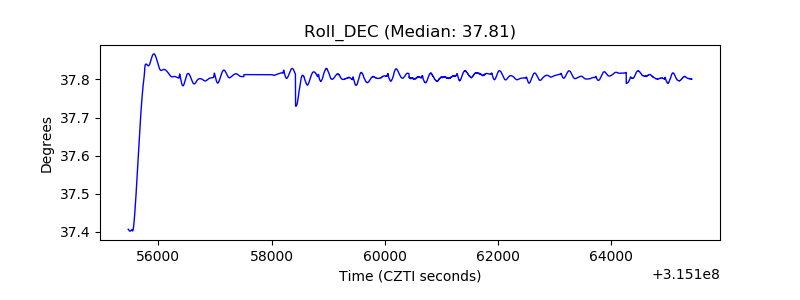 |
| _Roll_RA | 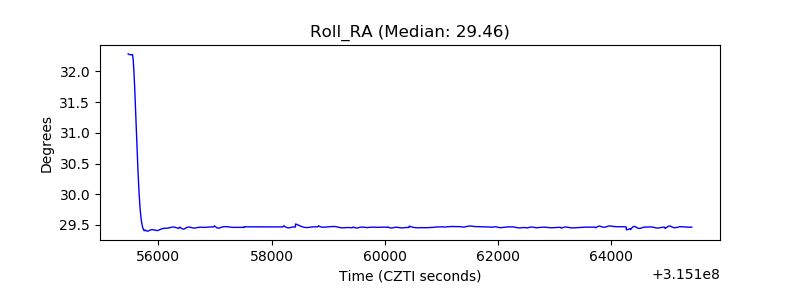 |
| Veto Counter |  |