| Param | Original file | Final file |
|---|---|---|
| Filename | modeM0/AS1A07_062T01_9000003392_22968cztM0_level2.evt | modeM0/AS1A07_062T01_9000003392_22968cztM0_level2_quad_clean.evt |
| Size (bytes) | 454,368,960 | 92,626,560 |
| Size | 433.3 MB | 88.3 MB |
| Events in quadrant A | 3,161,291 | 605,196 |
| Events in quadrant B | 3,059,516 | 614,016 |
| Events in quadrant C | 3,145,781 | 578,789 |
| Events in quadrant D | 3,965,134 | 566,566 |
| Mode M9 | |||
|---|---|---|---|
| Quadrant | BADHDUFLAG | Total packets | Discarded packets |
| A | 0 | 15 | 0 |
| B | 0 | 16 | 0 |
| C | 0 | 16 | 0 |
| D | 0 | 16 | 0 |
| Mode SS | |||
|---|---|---|---|
| Quadrant | BADHDUFLAG | Total packets | Discarded packets |
| A | 0 | 128 | 0 |
| B | 0 | 128 | 0 |
| C | 0 | 128 | 0 |
| D | 0 | 128 | 0 |
| Mode M0 | |||
|---|---|---|---|
| Quadrant | BADHDUFLAG | Total packets | Discarded packets |
| A | 0 | 13515 | 2 |
| B | 0 | 13154 | 2 |
| C | 0 | 13367 | 2 |
| D | 0 | 16131 | 2 |
| Quadrant | Total seconds | Saturated seconds | Saturation percentage |
|---|---|---|---|
| A | 6315 | 21 | 0.332542% |
| B | 6315 | 28 | 0.443389% |
| C | 6315 | 81 | 1.282660% |
| D | 6315 | 104 | 1.646873% |
Noise dominated data is calculated using 1-second bins in cleaned event files. If a bin has >2000 counts, and if more than 50% of those come from <1% of pixels, then it is considered to be noise-dominated and hence unusable.
| Quadrant | # 1 sec bins | Bins with >0 counts | Bins with >2000 counts | High rate bins dominated by noise | Noise dominated (total time) | Noise dominated (detector-on time) | Marked lightcurve |
|---|---|---|---|---|---|---|---|
| A | 7450 | 6316 | 3 | 3 | 0.04% | 0.05% | 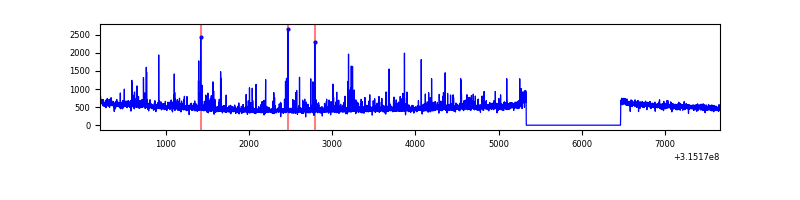 |
| B | 7450 | 6316 | 3 | 3 | 0.04% | 0.05% | 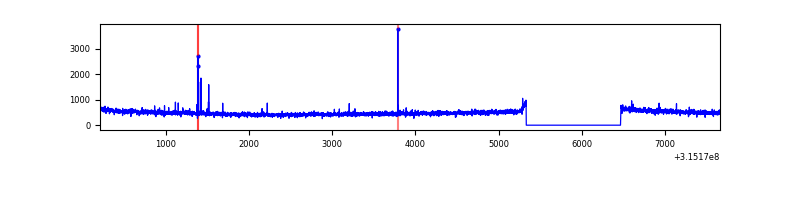 |
| C | 7450 | 6316 | 7 | 7 | 0.09% | 0.11% | 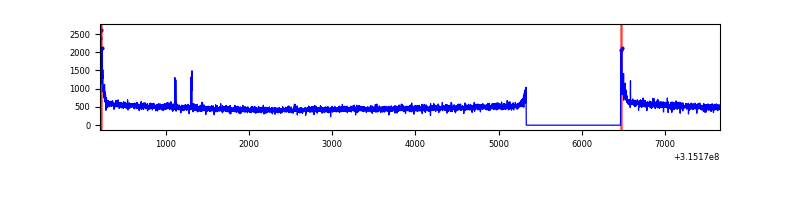 |
| D | 7450 | 6316 | 60 | 60 | 0.81% | 0.95% | 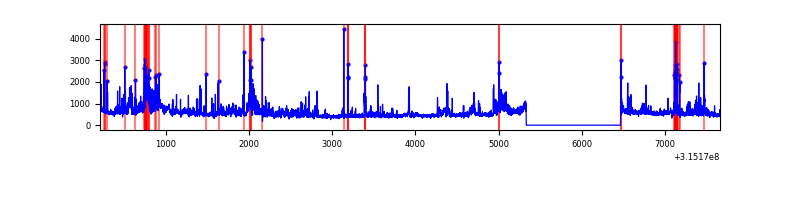 |
Top three noisy pixels from each quadrant. If the there are fewer than three noisy pixels in the level2.evt file, extra rows are filled as -1
| Pixel properties | Quadrant properties | ||||||
|---|---|---|---|---|---|---|---|
| Quadrant | DetID | PixID | Counts | Sigma | Mean | Median | Sigma |
| A | 6 | 16 | 134307 | 866.86 | 771 | 756 | 154.1 |
| A | 13 | 170 | 50572 | 323.35 | 771 | 756 | 154.1 |
| A | 13 | 254 | 10797 | 65.17 | 771 | 756 | 154.1 |
| B | 12 | 111 | 17421 | 113.71 | 771 | 752 | 146.6 |
| B | 11 | 111 | 15401 | 99.93 | 771 | 752 | 146.6 |
| B | 0 | 189 | 14857 | 96.22 | 771 | 752 | 146.6 |
| C | 14 | 238 | 117595 | 670.26 | 744 | 749 | 174.3 |
| C | 0 | 10 | 98675 | 561.73 | 744 | 749 | 174.3 |
| C | 0 | 239 | 24337 | 135.31 | 744 | 749 | 174.3 |
| D | 1 | 52 | 625878 | 3445.34 | 753 | 731 | 181.4 |
| D | 13 | 172 | 171834 | 942.99 | 753 | 731 | 181.4 |
| D | 13 | 153 | 146399 | 802.81 | 753 | 731 | 181.4 |
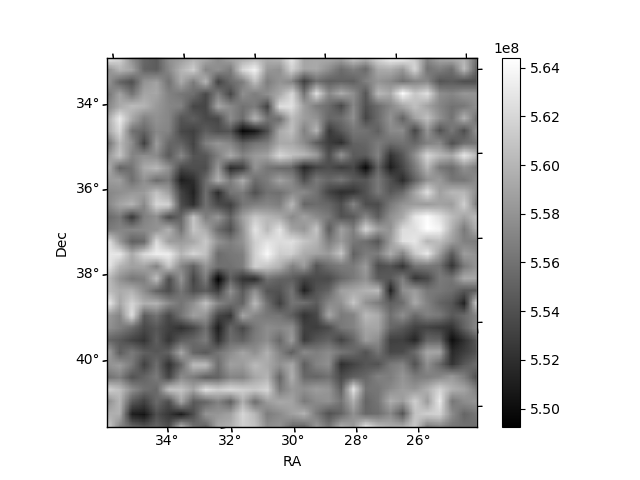
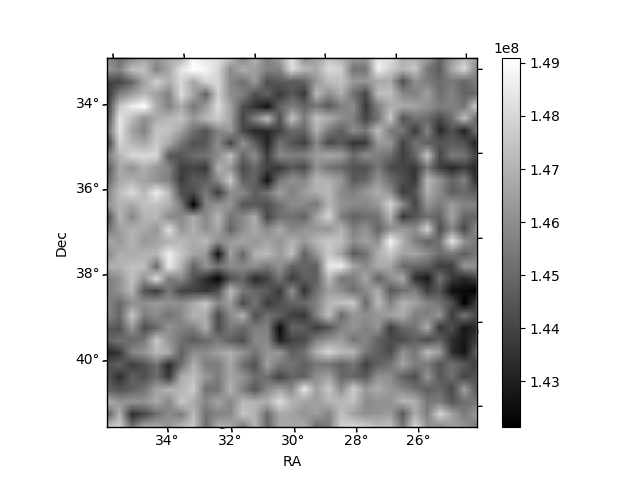
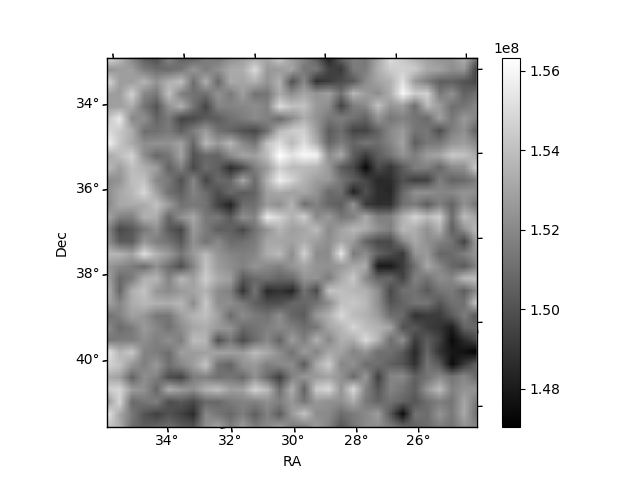
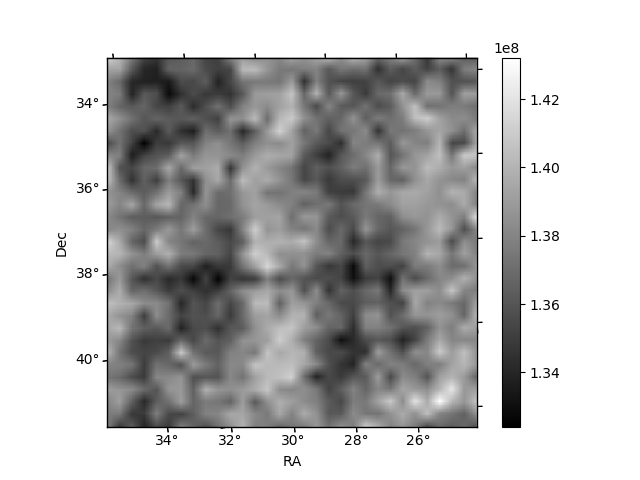
Histogram calculated using DETX and DETY for each event in the final _common_clean file
| Quadrant A | 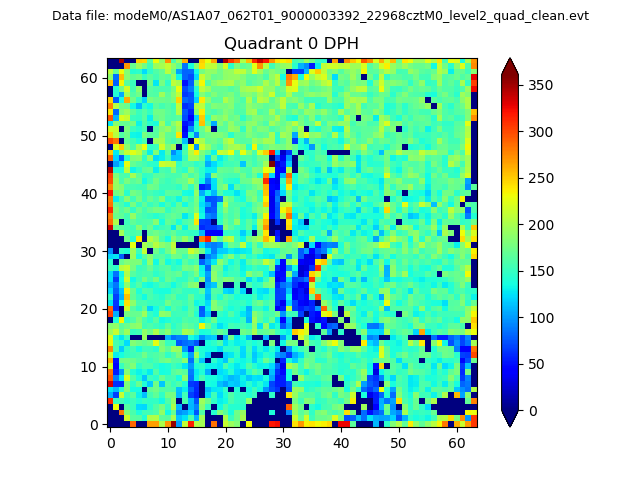 |
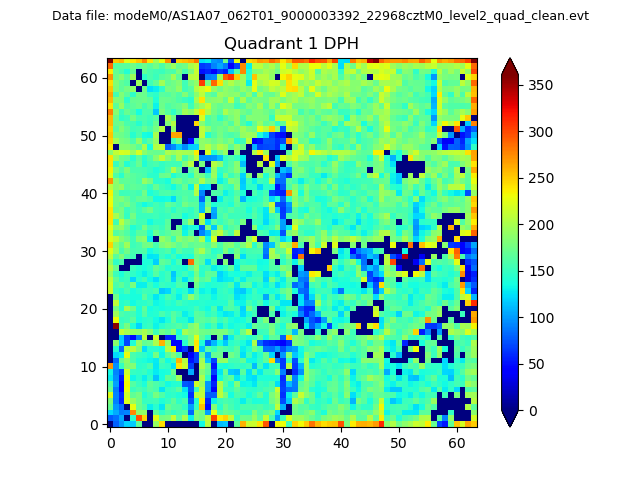 |
Quadrant B |
|---|---|---|---|
| Quadrant D | 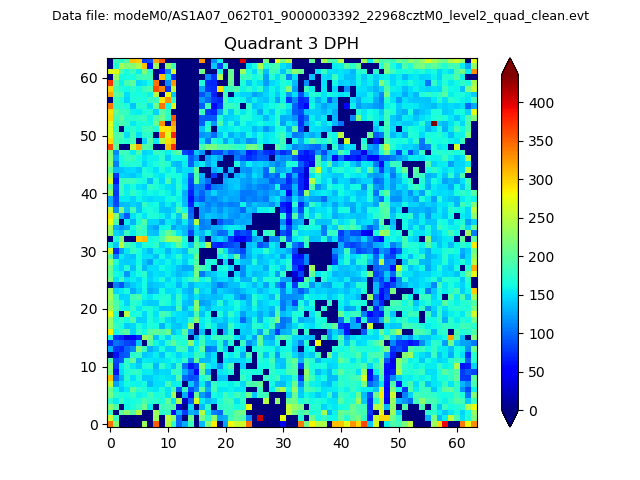 |
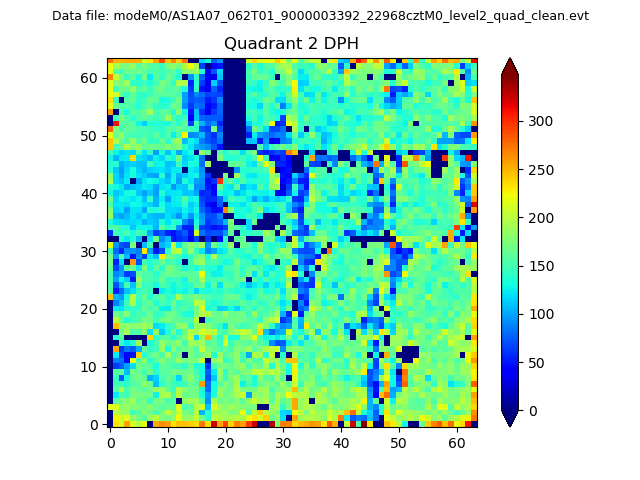 |
Quadrant C |
| Plot type | Count rate plots | Images |
|---|---|---|
| Comparison with Poisson distribution Blue bars denote a histogram of data divided into 1 sec bins. Red curve is a Poisson curve with rate = median count rate of data. |
 |
 |
| Quadrant-wise count rates Data is divided into 100 sec bins |
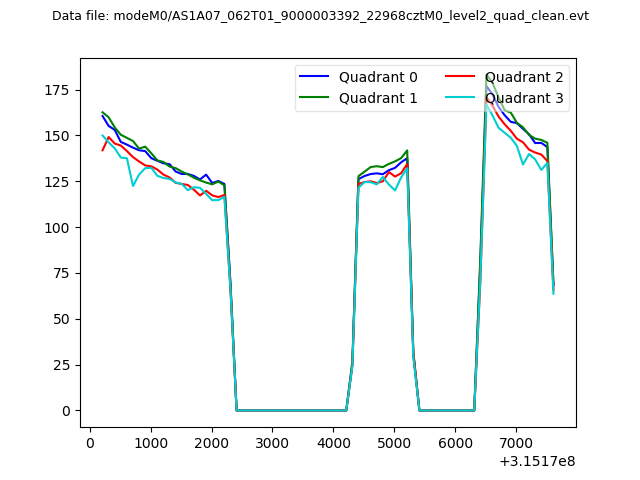 |
|
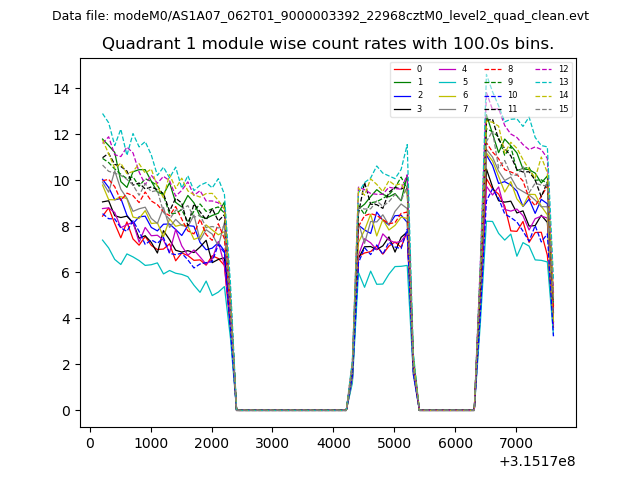
| Module-wise count rates for Quadrant A Data is divided into 100 sec bins |
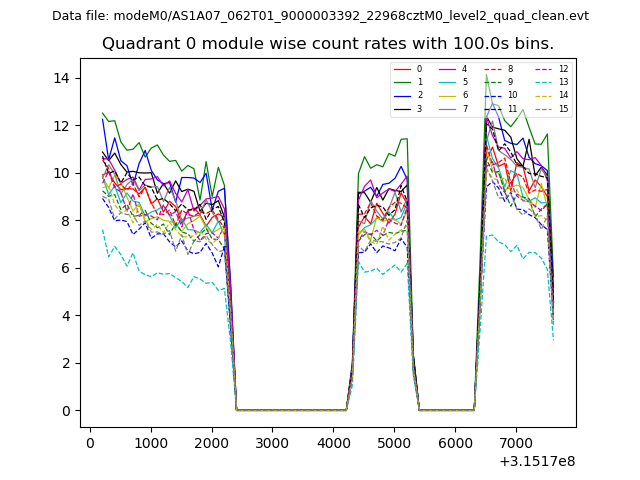 |
 |
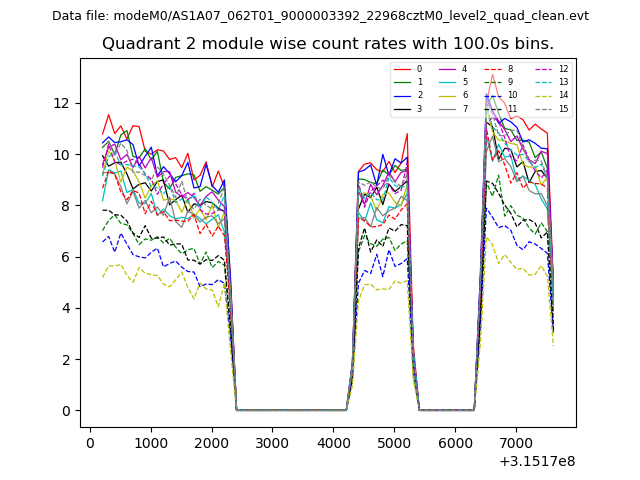
| Module-wise count rates for Quadrant B Data is divided into 100 sec bins |
 |
 |
| Module-wise count rates for Quadrant C Data is divided into 100 sec bins |
 |
 |
| Module-wise count rates for Quadrant D Data is divided into 100 sec bins |
 |
 |
| Parameter | Plot |
|---|---|
| CZT HV Monitor | 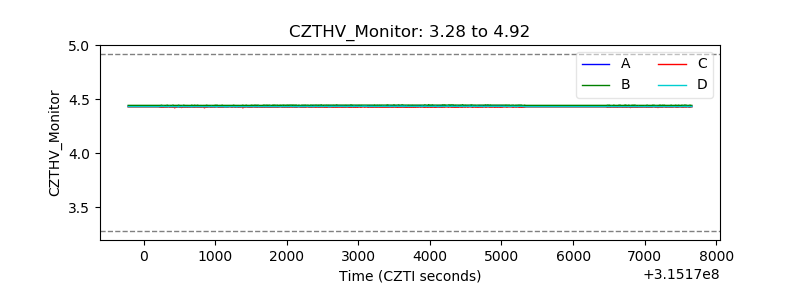 |
| D_VDD | 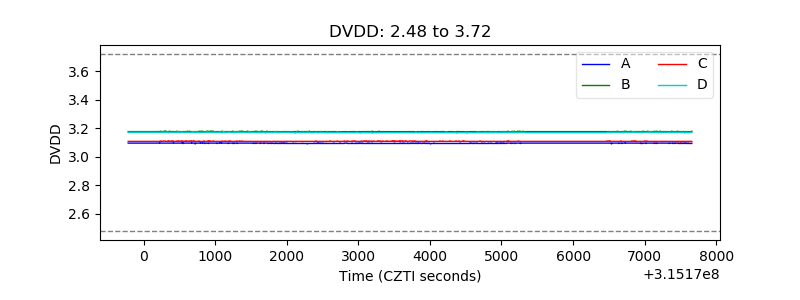 |
| Temperature 1 |  |
| Veto HV Monitor | 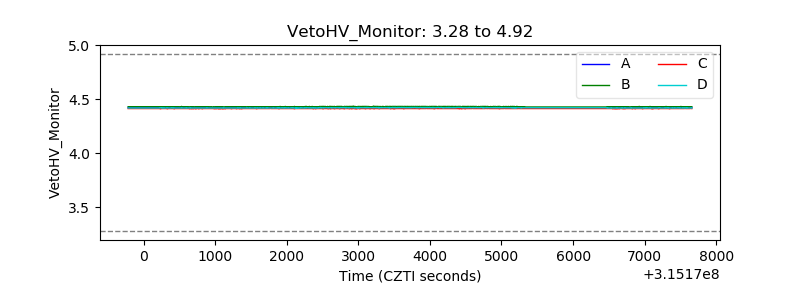 |
| Veto LLD | 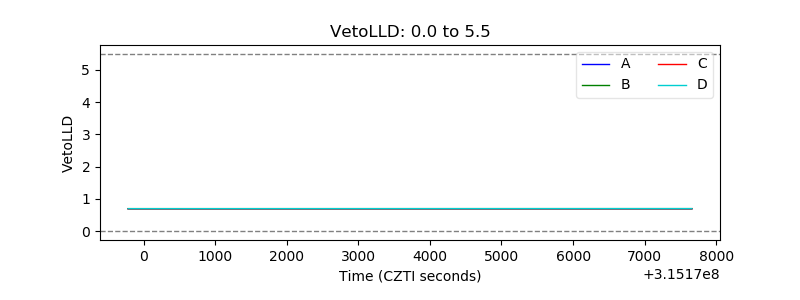 |
| Alpha Counter | 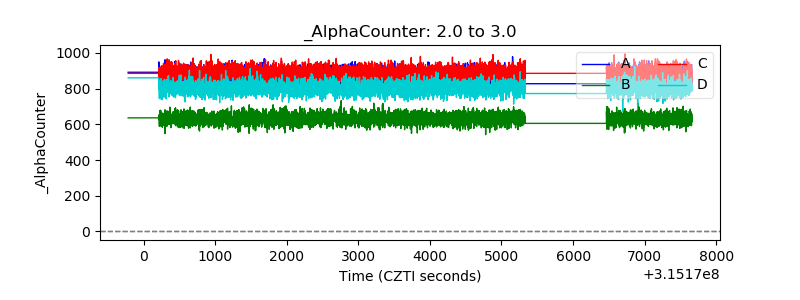 |
| _CPM_Rate | 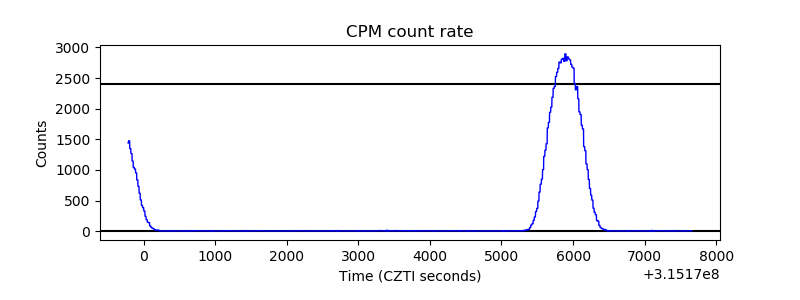 |
| CZT Counter | 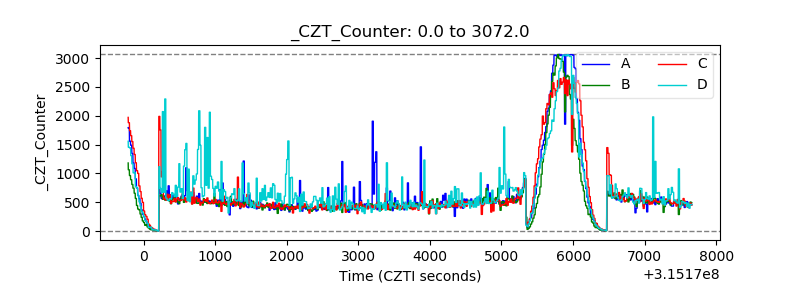 |
| +2.5 Volts monitor |  |
| +5 Volts monitor |  |
| _ROLL_ROT | 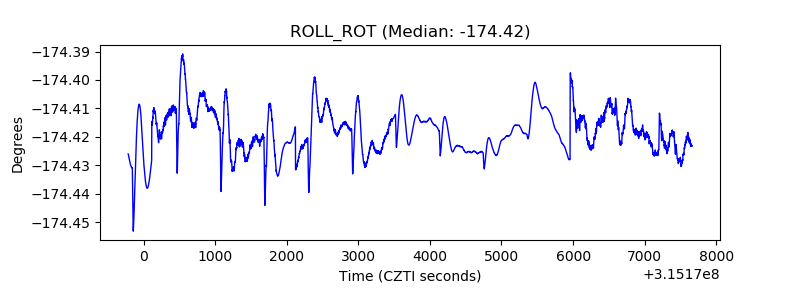 |
| _Roll_DEC |  |
| _Roll_RA | 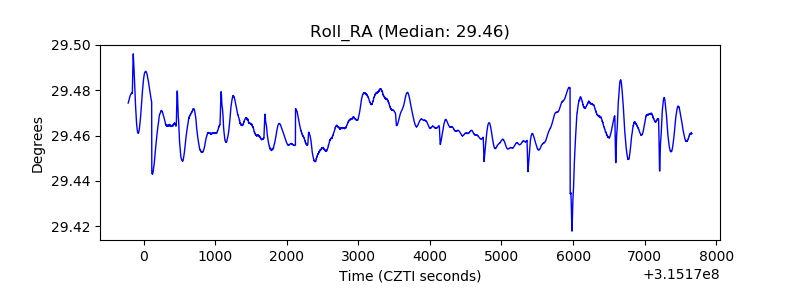 |
| Veto Counter | 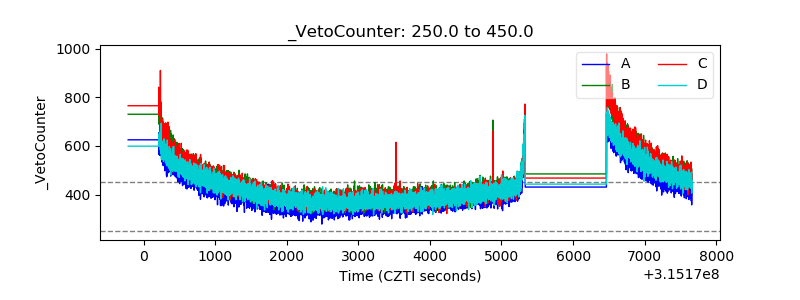 |